azure未连接_将Azure Databricks数据连接到Power BI Desktop
azure未连接
This article is next in the Azure Databricks series, where we will learn how to connect data in Azure Databricks to the Power BI Desktop. We will also talk briefly about visualizations in the Databricks service.
本文是Azure Databricks系列的下一篇,我们将在其中学习如何将Azure Databricks中的数据连接到Power BI桌面。 我们还将简要讨论Databricks服务中的可视化。
Azure Databricks (an Apache Spark implementation on Azure) is a big data analytics platform for the Microsoft cloud – Azure. This fast service offers a collaborative workspace for data scientists & Business analysts and also integrates seamlessly with Azure services and several BI tools like Power BI, Tableau, etc.
Azure Databricks(Azure上的Apache Spark实施)是Microsoft云– Azure的大数据分析平台。 这项快速服务为数据科学家和业务分析师提供了一个协作式工作区,并且与Azure服务和Power BI,Tableau等多个BI工具无缝集成。
With boatloads of data being generated each second and still growing as I am writing, visual representation (like graphs, charts, maps, etc.) of this data provides a comprehensible approach for data engineers to discover quick insights about it by detecting patterns, trends, and outliers.
每秒生成大量数据并在撰写本文时仍在不断增长,这些数据的可视化表示(如图形,图表,地图等)为数据工程师提供了一种易于理解的方法,可通过检测模式,趋势来快速了解其数据。以及离群值。
When talking about visualizations, Power BI Desktop is one of the powerful tools that provide rich and interactive visualizations with a plethora of default and custom visuals. This tool is not only limited to creating visualizations but also lets you transform, clean the data, and also publish it to the Power BI Service, which is a cloud-based service.
在讨论可视化时,Power BI Desktop是功能强大的工具之一,可提供丰富的交互式可视化以及大量的默认和自定义可视化。 该工具不仅限于创建可视化,而且还允许您转换,清理数据并将其发布到Power BI Service(基于云的服务)。
In a nutshell, both Azure Databricks and Power BI are powerful chambers for big data exploration, analysis, and visualization. Using Databricks in Power BI Desktop allows us to lever fast performance benefits of it for all business users. Since all business users won’t be comfortable in using Azure Databricks, Power BI Desktop, being a drag and drop software, is a relatively simpler interface for all business users to use.
简而言之,Azure Databricks和Power BI都是用于大数据探索,分析和可视化的强大工具。 在Power BI Desktop中使用Databricks使我们能够为所有业务用户利用其快速的性能优势。 由于所有业务用户都不习惯使用Azure Databricks,因此作为拖放软件的Power BI Desktop是一个相对简单的界面,可供所有业务用户使用。
前提条件 (Pre-requisite)
I assume you are familiar with Azure Databricks and how to create a Cluster and notebooks in it. In case you are not sure about this, I would recommend to quickly run through this article: A beginner’s guide to Azure Databricks to understand these basics.
我假设您熟悉Azure Databricks以及如何在其中创建群集和笔记本。 如果您对此不确定,建议您快速阅读本文: Azure Databricks入门指南,以了解这些基础知识。
Before we go ahead and see the integration of Databricks data with the Power BI Desktop, I would like to take a few minutes to quickly demonstrate some examples of data visualizations available in Azure Databricks.
在继续了解Databricks数据与Power BI Desktop的集成之前,我想花几分钟来快速演示Azure Databricks中提供的一些数据可视化示例。
Make sure you have a Databricks cluster up and running, and a notebook, either Python or Scala is in place. Here I have created a cluster (azdbpowerbicluster) with Python (azdbpython) notebook.
确保您已建立并运行一个Databricks集群,并且已安装了笔记本电脑(Python或Scala)。 在这里,我使用Python(azdbpython)笔记本创建了一个集群(azdbpowerbicluster)。
获取我们的数据 (Getting our data)
Let’s quickly import data in the Databricks service. To do this, click on the Data icon on the left vertical menu bar and select Add Data:
让我们快速将数据导入Databricks服务中。 为此,请点击左侧垂直菜单栏上的数据图标,然后选择添加数据 :
Browse and upload your file, as shown below. In case you want to refer to the file used here in this article, you can get it from here. We are using the one that we have used in our series. This is Sales data per region for different items and channels.
浏览并上传文件,如下所示。 如果要引用本文此处使用的文件,可以从此处获取。 我们正在使用我们在本系列中使用过的那个。 这是不同项目和渠道的每个地区的销售数据。
The following code helps to read our csv file into mydf data frame:
以下代码有助于将我们的csv文件读取到mydf数据框中:
mydf = sqlContext.read.csv("/FileStore/tables/1000_Sales_Records-d540d.csv",header=True)
We are using the display() function to display the results of the CSV file. You may notice the bar chart icon at the bottom side in the below screenshot. Click on the drop-down arrow, located right next to the bar chart icon, this button allows us to visualize data in Databricks and supports a rich set of plot types (like Bar, Scatter, Map, Line, Area, Pie, etc.).
我们正在使用display()函数来显示CSV文件的结果。 您可能会注意到以下屏幕截图底部的条形图图标。 单击条形图图标旁边的下拉箭头,此按钮使我们可以可视化Databricks中的数据,并支持一组丰富的绘图类型(如条形图,散点图,地图,折线图,面积图,饼图等)。 )。
display(mydf)
Azure Databricks中的数据可视化 (Data Visualizations in Azure Databricks)
To configure a bar chart, click on the Plot Options… and select fields for Keys, Series groupings, and Values, as shown below. It shows the preview of the chart. Select Apply to plot these values for the bar chart:
要配置条形图,请单击“ 绘图选项” ,然后为“键”,“系列”分组和“值”选择字段,如下所示。 它显示了图表的预览。 选择“ 应用”以绘制条形图的这些值:
The below bar chart is displayed showing Total Profit values for each Item Type (Cosmetics, Fruits, etc.) and sales platform (Online/Offline)
显示以下条形图,显示每种物料类型(化妆品,水果等)和销售平台(在线/离线)的总利润值
In case you want to choose another chart type, click on the drop-down arrow right next to the bar chart icon, and select the chart type. Suppose, we selected the Pie chart visualization, with customized fields in the Keys, groupings, and Values section, we can plot these charts with a few clicks. Below are a few examples of pie charts:
如果要选择其他图表类型,请单击条形图图标旁边的下拉箭头,然后选择图表类型。 假设我们选择了饼图可视化,并在“键”,“分组”和“值”部分中使用了自定义字段,只需单击几下即可绘制这些图。 以下是饼图的一些示例:
The above examples were the basic visualizations that are supported natively to visualize data in Databricks service. This quick demo intended to give an idea about its potential and how we can customize the fields to display a variety of charts in the Databricks portal.
上面的示例是本机支持的基本可视化,用于可视化Databricks服务中的数据。 此快速演示旨在提供有关其潜力以及我们如何自定义字段以在Databricks门户中显示各种图表的想法。
If you are interested in learning more about this, you can refer to the Visualizations article. Now let’s move forward and take a peek at how we can integrate data in Databricks with Power BI Desktop and analyze data using powerful visualizations that Power BI has to offer.
如果您有兴趣了解有关此内容的更多信息,可以参考可视化文章。 现在,让我们继续前进,看看如何将Databricks中的数据与Power BI Desktop集成在一起,以及如何使用Power BI必须提供的强大可视化工具来分析数据。
将Azure Databricks数据连接到Power BI Desktop (Connecting Azure Databricks data to Power BI Desktop)
We need to make sure the Databricks cluster is up and running. The following are the steps for the integration of Azure Databricks with Power BI Desktop.
我们需要确保Databricks群集已启动并正在运行。 以下是将Azure Databricks与Power BI Desktop集成的步骤。
步骤1 –构造连接URL (Step 1 – Constructing the connection URL)
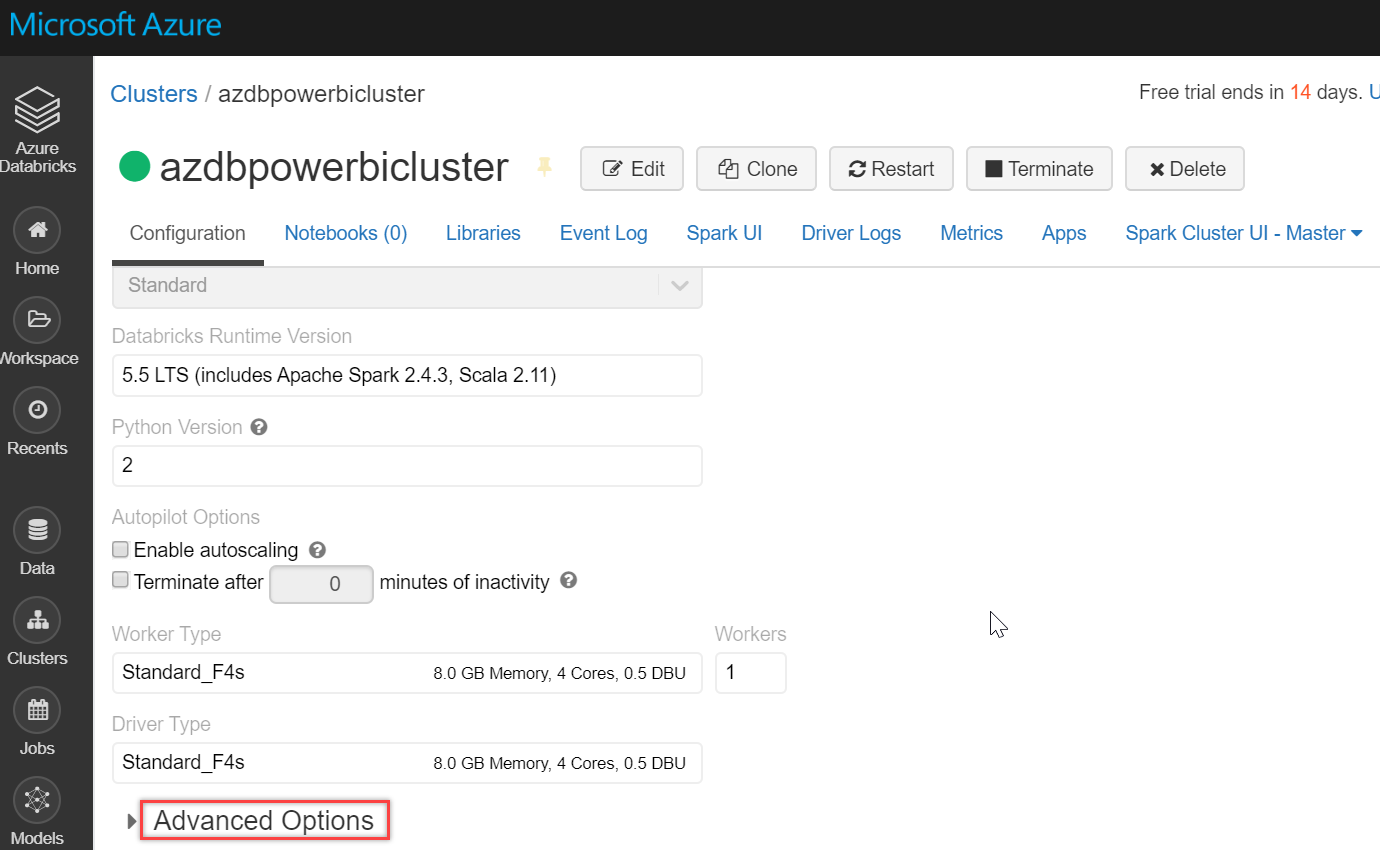
Go to the cluster and click on Advanced Options, as shown below:
转到集群并单击高级选项,如下所示:
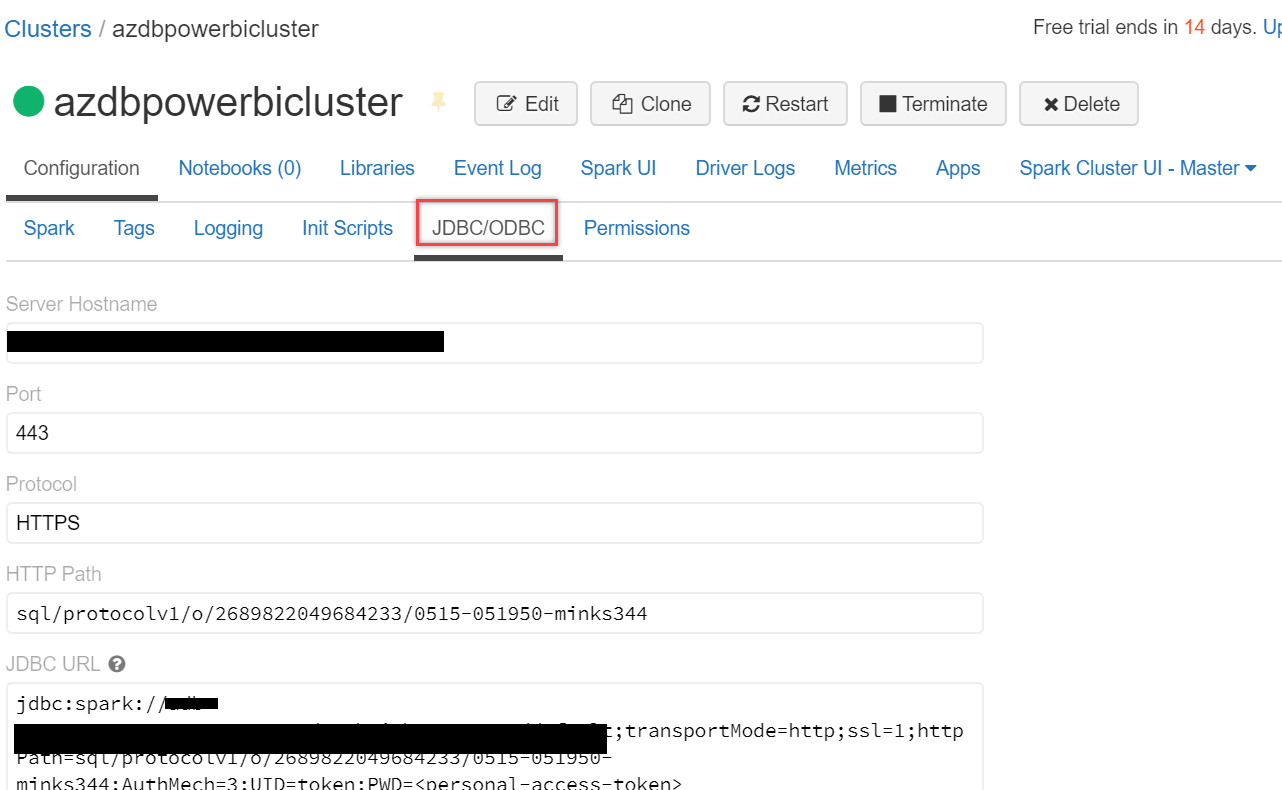
Scroll down a little and select the JDBC/ODBC tab. Copy and paste the JDBC URL in a notepad. We will have to tweak this URL to set up a Spark cluster connection in Power BI Desktop:
向下滚动一点,然后选择JDBC / ODBC选项卡。 将JDBC URL复制并粘贴到记事本中。 我们将必须调整此URL才能在Power BI Desktop中设置Spark集群连接:
- jdbc:spark with jdbc:spark替换为https: https:
- Next, we will have to delete a few sections from it, delete from default;transportMode…to ..Path= and again from Authmech… to …token>
- 接下来,我们将不得不从中删除一些部分,从default; transportMode …到.. Path = ,再从Authmech …到… token> 删除 。
- Your final URL should look somewhat like this – https://<region>.azuredatabricks.net:<port>/sql/protocolv1/o/<key>/<key> 您的最终到达网址应看起来像这样– https:// <region> .azuredatabricks.net:<port> / sql / protocolv1 / o / <key> / <key>
- Save it somewhere; we will be using it in Power BI for the connection 将其保存在某处; 我们将在Power BI中使用它进行连接
步骤2 –生成个人访问令牌 (Step 2 – Generate a personal access token)
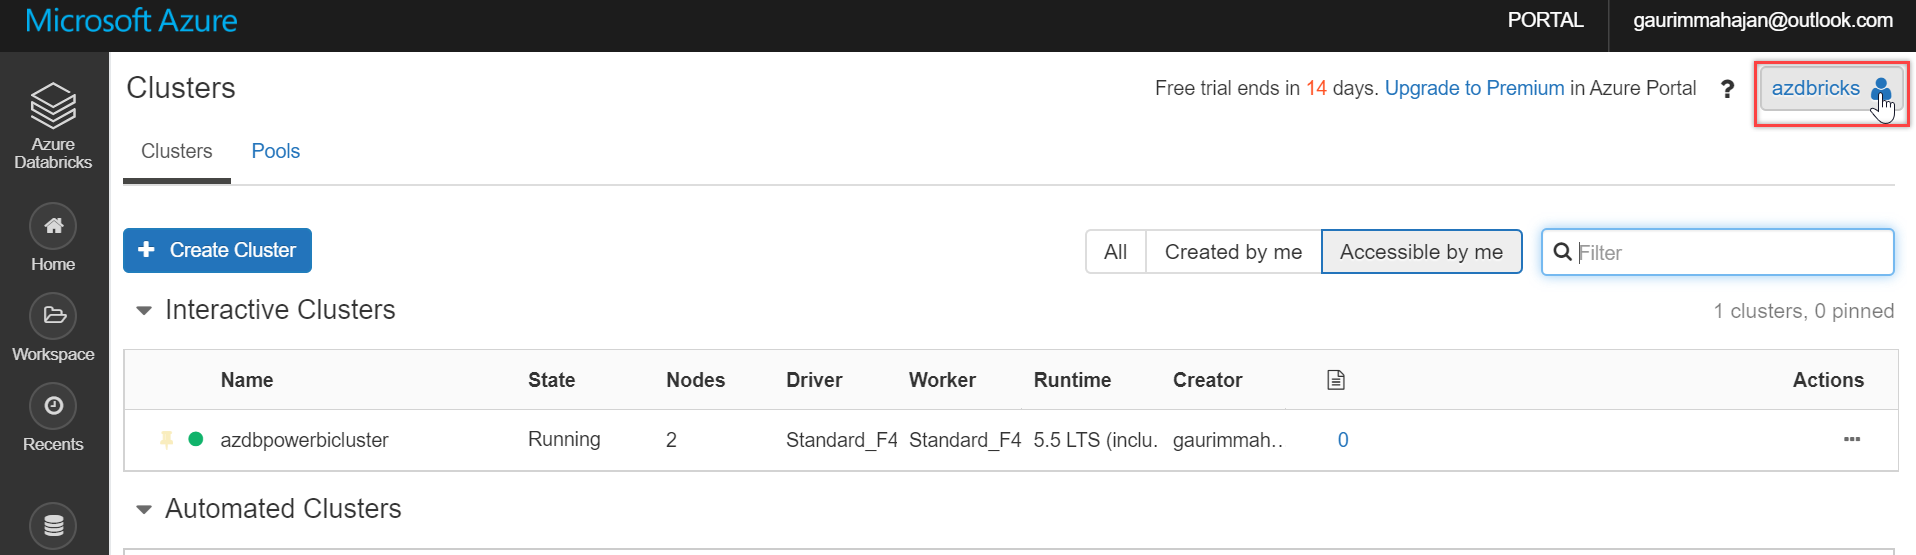
To connect to our clusters, we will need a personal access token in Databricks. To do this, go to the Databricks portal and click the user profile icon in the top right corner of it, as shown below:
要连接到集群,我们将需要Databricks中的个人访问令牌。 为此,请转到Databricks门户并单击其右上角的用户个人资料图标,如下所示:
And select User Settings:
然后选择用户设置 :
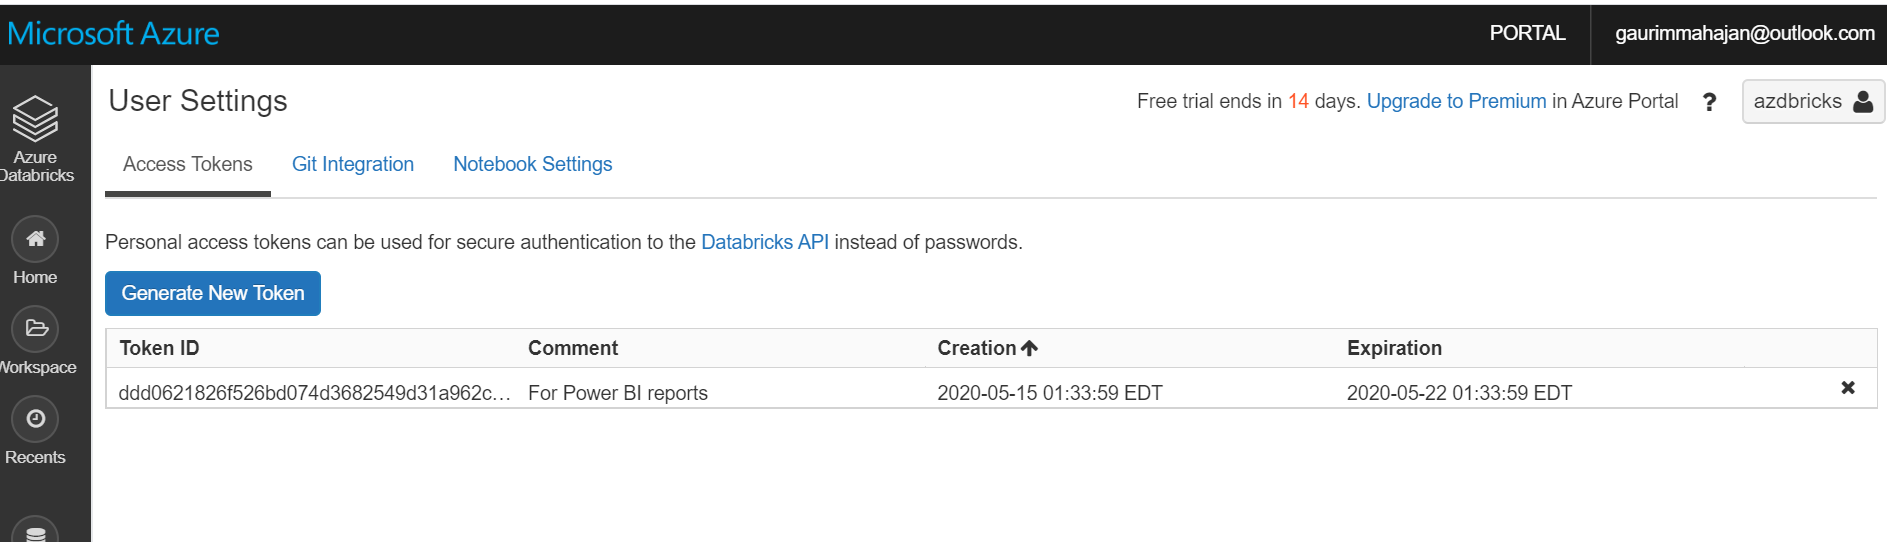
Click the Generate New Token button on the Access Tokens tab, as shown below:
单击“ 访问令牌”选项卡上的“ 生成新令牌”按钮,如下所示:
Type in a description for this Token and also mention the period of this Token. For this demo, I am entering the expiration period as 7 days. You can select this value per your business needs. And finally, click the Generate button to create one for you:
输入此令牌的描述,并提及该令牌的期限。 对于此演示,我输入的有效期为7天。 您可以根据业务需要选择此值。 最后,单击生成按钮为您创建一个:
Copy and paste the Token in a notepad as you won’t be able to see it again. Once, it is saved, click Done:
将令牌复制并粘贴到记事本中,因为您将无法再次看到它。 保存后,点击完成 :
You can see the Token is generated successfully:
您可以看到令牌已成功生成:
步骤3 –连接Power BI Desktop (Step 3 – Connect with Power BI Desktop)
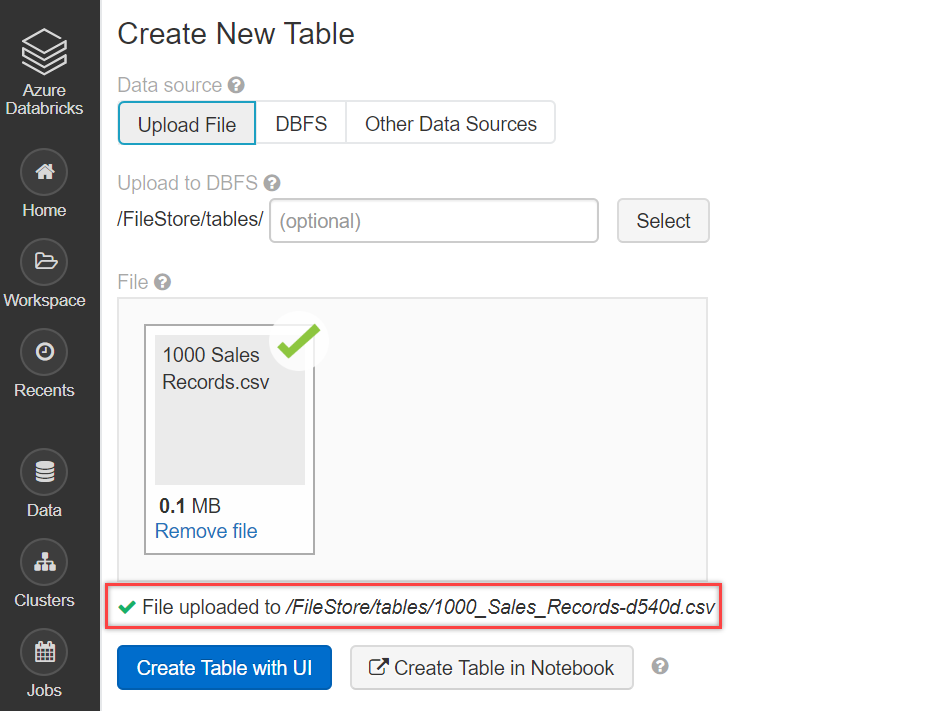
For the integration, we will first have to open the Power BI Desktop app. In case you don’t have it, you can download the latest version from here. We will use the same CSV file, (1000 Sales Records.csv) used earlier in this article, and upload it on the Databricks portal using the Create Table with UI option.
对于集成,我们首先必须打开Power BI Desktop应用程序。 如果您没有它,可以从此处下载最新版本。 我们将使用本文前面使用的相同CSV文件(1000 Sales Records.csv),并使用“ 使用UI创建表”选项将其上传到Databricks门户上。
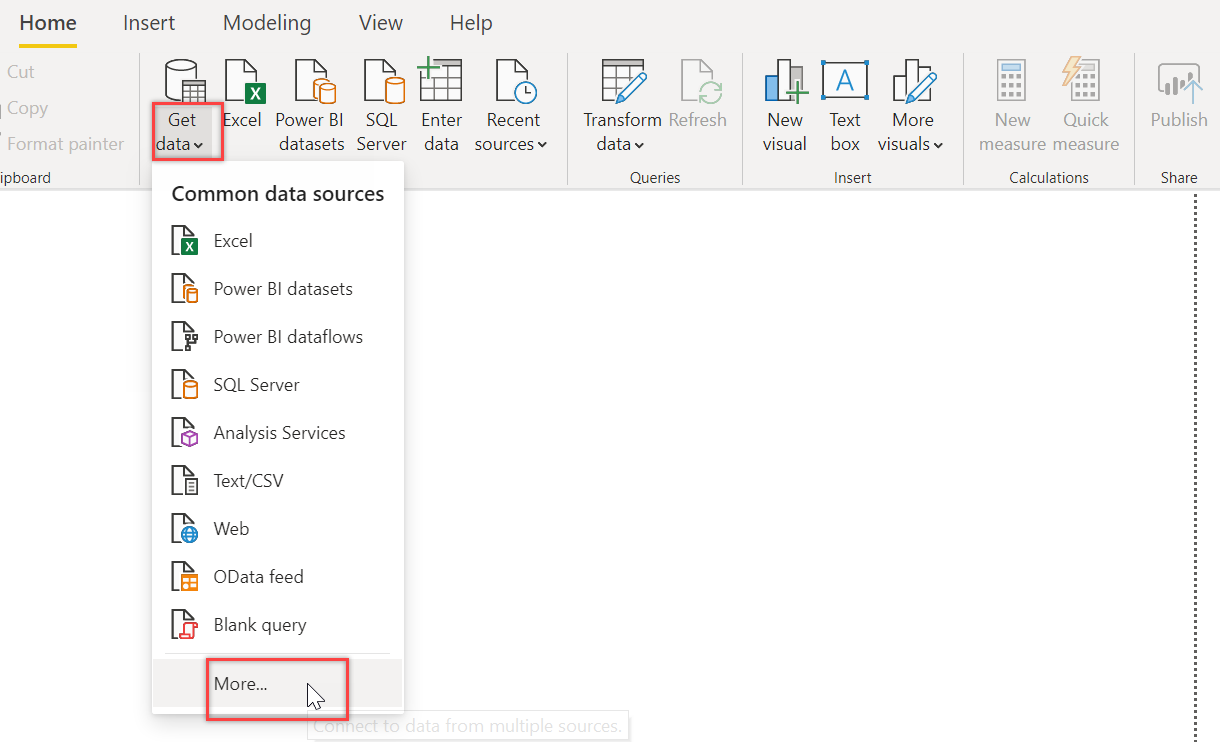
On Power BI Desktop, click Get data drop-down list and choose More… on the Home ribbon:
在Power BI Desktop上,单击“ 获取数据”下拉列表,然后在“ 主页”功能区上选择“ 更多... ”:
On the Get Data dialog box, select Other and choose Spark connector. Click Connect:
在“ 获取数据”对话框中,选择“ 其他”,然后选择“ Spark连接器”。 点击连接 :
On the Spark dialog box, copy-paste the JDBC URL (created in Step 1) in the Server field. Select HTTP as the Protocol and DirectQuery in the Data Connectivity mode, and click OK:
在“ Spark”对话框中,在“ 服务器”字段中复制粘贴JDBC URL (在步骤1中创建)。 在数据连接 模式下 ,选择HTTP作为协议和DirectQuery ,然后单击确定 :
In the next dialog box, type in token as the User name and paste Token value that we generated in Step 2 in the Password field. Then click Connect:
在下一个对话框中,输入令牌作为“ 用户名”,然后将我们在步骤2中生成的“ 令牌”值粘贴到“ 密码”字段中。 然后点击连接 :
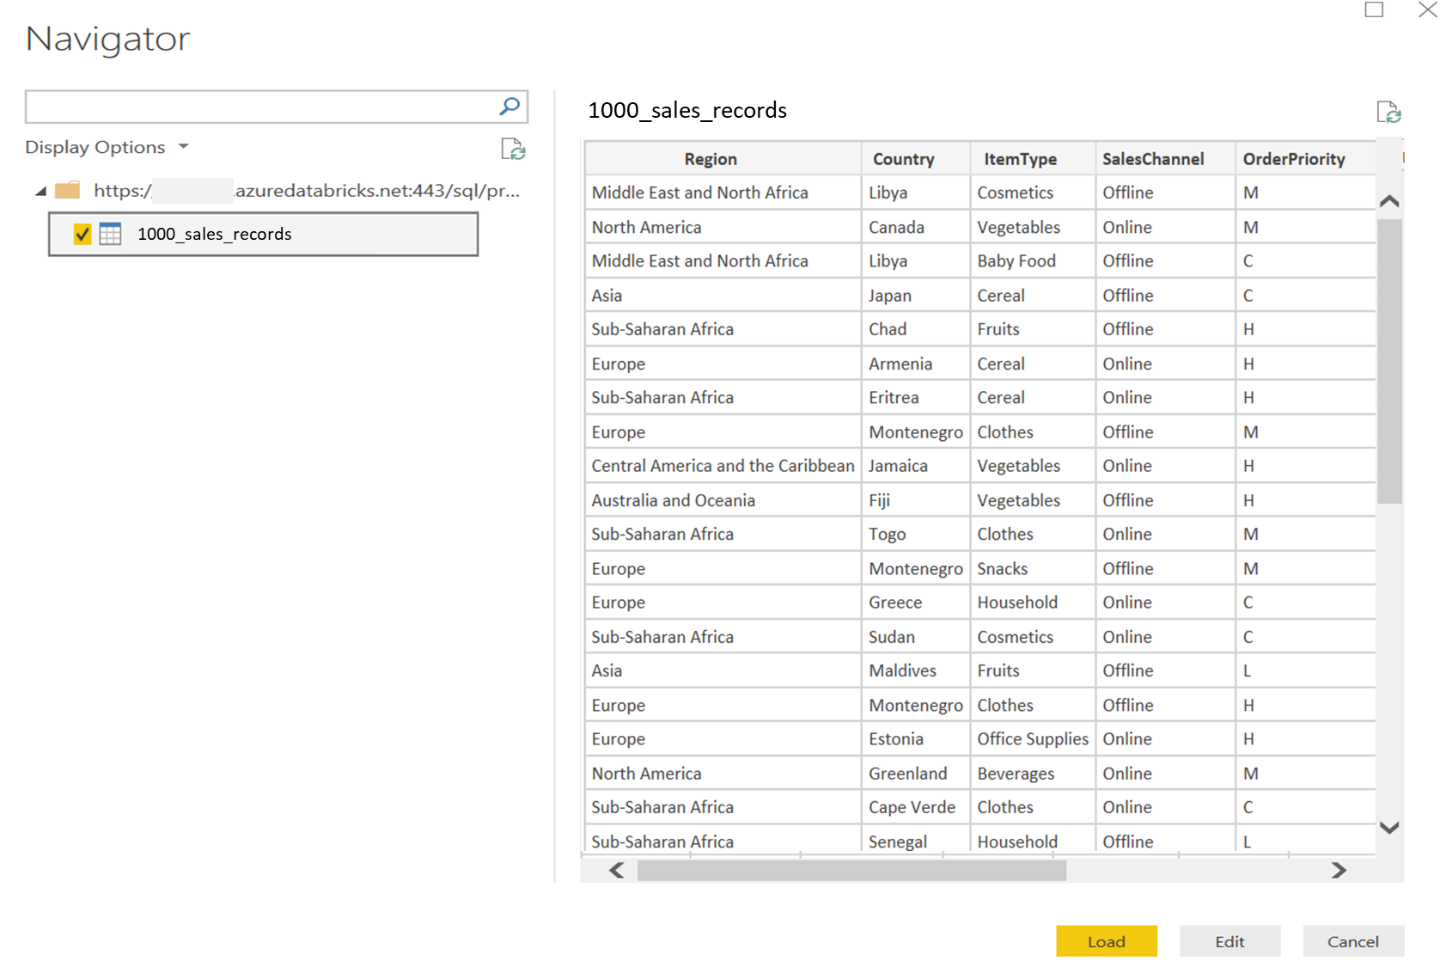
If everything was in place, you should be able to see all the tables available in your Databricks cluster in the Power BI Navigator dialog. You can select the data table(s) and select the Load option to load data or the Edit option to edit this data before loading in Power BI Desktop:
如果一切就绪,则应该可以在Power BI Navigator对话框中查看Databricks群集中所有可用的表。 您可以选择数据表,然后选择“ 加载”选项以加载数据 或“ 编辑”选项以在加载到Power BI Desktop之前编辑此数据:
Now you can explore and visualize this data as you would do with any other data in Power BI Desktop. In case you are new to Power BI Desktop visualizations, I would recommend the Visualization types in Power BI article.
现在,您可以像使用Power BI Desktop中的任何其他数据一样浏览和可视化这些数据。 如果您不熟悉Power BI Desktop可视化,我建议您在Power BI文章中推荐可视化类型 。
摘要 (Summary )
In this article, we learned how, with a few clicks, we can connect Azure Databricks data to Power BI Desktop quickly for rich visualizations to gain better insights about the data. We also covered a few data visualizations available in Databricks service. If you have any questions, please feel free to ask in the comments section below.
在本文中,我们了解了单击几下即可如何将Azure Databricks数据快速连接到Power BI Desktop,以进行丰富的可视化,从而获得有关数据的更好的见解。 我们还介绍了Databricks服务中可用的一些数据可视化。 如果您有任何疑问,请随时在下面的评论部分中提问。
翻译自: https://www.sqlshack.com/connect-azure-databricks-data-to-power-bi-desktop/
azure未连接
azure未连接_将Azure Databricks数据连接到Power BI Desktop相关推荐
- azure未连接_查找影响Azure成本的未使用资源
azure未连接 To reduce Azure costs on unused and unnecessary resources, we should design with prevention ...
- azure未连接_处理影响Azure成本的未使用和不必要的资源
azure未连接 Two of the more challenging causes of an increase in Azure costs are unused and unnecessary ...
- power bi可视化表_滚动器可视化功能,用于Power BI Desktop中的股价变动
power bi可视化表 In the article, Candlestick chart for stock data analysis in Power BI Desktop, we explo ...
- power bi导入文件夹_从Power BI Desktop中的PDF文件导入数据
power bi导入文件夹 Power BI Desktop is a useful reporting and analytical tool to represent data in variou ...
- 使用Power BI Desktop可视化分析冠状病毒数据
This article gives you an overview of representing coronavirus spread using Power BI Desktop visuali ...
- 带着问题读 TiDB 源码:Power BI Desktop 以 MySQL 驱动连接 TiDB 报错
原文来源: https://tidb.net/blog/d343818b 作者:张翔 常有人说,阅读源码是每个优秀开发工程师的必经之路,但是在面对像类似 TiDB 这样复杂的系统时,源码阅读是一个非常 ...
- azure云数据库_在Azure SQL数据库中实现动态数据屏蔽
azure云数据库 In this article, we will review Dynamic Data Masking in the Azure SQL database. Dynamic Da ...
- azure云数据库_使用Azure SQL数据库构建ASP.NET应用
azure云数据库 In this article, you will learn about Azure SQL Database and its uses. Then the article sp ...
- azure云数据库_在Azure Cosmos DB中使用PowerShell创建和删除数据库
azure云数据库 Our testing or development may call for dynamic creation on the database level for Azure C ...
最新文章
- Clean-Code: 注释
- libsvm java api文档_libsvm-javaAPI
- python多线程爬虫实例-python 多线程爬虫 实例
- 【FTP】FTP服务器的搭建
- 应用编排与管理:核心原理
- 需要天天读月月读年年读的书
- Serena Dimensions 介绍
- sql in转换为join_同一个SQL语句,为啥性能差异咋就这么大呢?(1分钟系列)
- [LinuxVim]基础01
- 剑指offer||3 前n个数二进制数中1的个数
- lenna的真实面目
- 数据结构与算法笔记一:稀疏数组的应用
- 游戏测试流程及工作内容
- CoreOS Linux available in China
- 无套路,鬼灭之刃同人游戏
- 怎样合理有效的与人争论(讨论)问题?
- 低风险整体式微服务演进第二部分
- 亚马逊图书销量前五十分析
- win10或win11右键管理找不到文件解决
- poi-tl实现自定义RenderPolicy实现对表格进行列表