如何使用Picterra的地理空间平台分析卫星图像
From April-May 2020, Sentinel-Hub had organized the third edition of their custom script competition. The competition was organized in collaboration with the Copernicus EU Earth Observation programme, the European Space Agency and AI4EO consortium.
从2020年4月至5月,Sentinel-Hub组织了第三次自定义脚本竞赛 。 该竞赛是与哥白尼欧盟地球观测计划 , 欧洲航天局和AI4EO财团合作组织的 。
Motive of the competition:
比赛动机:
To look for new, innovative scripts, which enable users to make sense of Earth Observation data. It was designed to find solutions to the huge challenges in the new ‘normal’
寻找新的,创新的脚本,使用户能够理解地球观测数据。 它旨在为新的“ 正常 ”情况下的巨大挑战找到解决方案
What was the objective of our submission:
我们提交的目标是什么 :
Covid-19 has led to many world governments enforcing emergency quarantine measures. What is the impact of such policies on the environment? Can we measure the change in pollution levels? Is there a co-relation to economic activity? And can we build leading indicators which enable us to measure economic activity at a global scale. Through our project, we tried to analyze satellite imagery to identify the answers.
Covid-19导致许多世界政府强制执行紧急隔离措施。 此类政策对环境有何影响? 我们可以衡量污染水平的变化吗? 与经济活动是否有关联? 我们是否可以建立领先的指标,使我们能够在全球范围内衡量经济活动。 通过我们的项目,我们尝试分析卫星图像以找出答案。
Tools used:
使用的工具:
The tools make the man, or so they say!
这些工具造就了男人,或者他们说!
I always tell my team to first start, by researching the available tools. Because the right tools can make or break a project!
我总是告诉我的团队首先研究可用的工具。 因为正确的工具可以建立或破坏项目!
The tools that were available for this project were:
该项目可用的工具有:
Sentinel-Hub EO Browser
Sentinel-Hub EO浏览器
Sentinel-Hub API access
Sentinel-Hub API访问
Picterra’s AI platform
Picterra的AI平台
euroData Cube
euroData多维数据集
We first used Sentinel-5P data to plot NO2 levels. This was done to identify any anomalies (sudden changes) in the data. This was then collaborated with VHR imagery (Very high resolution imagery)
我们首先使用Sentinel-5P数据绘制NO2水平。 这样做是为了识别数据中的任何异常(突然变化)。 然后与VHR影像(非常高分辨率的影像)合作
Statistical analysis of this data was used to show a significant difference in countries like Germany (where the lockdown was strictly implemented) vs countries like Italy.
通过对该数据进行统计分析,可以发现德国(严格执行锁定)等国家与意大利等国家之间存在显着差异。
I have uploaded the notebook used for plotting the above plot on euroData Cube’s Contribution page. you can check it via the link given below:
我已经将用于绘制上述图表的笔记本上载到euroData Cube的“贡献”页面。 您可以通过以下链接进行检查:
https://eurodatacube.com/marketplace/notebooks/contributions/NO2_Analysis_Covid19_Lockdowns.ipynb
https://eurodatacube.com/marketplace/notebooks/contributions/NO2_Analysis_Covid19_Lockdowns.ipynb

NO2 is produced by vehicular traffic and as un-burnt residue from chemical processes. This can be collaborated by counting cars from high resolution satellite imagery.
机动车交通产生的二氧化氮是化学过程中未燃烧的残留物。 可以通过计算高分辨率卫星图像中的汽车来进行协作。
We will now use Picterra’s machine learning platform to identify vehicles in VHR imagery.
现在,我们将使用Picterra的机器学习平台来识别VHR图像中的车辆。
We need to first login to Picterra’s geo-spatial imagery platform. They have a free trial version, which you can use (without providing any credit cards!)
我们需要先登录Picterra的地理空间图像平台。 他们有一个免费的试用版,您可以使用它( 无需提供任何信用卡! )
Once on the home page, you can Create a new project
进入主页后,您可以创建一个新项目
Now you can upload images from your local drive (other options are Online map imagery OR the option to Buy satellite images). Once uploaded, you can then use it to train a detector.
现在,您可以从本地驱动器上载图像 (其他选项是“ 在线地图图像”或“ 购买卫星图像 ”选项)。 上传后,您可以使用它来训练探测器。
Once the images are uploaded, we then go to the training section. Here we can use the platform to train a detector. However there are pre-built detectors which you can use. But for this demo, we will train a new one
图片上传后,我们将转到培训部分。 在这里,我们可以使用平台训练探测器。 但是,您可以使用预制的探测器。 但是对于这个演示,我们将训练一个新的
Click on the Train a new detector
单击训练新的检测器
There are some custom base models. We chose the Vehicles option
有一些自定义基本模型。 我们选择了车辆选项
We want to detect cars
我们要检测汽车
There are two available detection type: i) Count and ii) Segmentation
有两种可用的检测类型:i)计数和ii)分段
We select the default Count option. and then press the Create button
我们选择默认的“ 计数”选项。 然后按创建按钮

Then add the images that you had added to the project. and press the Start Training button
然后添加您已添加到项目中的图像。 然后按开始训练按钮
When you do it for the first time, Picterra gives you a nice video tutorial that walks you through the training process.
第一次进行此操作时,Picterra会为您提供一个不错的视频教程,引导您完成培训过程。
The interface is very intuitive, and once you understand the controls, it becomes easy to navigate.
界面非常直观,一旦您了解了控件,就可以轻松浏览。
First select the Training button to the left. After that you can select the area of interest, as marked by the yellow square. Clicking on the selected AOI, will zoom into the image
首先选择左侧的训练按钮。 之后,您可以选择感兴趣的区域,以黄色正方形标记。 单击所选的AOI,将放大图像
Now click on the Polygon button and select the Circle option
现在单击“ 多边形”按钮,然后选择“ 圆”选项
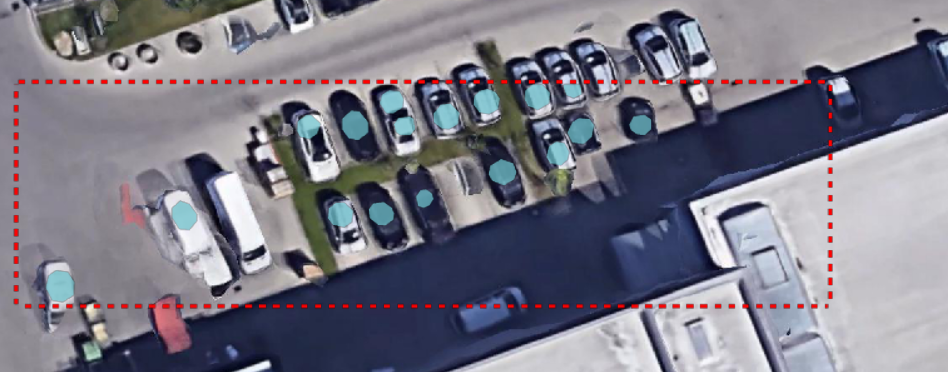
You can now click on each of the parked cars within the area of interest and draw a circle on top. This is now your annotated train dataset. You could have selected the polygon option and drawn a box across the car outline, but I am too lazy for that!
现在,您可以单击感兴趣区域内的每个停放的汽车,并在顶部绘制一个圆圈。 现在这是您带注释的火车数据集。 您可以选择“多边形”选项,并在汽车轮廓上绘制一个框,但是我实在太懒了!

Now select the Testing button on the left menu and click and mark the testing area on the image. You can annotate the testing dataset. But here I will skip that step — Just to check what happens!
现在,选择左侧菜单上的“ 测试”按钮,然后单击并在图像上标记测试区域。 您可以注释测试数据集。 但是在这里,我将跳过该步骤- 仅检查发生了什么!
Now click on the Train Detector button at the top of the dashboard.
现在,单击仪表板顶部的“ 火车检测器”按钮。
Now you can go and have a coffee ( I prefer my masala chai!)
现在您可以去喝咖啡了( 我更喜欢我的咖喱柴! )
OR/AND
或/与
can check the educational resources provided. Do check the Picterra University. It has some good resources on end-to-end machine learning for geo-spatial images.
可以查看提供的教育资源。 请检查Picterra大学。 它在地理空间图像的端到端机器学习方面有一些不错的资源。
Since the training is now finished, let's go and check the performance of the detector.
由于培训现已结束,因此我们开始检查检测器的性能。
The performance is good…but not great! At the bottom right, it has mis-identified the roof of the warehouse as a car.
表现不错…但不是很好! 在右下角,它错误地将仓库的屋顶标识为汽车。
For a detector its important to know what it should not consider as an object. In machine learning terms - false positives should be low.
对于检测器来说,重要的是要知道它不应该考虑什么。 用机器学习的术语来说,误报率应该很低。
So we will annotate some more vehicles for our training set. We select a larger area near our previous training set.
因此,我们将为训练集注释更多的车辆。 我们在之前的训练集附近选择了一个较大的区域。
Post training, I get a warning: it seems I have some overlapping annotations in the training set. which is true. This can cause mergers while running the inference jobs and give an incorrect count.
训练后,我得到一个警告:看来我在训练集中有一些重叠的注释。 没错 这可能会在运行推理作业时导致合并,并且计数不正确。
So let’s correct that -
所以让我们更正-
Use the Select button on the left to select any of the annotations & modify the marker (green circle).
使用左侧的“选择”按钮选择任何注释并修改标记( 绿色圆圈 )。
Retraining the detector, we get the following output.
重新训练检测器,我们得到以下输出。
Seems good. We have missed one large white vehicle at the left, but now the misclassification from the roof is missing. And it has got the car to the extreme left corner.
看起来不错。 我们错过了左侧的一辆大型白色车辆,但是现在缺少了从车顶分类错误的信息。 它已将汽车推到了最左端。
The detector can be trained with more data. Let’s now run the detector on the entire image to see the evaluation performance. We will also evaluate it on a new image.
可以用更多数据训练检测器。 现在让我们在整个图像上运行检测器以查看评估性能。 我们还将在新图像上对其进行评估。
Press the Run Detector button in front of the image. A prompt informs you about the number of processing quota required for running the data. Since we are running on a free-quota, we press Start Detection.
按下图像前面的“运行检测器”按钮。 提示会通知您有关运行数据所需的处理配额数量。 由于我们使用的是免费配额,因此请按开始检测。

Viewing the results shows us the output of the detector
查看结果可向我们显示检测器的输出
We can also use this powerful platform, for other object detection activities, like solar-arrays, ships, trash, military vehicles etc.!
我们还可以使用这个功能强大的平台进行其他物体检测活动,例如太阳能电池板,轮船,垃圾箱,军用车辆等!
Please check Picterra’s blog for their recent success stories:
请查看Picterra的博客,了解他们最近的成功案例:
Object detection stories
物体检测故事
Bring AI-powered object detection to ArcGIS
将AI驱动的对象检测带到ArcGIS
Note on image licensees:
关于图片被许可人的注意事项:
Unless mentioned otherwise, the author owns the licenses to the images.
除非另有说明,否则作者拥有这些图像的许可证。
Indian mosiac (NO2 levels) was created by the author using Sentinel-Hub Platform
作者使用Sentinel-Hub平台创建了印度洋霜(NO2含量)
Time series plots for No2 levels in Germany & Italy were created by the author using code specified above
作者使用上面指定的代码创建了德国和意大利2级水平的时间序列图
Screenshots are from Picterra’s geo-spatial platform
屏幕截图来自Picterra的地理空间平台
翻译自: https://towardsdatascience.com/how-i-won-sentinel-hub-covid-19-custom-script-hackathon-be882ed05186
http://www.taodudu.cc/news/show-997352.html
相关文章:
- hopper_如何利用卫星收集的遥感数据轻松对蚱hopper中的站点进行建模
- 华为开源构建工具_为什么我构建了用于大数据测试和质量控制的开源工具
- 数据科学项目_完整的数据科学组合项目
- uni-app清理缓存数据_数据清理-从哪里开始?
- bigquery_如何在BigQuery中进行文本相似性搜索和文档聚类
- vlookup match_INDEX-MATCH — VLOOKUP功能的升级
- flask redis_在Flask应用程序中将Redis队列用于异步任务
- 前馈神经网络中的前馈_前馈神经网络在基于趋势的交易中的有效性(1)
- hadoop将消亡_数据科学家:适应还是消亡!
- 数据科学领域有哪些技术_领域知识在数据科学中到底有多重要?
- 初创公司怎么做销售数据分析_为什么您的初创企业需要数据科学来解决这一危机...
- r软件时间序列分析论文_高度比较的时间序列分析-一篇论文评论
- selenium抓取_使用Selenium的网络抓取电子商务网站
- 裁判打分_内在的裁判偏见
- 从Jupyter Notebook切换到脚本的5个理由
- ip登录打印机怎么打印_不要打印,登录。
- 机器学习模型 非线性模型_调试机器学习模型的终极指南
- 您的第一个简单的机器学习项目
- 鸽子为什么喜欢盘旋_如何为鸽子回避系统设置数据收集
- 追求卓越追求完美规范学习_追求新的黄金比例
- 周末想找个地方敲代码_观看我们的代码游戏,全周末直播
- javascript 开发_25个新JavaScript开发人员的免费资源
- 感谢您的提问_感谢您的反馈,我们正在改进的5种方法
- 堆叠自编码器中的微调解释_25种深刻漫画中的编码解释
- Free Code Camp现在有本地组
- 递归javascript_JavaScript中的递归
- 判断一个指针有没有free_Free Code Camp的每个人现在都有一个档案袋
- 使您的Java代码闻起来很新鲜
- Stack Overflow 2016年对50,000名开发人员进行的调查得出的见解
- 编程程序的名称要记住吗_学习编程时要记住的5件事
如何使用Picterra的地理空间平台分析卫星图像相关推荐
- Turf.js(地理空间GIS分析的js库),处理地图相关算法
场景 Turf.js Advanced geospatial analysis for browsers and Node.js 浏览器和Node.js的高级地理空间分析. 特点 Modular, s ...
- 一直在构建工作空间_国际资讯Python与地理空间分析
点击图片上方蓝色字体"慧天地"即可订阅 英文原文来源:www.gislounge.com 英文原文链接:https://www.gislounge.com/python-and-g ...
- Cesium与Intel Geospatial合作,为企业提供地理空间解决方案
Cesium中文网:http://cesiumcn.org/ | 国内快速访问:http://cesium.coinidea.com/ Cesium很高兴地宣布与Intel Geospatial建立合 ...
- qgis经纬度_数据养成系列--QGIS地理空间
上次做了一个上海餐饮的分析,有时候觉得光做这种平面的数据可视化好像缺失了点激情,在大神的帮助下,知道有一款QGIS的轻量级的地理空间分析软件,但相关的矢量文件需要自己弄,这里打个广告(感谢城市数据团的 ...
- Foursquare收购地理空间分析与可视化平台Unfolded
此次收购距首席执行官Gary Little上任不到六个月 纽约--(美国商业资讯)--Foursquare今天宣布收购下一代地理空间分析平台Unfolded.随着Unfolded的众多功能合并入Fou ...
- cesium坡度坡向分析_综合分析地理空间,科学规划乡村区域
党的十九大报告提出了实施乡村振兴战略,坚持农业农村优先发展,努力做到"产业兴旺.生态宜居.乡风文明.治理有效.生活富裕".这是我国很重要的一个战略选择.报告提出,要建立健全城乡融合 ...
- softlayer iso_在SoftLayer云中启用地图和地理空间分析
存档日期:2019年5月14日 | 上次更新时间:2014年8月26日 | 首次发布:2012年9月5日 基于云的基础架构正在成为用于管理硬件资源,降低成本和优化基础架构的下一代IT平台. 与云基础架 ...
- Turf.js 地理空间分析库简介
Turf.js是一个轻量级的JavaScript库,用于地理空间分析和操作.它提供了许多强大的函数和算法,用于处理地理空间数据,如点.线.多边形和网格等.Turf.js的API简单易用,可以轻松地与其 ...
- GIS空间分析(七)—— 地理空间大数据
地理空间大数据 a.来源 大数据时代极大地拓展了地理空间数据的获取取到及对自然环境和人类社会的观测纬度.地理大数据的来源非常广泛,主要可以分为以下几类: 业务运营数据:业务运营数据是指在 ...
最新文章
- Paper之BigGAN:ICLR 2019最新论文《LARGE SCALE GAN TRAINING FOR HIGH FIDELITY NATURAL IMAGE SYNTHESIS》(未完待续)
- php引用下级目录文件夹,使用PHP遍历文件夹与子目录的函数代码
- mongodb 数字 _id_MongoDB学习笔记MongoDB简介及数据类型
- 如何用html5编写彩色同心圆,HTML5 canvas 同心圆动画
- 虚拟语气和推测(三)
- 【8】万魂杀服务器开发方面之新版GM工具
- nullnullicon 小图标
- java怎么从后天往前台传参_Java后台解析前台的get中文请求
- 获取并反编译微信小程序源码(仅供学习)
- FreeRTOS 教程指南 学习笔记 第一章 简介
- LeetCode详细题解-Java版
- 手机谷歌浏览器设置不阻止弹窗弹出
- 日语 敬体 简体 作文 对话
- 亚马逊森林大火----- 我也来评论一下
- manjaro双屏显示
- 大数据Hadoop集群搭建
- hdu3911 Black And White (线段树/区间合并)
- ybt1000:入门测试题目
- 打造属于自己的量化投资系统2——利用backtrader创建简单移动平均线策略
- matplotlib画多个子图