“这张图告诉你什么?”
For data to be impactful, it must be understood.
为了使数据具有影响力,必须理解它。
I’ve happily spent hundreds and hundreds of hours of my life watching users misunderstand data visualizations. I’m strangely hooked on it.
我快乐地度过了数百个小时的人生,看着用户误解了数据可视化。 我很迷上它。
It’s fascinating how even the simplest charts and graphs can be so frequently misinterpreted. And I’m not talking about Fox News’ crimes against y-axes, which are purposefully designed to mislead. I mean, for example, basic bar charts, composed by smart designers, that still lead some otherwise smart user to an unexpected interpretation of the underlying data.
令人着迷的是, 即使最简单的图表也是如此频繁地被误解 。 我不是在谈论福克斯新闻(Fox News)针对y轴的犯罪,这些犯罪是有意误导的。 我的意思是,例如,由聪明的设计师组成的基本条形图, 仍然会导致一些聪明的用户对基础数据进行意外的解释。
The first challenge: The tiniest design elements can unexpectedly impact users’ mental models and cause irrecoverable confusion. Many talented practitioners offer principles for presenting data visually (see: Cairo, Knaflic, Ware, Tufte). But with so many moving parts to consider, it’s impossible to predict the combined effect without actually testing it.
第一个挑战:最微小的设计元素会意外地影响用户的思维模型,并导致无法挽回的混乱。 许多有才华的从业者提供视觉上呈现数据的原则(见: 开罗 , Knaflic , 洁具 , 塔夫特 )。 但是要考虑的运动部件太多,因此如果不进行实际测试就无法预测组合效果。
The second challenge: Per Ben Cooley: “building data visualization products with the purpose of delivering insight is fundamentally different” from other UX (src). So it follows that it requires a different approach to validate.
第二个挑战: Per Ben Cooley:“与其他UX( src )相比,“构建旨在提供洞察力的数据可视化产品根本不同”。 因此,这就要求使用不同的方法进行验证。
If we want data to be impactful, it has to be understood. If we want it to be understood, it must be tested with real users. If we want to user test data visualization, we need to consider more than just usability.
如果我们希望数据具有影响力,则必须理解它。 如果我们希望它被理解,则必须经过真实用户的测试。 如果我们要用户测试数据可视化,我们不仅需要考虑可用性。
用户测试数据可视化时要寻找什么? (What to look for when user testing data visualizations?)
In testing visualizations, we’re typically checking for:
在测试可视化时,我们通常会检查:
Comprehension: The visualization communicates what we think it does
理解 :可视化传达了我们认为的功能
Explainability: Users can relate the visualization to the underlying phenomena being measured (e.g. what’s happening in the real world?)
可解释性 :用户可以将可视化与正在测量的潜在现象相关联(例如,现实世界中正在发生的事情?)
Affect: Users understand conclusions intellectually and they can feel it in their gut. It instills an appropriate sense of urgency.
影响:用户可以智能地理解结论,并且可以在自己的直觉中感受到它。 它灌输了适当的紧迫感。
Actionability: It nudges users towards a specific course of action.
可操作性 :它将用户推向特定的操作过程。
The questions below are my toolkit for validating these criteria.
以下问题是我用于验证这些条件的工具包。
1.“您在这里看到什么?” (1. “What are you seeing here?”)
“People often ask me: ‘What’s the most important thing I should do if I want to make sure my Web site is easy to use?’ The answer is simple. It’s not “Nothing important should ever be more than two clicks away,” or “Speak the user’s language,” or even “Be consistent.” It’s… ‘Don’t make me think!’” (Steve Krug, “Don’t Make Me Think”)
人们经常问我:'如果要确保我的网站易于使用,我应该做的最重要的事情是什么?' 答案很简单。 不是“没有什么重要的事情可以相隔两下单击”,“说出用户的语言”甚至“保持一致”。 是…… “别让我思考!” ”(史蒂夫·克鲁格,“ 别让我思考 ”)
What was true for Steve Krug in 2000 is still true for design today: To make something accessible, optimize for reducing cognitive load.
史蒂夫·克鲁格(Steve Krug)在2000年的情况仍然适用于当今的设计:要使某些东西易于使用,请进行优化以减少认知负担。
This may seem unintuitive for tools that only exist for navigating complexity. You might even say “but this data is meant to be thought-provoking!” But just because the story is complex, doesn’t mean the presentation should be.
对于仅用于导航复杂性的工具而言,这似乎并不直观。 您甚至可能会说“但这些数据真是发人深省!” 但是,仅仅因为故事很复杂,并不意味着演示应该如此。
To validate this, you want to test what users conclude from a visualization if you weren’t sitting there with them. (Steve calls this “get it” testing.)
为了验证这一点,如果您不与用户坐在一起,您想测试用户从可视化中得出的结论。 (史蒂夫称此为“得到”测试。)
So, just like you would in a typical user test, start with open-ended questions like “What are you seeing here?” or “What is this graph trying to tell you?” It’s a gentle nudge to see how users respond, free of any prompting, priming or bias
因此,就像在典型的用户测试中一样,从诸如“您在这里看到什么?”之类的开放性问题开始。 或“此图试图告诉您什么?” 看到用户如何回应,没有任何提示,启动或偏见,这是一种微妙的推动
This gives you a signal of what captures their attention and the conclusions they might draw on their own.
这给您一个信号,说明吸引他们注意的是什么,以及他们可能自己得出的结论。
What to look for?
要找什么?
Good: They quickly recite the intended conclusions, in priority order. They’re not squinting. “I did a good job today, I walked 10k steps”
良好 :他们Swift按优先顺序背诵预期的结论。 他们没有斜视。 “今天我做得很好,走了1万步”
Trouble: They’re distracted by minutia. They imagine spurious contradictions. “This says I walked 2km. Is that today or this week? I only burned 500 calories, but it’s green so I guess that’s good? Also, how long is a km again?”
麻烦 :他们对细节有分心。 他们想象虚假的矛盾。 “这说我走了2公里。 是今天还是本周? 我只燃烧了500卡路里,但是它是绿色的,所以我猜那很好吗? 还有,一公里又要走多久?”
Tip: 50% of people will recite literally what they’re seeing on the screen (e.g. “I see a blue chart that says “# of steps today. Then a green graph that says “# calories. I like the colors!”). Just re-ask a different way to nudge toward interpretations (e.g. “What is this screen trying to tell you?”).
提示 :50%的人会按字面背诵他们在屏幕上看到的内容(例如“我看到一个蓝色图表,上面写着“今天的步数。然后是绿色图表,上面写着”#卡路里。我喜欢这些颜色!” ) 。 只是重新提出一种微妙的解释方式(例如“此屏幕试图告诉您什么?” )。
2.“最好的[x]是什么? 最糟糕的[x]是什么?” (2. “What was the best [x]? What was the worst [x]?”)
To be truthful and revealing, data graphics must bear on the question at the heart of quantitative thinking: “Compared to what?” (Edward Tufte, “The Visual Display of Quantitative Information”)
为了真实和揭示性,数据图形必须在定量思考的核心问题上:“ 与什么相比? ”(Edward Tufte,“ 定量信息的可视化显示 ”)
The whole point of visualization is comparing quantities visually. Our brains understand geometry better than abstract numbers, so we visualize.
可视化的重点是可视化比较数量。 我们的大脑比抽象数字更了解几何,因此我们进行了可视化。
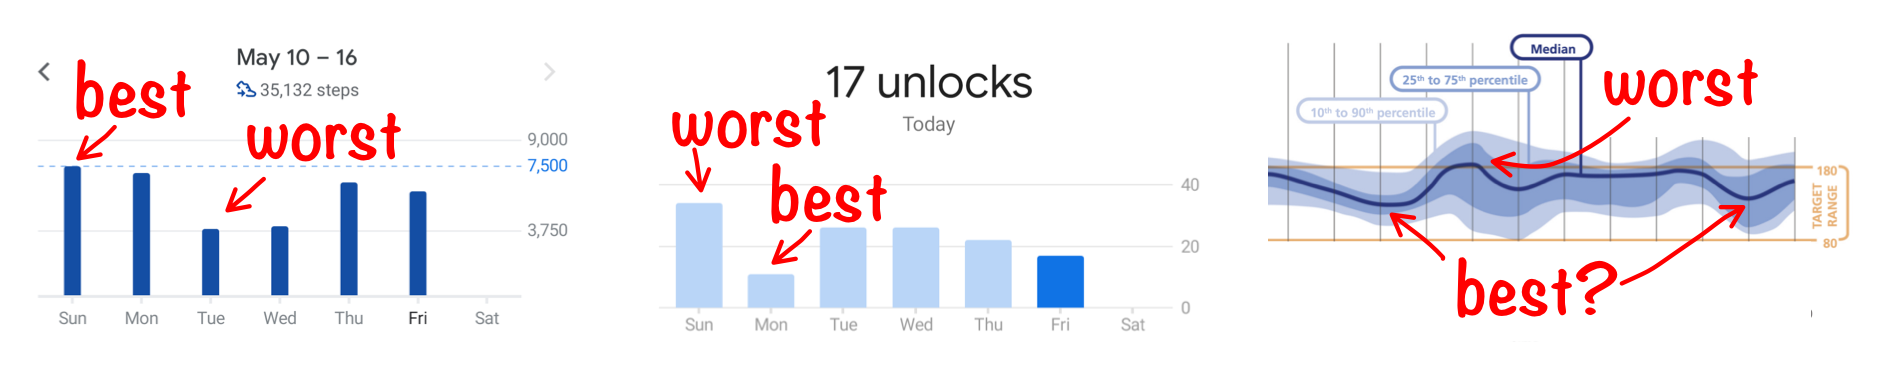
Testing is simple: Ask users questions about the data. One of the more reliable: ask them to identify the extremes. (e.g. “What day was your healthiest day? What day was your least healthy?” or “When did you make the most sales? When was the slowest?”)
测试很简单:向用户询问有关数据的问题。 较可靠的方法之一:请他们确定极端情况。 ( 例如,“哪一天是您最健康的一天?哪一天是您最不健康的一天?”或“您什么时候销售额最高?什么时候最慢?”)
You might also consider phrasing this in terms of value judgements (e.g. “best, worst”, not “largest, smallest”), to make sure they’re able to differentiate quantities and draw appropriate conclusions. This is particularly important when “good” isn’t necessarily the highest or lowest values presented (e.g. blood-glucose levels).
您也可以考虑根据价值判断(例如“ 最佳,最差 ”,而不是“最大,最小”)来表述,以确保他们能够区分数量并得出适当的结论。 当“好”不一定是所呈现的最高或最低值(例如血糖水平)时,这一点尤其重要。
You can also follow this up with similar quiz-like questions, such that, if they understand the data, they should be able to easily answer the question (e.g. “During which period(s) was there a decline in the number of births?”).
您还可以通过类似类似测验的问题来跟踪问题,例如,如果他们了解数据,他们应该能够轻松回答该问题(例如, “在哪个时期出生人数下降了? ” )。
Hearst et. al. explore this further and find that having people answer questions about complex visualizations helps make designers “aware of the problems that might arise in actual use of their design.” (Hearst, Laskowsk, Silva, “Evaluating Information Visualization via the Interplay of Heuristic Evaluation and Question-Based Scoring”)
赫斯特等 等 进一步探索这一发现,发现人们回答有关复杂可视化的问题有助于使设计师“意识到在实际使用他们的设计时可能出现的问题。” (Hearst,Laskowsk,Silva,“ 通过启发式评估和基于问题的评分的相互作用来评估信息可视化 ”)
Answers to these questions might be obvious when testing simple representations, like a single bar chart. But the more you stray from simple representations, the more they’ll struggle. For example, see NYTimes’ exploration of Elizabeth Warren’s 2019 policy proposal costs (Thomas Kaplan, Aliza Aufrichtig, Derek Watkins, “How Would Elizabeth Warren Pay for Her Sweeping Policy Plans?”). You could expect people to struggle with determining if “Housing” or “Other” are the smallest portions. That’s not always a bad thing, it just depends on the level of precision required to tell the story.
在测试简单表示形式(如单个条形图)时,这些问题的答案可能很明显。 但是,您对简单表示形式的迷恋越多,他们就会越努力。 例如,请参阅《纽约时报》对伊丽莎白·沃伦(Elizabeth Warren)2019年政策建议成本的探索(Thomas Kaplan,Aliza Aufrichtig,德里克·沃特金斯(Derek Watkins),“ 伊丽莎白·沃伦(Elizabeth Warren)将如何支付其全面的政策计划? ”。 您可能希望人们在确定“房屋”或“其他”是否是最小的方面上费劲。 这并不总是一件坏事,它仅取决于讲故事所需的精确度。
What to look for?
要找什么?
Good: They should be able to answer these quickly. They can spot ambiguity, if it exists. There’s little trouble relating quantities to labels.
很好 :他们应该能够Swift回答这些问题。 他们可以发现歧义(如果存在)。 将数量与标签相关联几乎没有问题。
Trouble: More squinting. Mistaking highs for lows. Tracing with fingers.
麻烦 :斜眼看。 高低错位。 用手指追踪。
3. “是什么导致数据具有这种形状? 现实生活中发生了什么,影响了您在这里看到的数字?” (3. “What caused the data to have this shape? What happened in real life that affected the numbers you’re seeing here?”)
“Abstraction makes it harder to understand an idea and to remember it. It also makes it harder to coordinate our activities with others, who may interpret the abstraction in very different ways.” (Chip & Dan Heath, “Made to Stick”)
“抽象使理解和记住它变得更加困难。 这也使得与他人的活动协调变得更加困难,而他人可能以非常不同的方式来解释抽象。” (Chip和Dan Heath,“ 坚持做下去 ”)
Data visualization is, by nature, abstract. So becoming too abstract is a persistent risk. This makes it difficult for people to relate the visualization with what they might experience in real life, ultimately limiting the impact of the data.
数据可视化本质上是抽象的。 因此,变得过于抽象是一种持续的风险。 这使人们很难将可视化与他们在现实生活中可能遇到的事情联系起来,最终限制了数据的影响。
For example, the Covid Tracking Project recommends against abstracting away death counts that mute the emotional impact of Covid-19 deaths.
例如,Covid Tracking Project建议不要提取使Covid-19死亡的情感影响静音的死亡计数。
“We recommend using total numbers for plotting deaths to compare one US state or territory against another. In this case, adjusting per capita adds a layer of abstraction to the graphic. This reduces the data’s power and the reader’s comprehension.” (The Covid Tracking Project, “Visualization Guide”)
“我们建议使用总数来绘制死亡人数,以将一个美国州或地区与另一个州或地区进行比较。 在这种情况下,调整人均会在图形上添加抽象层。 这降低了数据的功能和读者的理解力。” (Covid跟踪项目,“ 可视化指南 ”)
But it’s not just abstraction that can mask the underlying phenomenon.
但是,不仅仅是抽象可以掩盖潜在的现象。
Sometimes telling the complete story requires additional context. For example, charts from St Louis Fed’s FRED show overlays for recessions, giving additional context to properly interpret the data.
有时,要讲述完整的故事,还需要其他上下文。 例如, 圣路易斯联储FRED的图表显示了经济衰退的叠加,为正确解释数据提供了额外的环境。
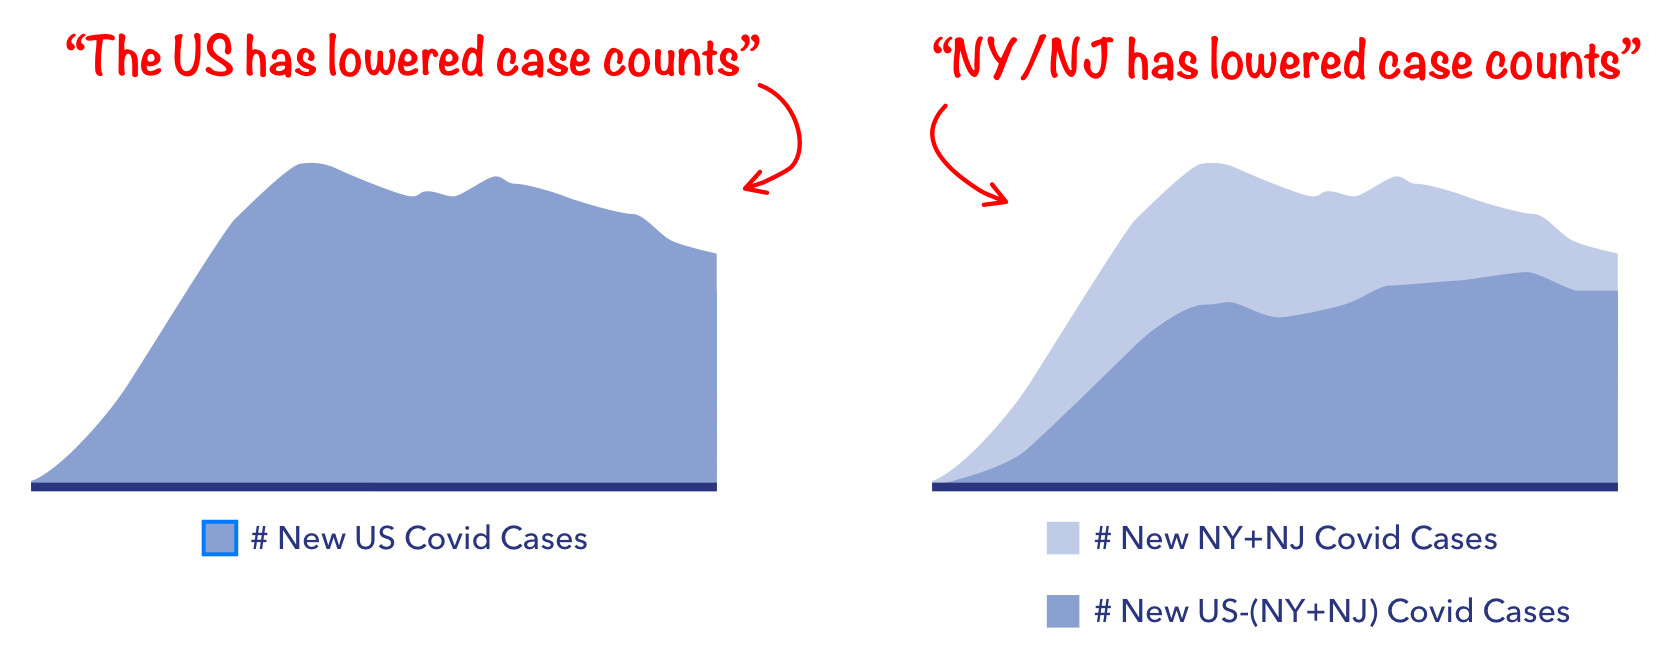
Or, sometimes the complete story can be hidden under a homogenous curve. For example, if you were to look at the curve of US Covid-19 cases, you might think the case-count is declining across the country. In reality, most of that drop is due to just 2 states (New York and New Jersey), while case-counts across the rest of the country remain relatively flat.
或者,有时整个故事可以隐藏在同一个曲线下。 例如,如果您查看美国Covid-19案件的曲线,您可能会认为全国的案件数量正在下降。 实际上,下降的主要原因是只有两个州(纽约州和新泽西州),而全国其他地区的病案数却相对平稳。
By asking people to give an explanation for the underlying phenomenon, you can determine how easily they relate the data to their own lives. This can indicate the need to simplify, decompose or supplement the visualization with added context.
通过要求人们对潜在现象进行解释,您可以确定他们将数据与自己的生活联系起来的难易程度。 这可能表明需要通过添加上下文来简化,分解或补充可视化内容。
What to look for?
要找什么?
Good: They relate the data back to personal experiences (if personal data), they can offer plausible explanations (e.g. “This week was probably bad for Snow Cone sales because it’s December and it’s 27 degrees outside?”), or at least they can interrogate the data to learn more (e.g. tapping a bar on a bar chart to decompose it).
很好 :他们将数据与个人经历(如果是个人数据)联系起来,可以提供合理的解释(例如“本周可能对Snow Cone的销售不利,因为它是12月,外面是27度?” ),或者至少可以询问数据以了解更多信息(例如,点击条形图上的条形图进行分解)。
Trouble: Non-answers. They say “well it depends…” (indicating ambiguity). They hunt around for context clues but come up short.
故障 :无答案。 他们说“这取决于……”(表示模棱两可)。 他们四处寻找上下文线索,但很短。
4.“总体而言,这是好事还是坏事?” (4. “Overall, is this good or bad?”)
“Because visceral design is about initial reactions, it can be studied quite simply by putting people in front of a design and waiting for reactions. (Donald Norman, “Emotional Design: Why We Love (or Hate) Everyday Things”)
“由于内脏设计是关于初始React的,因此可以很容易地通过将人们置于设计之前并等待React来研究它。 (唐纳德·诺曼,“ 情感设计:为什么我们爱(或恨)日常事物 ”)
To persuade, it’s important to appeal to audiences both rationally and emotionally. Data, when well-presented, can accomplish both. To do this, the visualization should create a sense of tension by highlighting the difference between “this is how things are now” and “this is how much better they could be.”
要说服,重要的是要在理性和情感上吸引观众。 数据呈现得当,可以同时实现两者。 为此,可视化应该通过强调“这就是现在的状况”与“这就是 现在的状况 可以更好”之间的差异来营造一种紧张感。
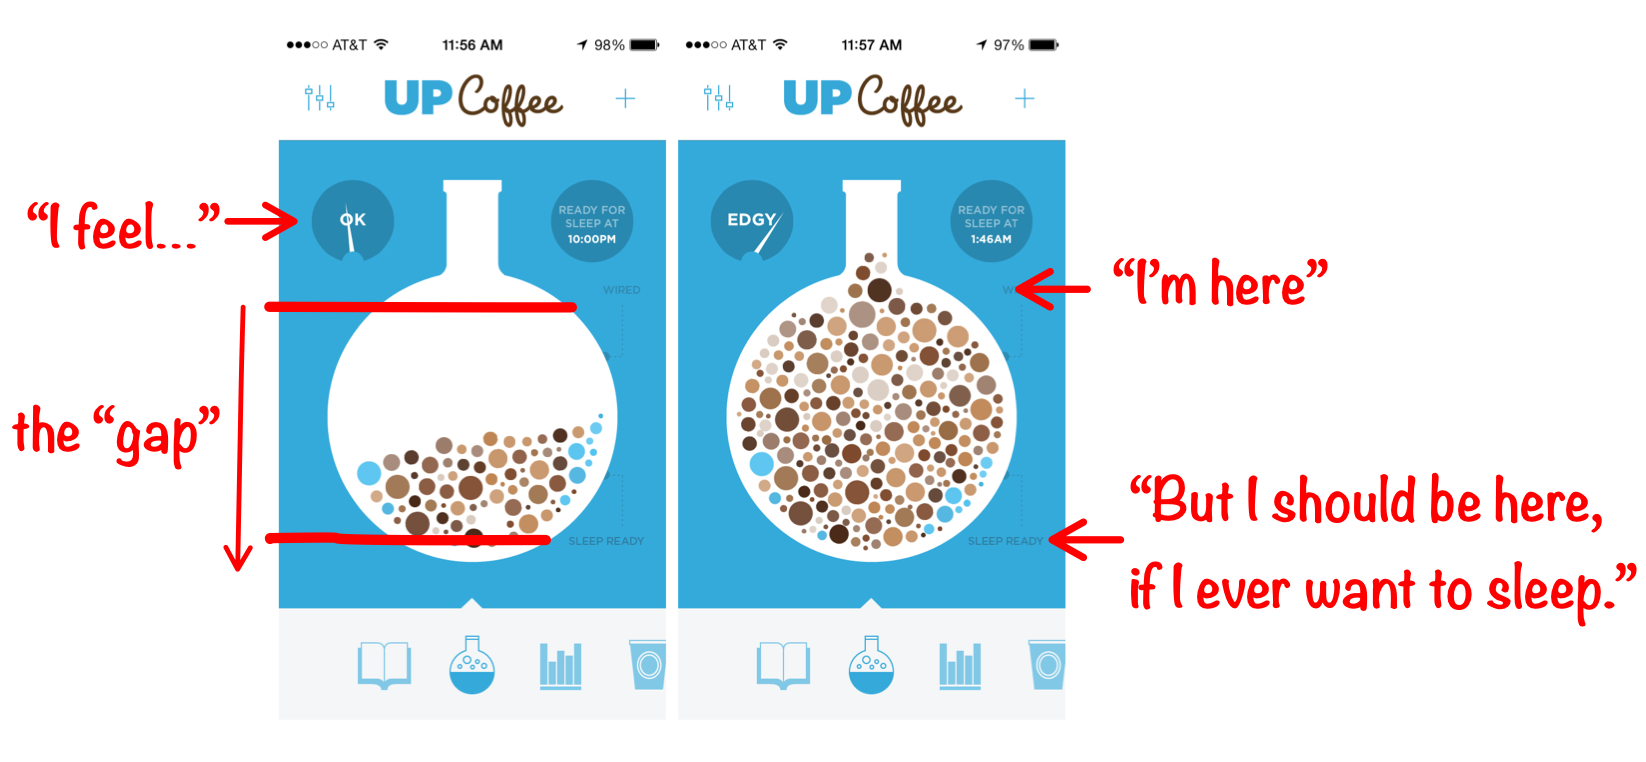
This works for both for personal, performance visualizations (e.g. Fitbit creates tension between your current step count and the magical 10,000 steps) and for more objective, journalistic work (e.g. looking at this graph, Americans might feel tension: “Denmark, Italy and Canada are beating the US in testing?”).
这既适用于个人绩效可视化(例如Fitbit在您当前的步数和10,000神奇的步数之间产生张力),也适用于更客观的新闻工作(例如, 查看此图,美国人可能会感到紧张:“丹麦,意大利和加拿大在测试中击败美国?” )。
When this is well-executed, you can expect an almost visceral reaction from your users. Not only do they intellectually understand the “gap,” they feel it.
如果执行得当,您可以期待用户的几乎内在的React。 他们不仅在理智上理解“差距”,而且感觉到了。
To verify this, simply ask your test subjects to judge for themselves. (e.g. “Do you think this is good or bad?”)
要验证这一点,只需让您的测试对象自己判断即可。 (例如, “ 您 认为这是好是坏?” )
What to look for?
要找什么?
Good: At the very least, they should be able to identify the “gap” and say whether the data presents a scenario that is good or bad. Ideally, they can speak to the magnitude of the difference. Even better, their own emotional arousal matches that magnitude.
良好 :至少,他们应该能够识别“差距”,并说出数据呈现的是好是坏。 理想情况下,他们可以说出差异的大小。 甚至更好的是,他们自己的情感唤醒达到了这种程度。
Trouble: Hesitation. Guessing. Mistakes. Apathy.
故障 :犹豫。 猜猜 错误。 冷漠
5.“下一个[周/月/年],您可能有何不同的方法来更改这些数字? 这些信息将如何影响您的方法? ” (5. “What might you do differently to change these numbers next [week/month/year]? How would this information influence your approach?”)
“There are really only three basic reasons why information ever has value to a business: 1. Information reduces uncertainty about decisions that have economic consequences. 2. Information affects the behavior of others, which has economic consequences. 3. Information sometimes has its own market value.” (Douglas Hubbard, “How to Measure Anything”)
“实际上,信息对企业有价值的原因只有三个基本原因:1.信息减少了具有经济后果的决策的不确定性。 2.信息影响他人的行为,具有经济后果。 3.信息有时具有自己的市场价值。” (Douglas Hubbard,“ 如何测量任何东西 ”)
Data is “actionable” if a reasonably informed user would do something different as a result of consuming it. This is what Hubbard’s 1st and 2nd reasons refer to.
如果合理告知的用户由于使用数据而做其他事情,则数据是“可操作的”。 这就是哈伯德的第一个和第二个原因。
Testing for “actionability” is important for 2 reasons:
测试“可操作性”很重要,原因有两个:
- You want to make sure the visualization helps users understand the data well-enough to inform their future actions. This is a prerequisite for users to act. (i.e. The steering wheel is useless if you can’t see through the windshield.)您要确保可视化可以帮助用户充分理解数据,以告知其将来的操作。 这是用户采取行动的前提。 (即,如果看不到挡风玻璃,方向盘就没用了。)
- You also want to make sure you’re not overloading people with useless data (i.e. data vomit). If data doesn’t inform some decision or behavior, you probably don’t need to visualize it.您还想确保您不会使无用数据的人(例如数据呕吐)超载。 如果数据无法告知某些决策或行为,则可能无需可视化。
Validating actionability is slightly more tricky.
验证可操作性比较棘手。
First, identify several scenarios where, given scenarios A, B, and C, a reasonably informed person would tell you to do X, Y, Z. (e.g. “Thermometer says 0 degrees” → “Wear a coat”; “Thermometer says 100 degrees” → “Stay inside”).
首先,确定几种情况,在给定情况A,B和C的情况下,有足够知识的人会告诉你做X,Y,Z。(例如“温度计表示0度”→“穿外套”;“温度计表示100度”→“待在里面”)。
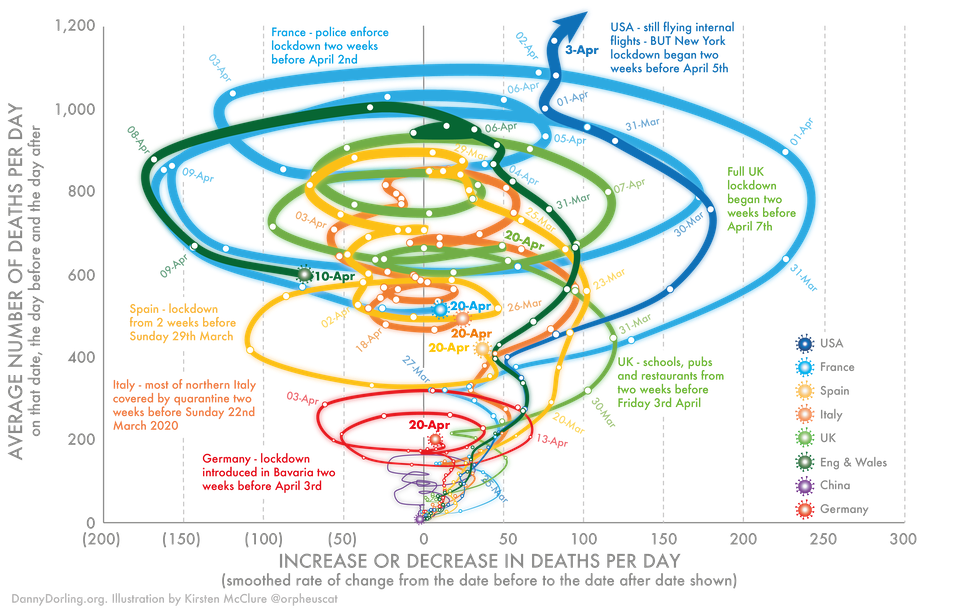
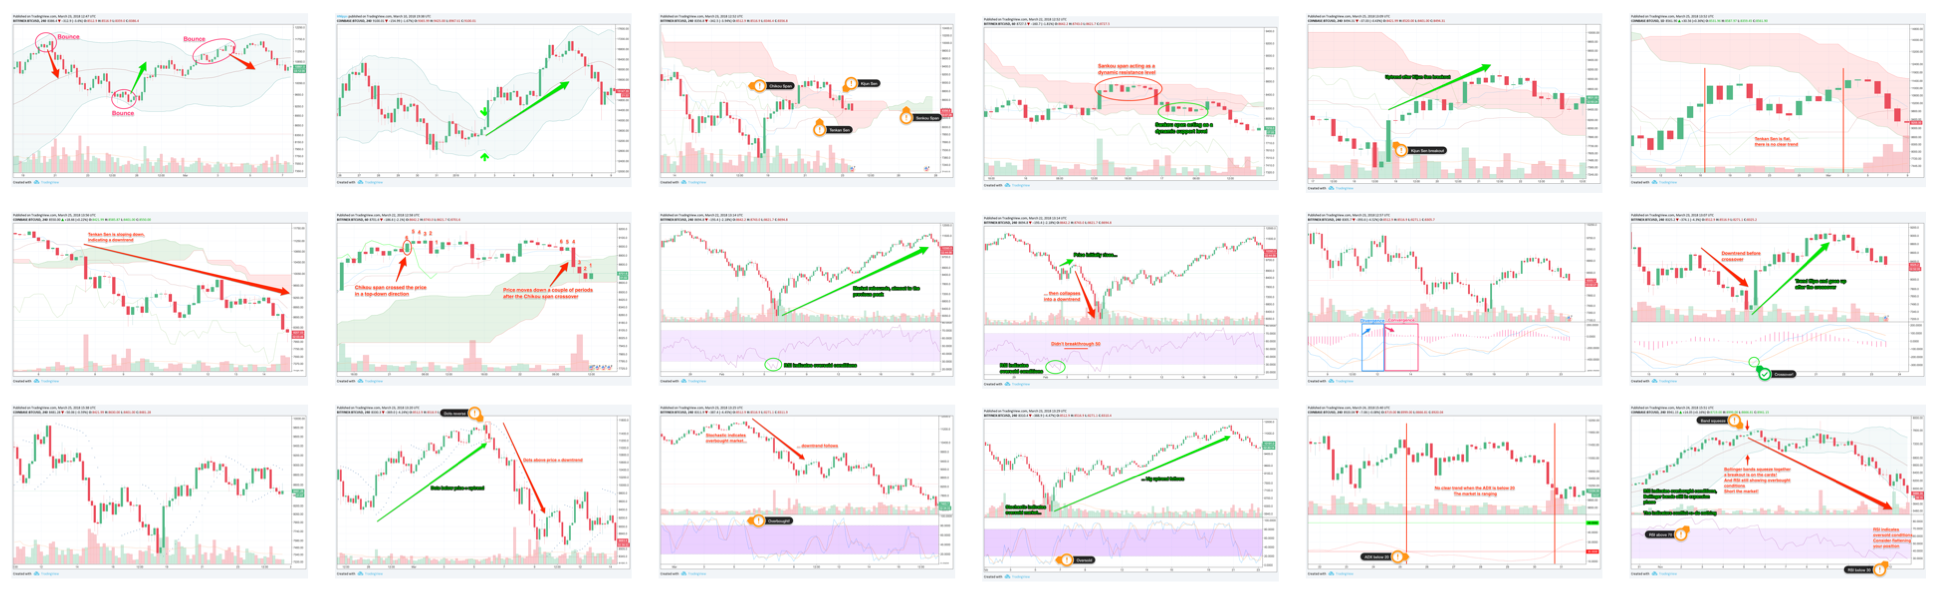
Second, make sure you’re testing with “reasonably informed” testers. This is important: Even an objectively effective visualization won’t seem actionable to users who are inexperienced in the problem domain (e.g. the trading graphs above look like nonsense to me, but that doesn’t mean they’re ineffective for technical traders). Unless these non-experts are your audience, they’re only going to give you false negatives. So make sure you’re testing with folks who would know what to do with the information (i.e. users who, when presented with scenarios A, B and C, know to proceed with actions X, Y and Z)
其次,确保您正在与“合理告知”测试人员进行测试。 这一点很重要:即使是客观有效的可视化对于那些在问题领域没有经验的用户来说似乎也不可行(例如,上面的交易图对我来说似乎是胡说八道,但这并不意味着它们对技术交易者无效)。 除非这些非专家是您的听众,否则它们只会给您带来虚假的负面评价。 因此,请确保您正在与知道如何处理信息的人员进行测试(即,当用户在遇到场景A,B和C时,他们知道要进行操作X,Y和Z的用户)
Once you have your scenarios and reasonably informed test users, walk the testers through each scenario, as represented by the visualization, and ask them what they would do. Their answers might differ (e.g. “100 degrees” might mean “stay inside,” “wear sunscreen,” “stay hydrated”), but each of the responses should indicate whether or not the person knows it’s hot enough that they should do something different.
一旦有了场景并合理地通知了测试用户,就可以按照可视化表示的方式逐步引导测试人员完成每个场景,并询问他们将要做什么。 他们的回答可能有所不同(例如,“ 100度”可能表示“待在里面”,“戴防晒霜”,“保持水分”),但是每个回答都应表明该人是否知道自己的温度足够高以至于他们应该做些不同的事情。
What to look for?
要找什么?
Good: Your experts can translate the scenario you’re presenting to a specific course of action.
很好 :您的专家可以将您要呈现的场景转换为特定的操作过程。
Trouble: “I don’t know.” This can indicate a) the person isn’t an expert or b) the data presented isn’t sufficient to determine an action or c) the data wouldn’t actually have any bearing on downstream actions. (C. is the one to watch out for. That’s the sad path to data-vomit.)
麻烦 : “我不知道。” 这可能表明a)该人不是专家,或者b)所提供的数据不足以确定一项行动,或者c)数据实际上对下游行动没有任何影响。 (C.是要提防的那个。这是通往数据呕吐的悲伤之路。)
Tip: Initial responses will sometimes be vague (e.g. “if the cookies aren’t selling, those lazy girl scouts need to try harder.”), so be ready to follow it up (e.g. “Sure. But based on what you’re seeing here, is there something else they might try?”) Then they might say “Oh, I see all they have left are Trefoils. No one eats that garbage. Get those girls some Thin Mints!”
提示 :最初的回应有时会含糊不清(例如“如果饼干不卖,那些懒惰的女童子军就需要加倍努力。”), 准备跟进它(例如“当然。但是,根据您在这里看到的内容,他们还可以尝试其他方法吗?” )然后他们可能会说: “哦,我看到所剩下的都是Trefoils。 没有人吃那垃圾。 给那些女孩买些薄薄的薄荷糖!”
Design is iterative. Data design is no exception. Ask just a handful of test users these 5 questions and, not only will you learn how to improve your visualizations, you’ll also spark great conversations that help you better relate to your users and ultimately make the work more understandable, relatable, impactful and actionable.
设计是迭代的。 数据设计也不例外。 仅向少数测试用户询问这5个问题,不仅会学习如何改善可视化效果,还会引发精彩的对话,帮助您更好地与用户建立联系,并最终使工作更加易懂,相关,影响力大,可行的。
Who am I? No, no, who are you?!
我是谁? 不,不,你是谁?
I’m Eli. I help clients use data (visualization) to create positive change by engaging audiences not just rationally, but also emotionally and culturally. Change happens in the head and the heart.
我是伊莱 我帮助客户使用数据(可视化),不仅通过理性地,而且在情感上和文化上吸引受众,来创造积极的变化。 变化发生在头部和心脏。
If you’re interested in user-testing data viz, or if you’re a founder, maker, storyteller or business leader working at the intersection of data, design and user psychology, I’d love to connect and trade stories.
如果您对用户测试数据感兴趣,或者您是在数据,设计和用户心理交汇处工作的创始人,制造商,讲故事者或业务负责人,那么我很想联系并交易故事。
You can email me at eli@3iap.co or follow me on Twitter.
您可以通过eli@3iap.co给我发送电子邮件,或者在Twitter上关注我。
翻译自: https://uxdesign.cc/crucial-questions-for-user-testing-data-visualizations-297413f7d6ab
http://www.taodudu.cc/news/show-894103.html
相关文章:
- 智能家居数据库设计_设计更智能的数据表
- houseparty不流畅_重新设计Houseparty –用户体验案例研究
- 概念验证_设置成功的UX概念验证
- figma设计_5位来自杂乱无章的设计师的Figma技巧
- 用户体验与可用性测试_可用性作为用户体验的原则
- ios 动画设计_动画和讲故事在设计中的力量
- xd可以用ui动效效果吗_通过动画使UI设计栩栩如生:Adobe XD和After Effects
- 现代游戏中的UX趋势
- code craft_以Craft.io为先—关于我们行业的实践职业道路的系列
- 1.今日标签:视频价值一千字
- 书呆子rico_寻找设计和类型书呆子的清道夫
- netflix 工作原理_Netflix如何在屏幕后面工作?
- uitest_您在Swift中的第一个UITest
- 人脸识别及对比_没有“色彩对比可及性的神话”
- 流体式布局与响应式布局_将固定像素设计转换为流体比例布局
- 重新设计Videoland的登录页面— UX案例研究
- 网站快速成型_我的老板对快速成型有什么期望?
- figma设计_在Figma中使用隔片移交设计
- 管理沟通中移情的应用_移情在设计中的重要性
- angelica类似_亲爱的当归(Angelica)是第一个让我哭泣的VR体验
- facebook 面试_如何为您的Facebook产品设计面试做准备
- 荒径 弗罗斯特_弗罗斯特庞克,颠覆性城市建设者
- 启发式搜索给神经网络_神经科学如何支持UX启发式
- 海浪 shader_海浪下的发现
- 对数据可视化的理解_使数据可视化更容易理解
- 案例研究:设计与方法_如何进行1小时的重新设计(案例研究)
- unity 全息交互ui_UI向3D投影全息界面的连续发展
- 平面设计师和ui设计师_平面设计师为什么要享受所有乐趣?
- web表单设计:点石成金_设计复杂的用户表单:12个UX最佳实践
- c#创建web应用程序_创建Web应用程序图标集的6个步骤
“这张图告诉你什么?”相关推荐
- 学Java还是Python?一张图告诉你!
Java 和 Python 一直都是两种很火很强大的编程语言,对于刚开始起步学习编程的同学来说,会迷惑且最经常问的问题是,我该学 Java 还是 Python,是不是 Python 容易学,或是应该先 ...
- 一张图解释什么是遗传算法_一张图告诉你什么叫真正的满配m416,吃鸡玩家看懵了...
开开心心玩游戏,轻轻松松看快讯,欢迎来到<龙百万聊吃鸡>栏目,本期有哪些趣闻趣事呢?咱们一起看一下. 国际服和日韩服的训练场更新了,国服会跟进吗 最近刺激战场国际服和日韩服的训练场更新了, ...
- 学python还是java贴吧_是学python还是java?一张图告诉你!
物联网硬件开发 - 零基础学习电子产品设计 - 创客学院直播室www.makeru.com.cn Java 和 Python 一直都是两种很火很强大的编程语言,对于刚开始起步学习编程的同学来说,会迷 ...
- 是学习Java还是Python?一张图告诉你!
Java 和 Python 一直都是两种很火很强大的编程语言,对于刚开始起步学习编程的同学来说,会迷惑且最经常问的问题是,我该学 Java 还是 Python,是不是 Python 容易学,或是应该先 ...
- 一张图告诉你什么是系统架构师
转载自 一张图告诉你什么是系统架构师 这张图从架构师的综合能力.岗位认识.岗位职责等方面,清楚的画出了作为一个架构的基本准则.人人都想成为架构师,可作为架构你达到了上面的要求了吗? 系统架构师是个神奇 ...
- 一张图告诉你为什么是服务网关
转载自 一张图告诉你为什么是服务网关,文末有现金抽奖. 网关服务是单一访问点,并充当多项服务的代理.服务网关启用了跨所有服务的路由转发.过滤和公共处理等. 在微服务实践中远不止这点功能,它可以做到统一 ...
- violinplot如何看懂_一张图告诉你如何看懂个股大趋势
昨日在T+0交易利好消息的影响下,券商股全线大幅高开,带动三大指数高开走高,科技题材股全线活跃,两市量能明显放大,形成量价齐升的良性态势,上证冲上2917,收在2915,创业板大涨3%以上,同样量价齐 ...
- java怎么判断mysql中是否存在我们查找的索引_10张图告诉你,MySQL 是如何查找数据的?...
在我们日常生活中经常会涉及到查找某个东西的场景,就比如说在一个学校里吧,我们想找出个子"最高的10个"同学,或者想查找姓名是"张三"的同学,又或者是查找学号是& ...
- Android 应用性能优化(5)---用两张图告诉你,为什么你的App会卡顿?
用两张图告诉你,为什么你的App会卡顿? Cover 有什么料? 从这篇文章中你能获得这些料: 知道setContentView()之后发生了什么? 知道Android究竟是如何在屏幕上显示我们期望的 ...
- mysql 如何把整列数据*10_10张图告诉你,MySQL 是如何查找数据的?
在我们日常生活中经常会涉及到查找某个东西的场景,就比如说在一个学校里吧,我们想找出个子"最高的10个"同学,或者想查找姓名是"张三"的同学,又或者是查找学号是& ...
最新文章
- 扎克伯格亲自做了26张PPT,员工效率提10倍,已被疯狂传阅
- java语言 U_Java语言的基础
- 小明学习Linux运维课后习题实战A
- 不同时重写equals和hashCode又会怎样?
- 使用git在两台机器间同步代码
- IISASP.NET 站点IP跳转到域名
- WCF服务寄宿IIS与Windows服务 - C#/.NET
- php定位符,行定位符、单词定界符实例用法(正则表达式字符集1)
- SQLServer之修改标量值函数
- wordpress如何整合html语言,怎么用wordpress建中英文双语及多语言切换的网站
- java实验报告_java实验报告完整版.pdf
- LaTeX论文模板(附源码)
- Unity2d 坦克大战 (二)道具效果实现
- Windows下载安装 PostgreSQL和PostGIS工具,并解决The pgAdmin 4 server could not be contacted:
- 腾讯视频弹幕屏蔽js
- win10安装linux虚拟机并配置shell工具连接
- linux压缩文件命令_24.gzip、unzip命令详解 - 钟桂耀
- (建议)房价与个人所得税起征点计算公式
- win10如何手动强制关联某个类型文件的默认程序打开方式
- 指定路径列表批量拷贝文件+Windows批处理命令大全
热门文章
- withMisfireHandlingInstruction
- 用ASP.NET Core MVC 和 EF Core 构建Web应用 (一)
- BZOJ 4808: 马(二分图最大点独立集)
- [51nod1264]线段相交
- 夺命雷公狗---DEDECMS----26dedecms面包屑导航的实现
- This version of MySQL doesn't yet support 'LIMIT IN/ALL/ANY/SOME subquery 解决方法
- 图解SQL的inner join(join)、left join、right join、full outer join、union、union all的区别...
- 微软开始提供公共预览版Windows 8.1下载
- EXT.NET复杂布局(四)——系统首页设计(上)
- JavaScript操作表格进行拖拽排序