sql 数据库检查_数据库检查点– SQL Server 2016中的增强功能
sql 数据库检查
When a new row is inserted or an existing one is updated in your database, the SQL Server Database Engine will keep that change in the buffer pool in the memory first, without applying each change directly to the database files for IO performance reasons. These data pages located in the buffer pool and not reflected yet to the database files are called Dirty Pages. The SQL Server Database Engine uses a special kind of processes to write these dirty pages to the data and log database files periodically. These processes are called Checkpoints. The Checkpoint creates a mark that is used by the SQL Server Database Engine to redo any transaction that is committed, written to the database transaction log file without reflecting the data changes to the data files due to an unexpected shutdown or crash. Also, this recovery point that is created by the Checkpoint will be used to roll back any data changes associated with uncommitted transaction, by reversing the operation written in the transaction log file. In this way the SQL Server Engine will guarantee the database consistency. The time that is taken by the SQL Server Database Engine to redo and undo the transactions is called the Recovery Time. All information about the Checkpoints will be written to the database boot page to identify till which point the database files are synchronized with the buffer pool when the system wakes up after crash or shutdown.
当在数据库中插入新行或更新现有行时,SQL Server数据库引擎会首先将该更改保留在内存的缓冲池中,而不会出于IO性能的原因将每个更改直接应用于数据库文件。 这些位于缓冲池中但尚未反映到数据库文件的数据页称为“ 脏页” 。 SQL Server数据库引擎使用一种特殊的过程将这些脏页写入数据并定期记录数据库文件。 这些过程称为Checkpoints 。 Checkpoint创建一个标记,SQL Server数据库引擎使用该标记来重做已提交到数据库事务日志文件中的所有已提交事务,而不会反映由于意外关闭或崩溃而导致数据文件的数据更改。 同样,由Checkpoint创建的此恢复点将用于通过反转事务日志文件中写入的操作来回滚与未提交的事务相关联的任何数据更改。 这样,SQL Server Engine将保证数据库的一致性。 SQL Server数据库引擎重做和撤消事务所花费的时间称为恢复时间 。 有关检查点的所有信息都将写入数据库引导页面,以标识当系统在崩溃或关闭后唤醒时,数据库文件与缓冲池同步的时间。
There are four types of Checkpoints that the SQL Server Database Engine supports: Internal, Manual, Automatic and Indirect.
SQL Server数据库引擎支持四种类型的检查点:内部,手动,自动和间接。
Internal Checkpoints are issued in response to several server events, such as the taking a database backup, creating a database snapshot, adding or removing database files, a clean shutdown for the SQL Server service is performed or 70% of the transaction log of a simple recovery model database is full.
发出内部检查点以响应多个服务器事件,例如进行数据库备份,创建数据库快照,添加或删除数据库文件,执行SQL Server服务的干净关闭或简单事务日志的70%恢复模型数据库已满。
Manual Checkpoints are triggered by executing the CHECKPOINT T-SQL command, where you can optionally specify the checkpoint_duration parameter that identifies the amount of time, in seconds, required by the checkpoint to complete. If the checkpoint duration parameter is not specified, the Manual Checkpoint will run to completion, consuming amount of time depends on the number of dirty pages that the operation must write. The below T-SQL statement will issue a Manual Checkpoint for maximum 10 seconds:
手动检查点是通过执行CHECKPOINT T-SQL命令触发的,您可以选择在其中指定checkpoint_duration参数,该参数标识完成检查点所需的时间(以秒为单位)。 如果未指定检查点持续时间参数,则手动检查点将运行到完成,消耗的时间取决于操作必须写入的脏页数。 以下T-SQL语句将发出最长10秒的手动检查点:
CHECKPOINT 10Automatic Checkpoints are issued automatically in the background when the number of log records in the buffer pool reaches the estimated number of logs that the SQL Server Database Engine can process in a server configurable amount of time called Recovery Interval. The server-level recovery interval option specifies the maximum amount of time required by the SQL Server Database Engine to recover the database after restarting the SQL Server. The default recovery interval value is 0, which issues an automatic checkpoint every 60 seconds.
当缓冲池中的日志记录数达到SQL Server数据库引擎可以在称为“ 恢复间隔”的服务器可配置时间范围内处理的估计日志数时,将在后台自动发出自动检查点 。 服务器级恢复间隔选项指定重新启动SQL Server后SQL Server数据库引擎恢复数据库所需的最长时间。 恢复间隔的默认值是0,它每60秒发布一个自动检查点。
Recovery interval value can be configured using the sp_configure T-SQL command as below:
可以使用sp_configure T-SQL命令配置恢复间隔值,如下所示:
USE [master]
GO
EXEC sp_configure 'show advanced options', 1;
GO
RECONFIGURE
GO
EXEC sp_configure 'recovery interval', 0
GO
RECONFIGURE
GO
It can also be configured using the SQL Server Management Studio from the Database Setting tab of the Server Properties window as follows:
也可以使用SQL Server Management Studio从“服务器属性”窗口的“数据库设置”选项卡中对其进行配置,如下所示:
Automatic Checkpoints also depend on the number of log records generated in the database; huge number of log records generated will issue the automatic checkpoints more frequently. The automatic checkpoint will run to the completion, same as the manual checkpoint.
自动检查点还取决于数据库中生成的日志记录的数量。 生成的大量日志记录将更频繁地发布自动检查点。 自动检查点将运行到与手动检查点相同的位置。
The time required by the SQL Server Database Engine to recover a database after a system crash depends mainly on the amount of time required to redo the dirty pages, which is longer than the recovery interval server option most of the time. So that, changing the default recovery interval value may enhance the performance, mainly if rolling back the long transactions in your database takes more than 60 seconds, or if you notice a very frequent checkpoint processes that harm the database performance, as the automatic checkpoint increases the database I/O activities when issued. It is recommended to override the default recovery interval value gradually with small increments each time and test the effect of each increase carefully, as increasing this values will increase the time required to recover your database. The automatic checkpoint is the default checkpoint type in SQL Server versions prior to SQL Server 2016.
SQL Server数据库引擎在系统崩溃后恢复数据库所需的时间主要取决于重做脏页所需的时间,该时间通常比恢复间隔服务器选项长。 因此,更改默认恢复间隔值可能会提高性能,主要是因为回滚数据库中的长事务需要60秒钟以上,或者如果您注意到频繁的检查点过程会损害数据库性能,因为自动检查点会增加发出数据库I / O活动时。 建议每次以较小的增量逐渐覆盖默认的恢复间隔值,并仔细测试每次增加的效果,因为增加此值将增加恢复数据库所需的时间。 自动检查点是SQL Server 2016之前SQL Server版本中的默认检查点类型。
Indirect Checkpoints introduced the first time in SQL server 2012, in which the recovery time can be configured at the database level, providing faster and more accurate recovery time comparing to the automatic checkpoint, as it ensures that the number of dirty pages will be always less that a specific threshold. Indirect checkpoints reduce the I/O spikes related to the checkpoints as it keeps writing the dirty pages to the database files in the background smoothly. It also considers random I/O during the REDO process, which keeps the database recovery time within the upper-bound limit.
间接检查点是在SQL Server 2012中首次引入的,其中可以在数据库级别配置恢复时间,与自动检查点相比,它可以提供更快,更准确的恢复时间,因为它可以确保脏页的数量总是更少特定的阈值。 间接检查点减少了与检查点相关的I / O尖峰,因为它不断在后台平稳地将脏页写入数据库文件。 它还在REDO过程中考虑随机I / O,这将数据库恢复时间保持在上限范围内。
If the indirect checkpoint is configured on a database with heavy OLTP workload and disk system bottleneck, it may cause a performance degradation, as it will keep writing the dirty pages to the disk very frequently in order to meet the configured recovery interval value, increasing the write load for the SQL Server.
如果在具有大量OLTP工作负载和磁盘系统瓶颈的数据库上配置了间接检查点,则可能会导致性能下降,因为它将不断频繁地将脏页写入磁盘,以满足配置的恢复间隔值,从而增加了SQL Server的写入负载。
Starting from SQL Server 2016, the default checkpoint type is the indirect checkpoint, and the default value for the recovery time option is 60 seconds for the databases created under that SQL Server version and 0 for the databases created under the older SQL Server versions, indicating that the database uses automatic checkpoints.
从SQL Server 2016开始,默认检查点类型为间接检查点,对于在该SQL Server版本下创建的数据库,恢复时间选项的默认值为60秒,对于在较早版本SQL Server下创建的数据库的恢复时间选项的默认值为0数据库使用自动检查点。
The physical data pages transfer in SQL Server 2016 is more efficient in the indirect checkpoints, as the SQL Server Database Engine transfers the data pages in bulks, with each bulk size up to 1 MB, where the maximum transfer size is 256 KB in the older versions. The time that the SQL Server Database Engine will wait for before adjusting the I/O outstanding amount also increased in SQL Server 2016, where the Database Engine will wait 20ms in the previous SQL Server versions, but now it will wait for 50ms before applying that adjustment.
SQL Server 2016中的物理数据页传输在间接检查点上更有效,因为SQL Server数据库引擎批量传输数据页,每个批量大小最大为1 MB,其中旧版本的最大传输大小为256 KB版本。 在SQL Server 2016中,SQL Server数据库引擎在调整I / O未付金额之前等待的时间也增加了,在该版本中,数据库引擎在以前SQL Server版本中将等待20ms,但是现在它将在应用之前等待50ms。调整。
The recovery time option of the database can be checked by querying the sys.databases system table for the target_recovery_time_in_seconds database property as below:
可以通过查询sys.databases系统表中的target_recovery_time_in_seconds数据库属性来检查数据库的恢复时间选项,如下所示:
SELECT name, target_recovery_time_in_seconds FROM sys.databases WHERE name = 'SQLShackDemo'The result for our SQLShackDemo test database will be like:
我们SQLShackDemo测试数据库的结果将类似于:
It can be also checked using the SQL Server Management Studio tool from the Options tab of the Database Properties as follows:
也可以使用SQL Server Management Studio工具从“数据库属性”的“选项”选项卡中对其进行检查,如下所示:
Although we are using SQL Server 2016 version, the 0 value in the previous result indicates that the SQLShackDemo database is using automatic checkpoints, as it is restored from old SQL Server version or the current instance was upgraded from older SQL Server version, which makes sense.
尽管我们使用的是SQL Server 2016版本,但上一个结果中的0值表示SQLShackDemo数据库正在使用自动检查点,因为它是从旧版SQL Server还原或当前实例已从旧版SQL Server升级的,这很有意义。
SQL Server also allows you to configure the indirect checkpoint speed as a startup parameter, by providing the (-k) followed by a decimal value that indicates the checkpoint speed in MB per second.
SQL Server还允许您通过提供(-k)后跟一个十进制值(指示以MB /秒为单位的检查点速度),将间接检查点速度配置为启动参数。
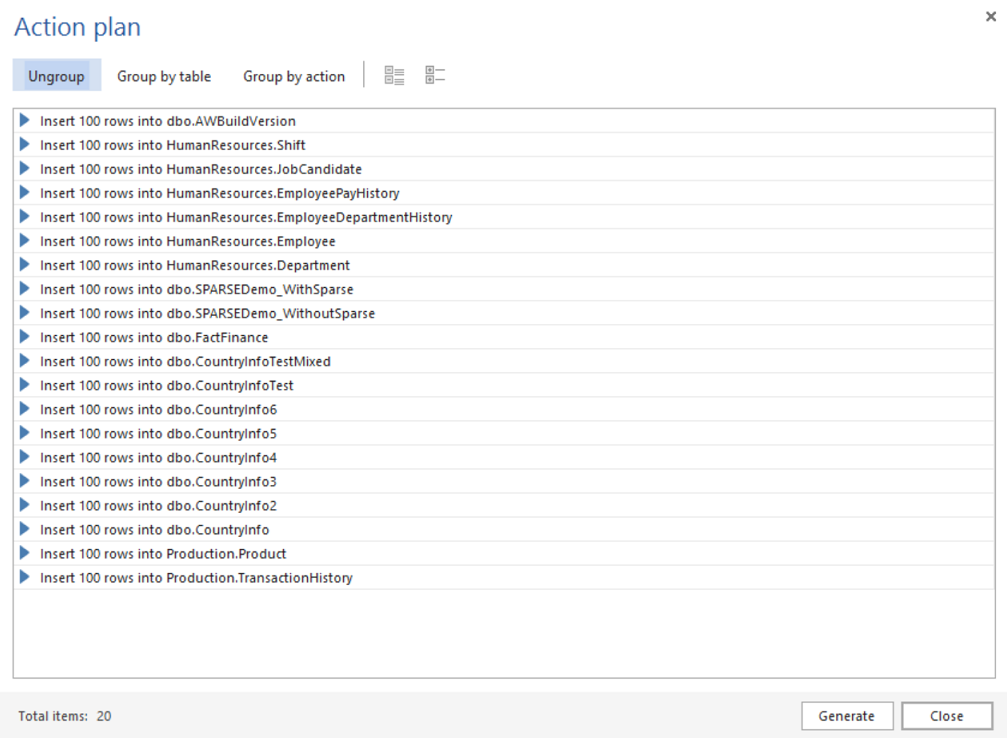
Let’s have a small demo to check how the I/O writes operation enhanced in SQL Server 2016, which by default uses the indirect checkpoints type. Assume that we need to apply a heavy DML operation in the SQLShackDemo database, by filling each table in that database with extra 100 rows using the ApexSQL Generate tool as below:
让我们做一个小演示,以检查SQL Server 2016中增强的I / O写入操作的方式,默认情况下使用间接检查点类型。 假设我们需要在SQLShackDemo数据库中应用繁重的DML操作,方法是使用ApexSQL Generate工具,用额外的100行填充该数据库中的每个表,如下所示:
As we previously found, the SQLShackDemo database uses the automatic checkpoints type. If we try to monitor the Avg. Disk Sec/write performance counter under the LogicalDisk counters group using the Performance Monitor windows tool during the insertion process, the write process will be in spikes form as below:
如我们先前发现的,SQLShackDemo数据库使用自动检查点类型。 如果我们尝试监控平均 在插入过程中使用Performance Monitor Windows工具在LogicalDisk计数器组下的Disk Sec / write性能计数器,写入过程将以尖峰形式出现,如下所示:
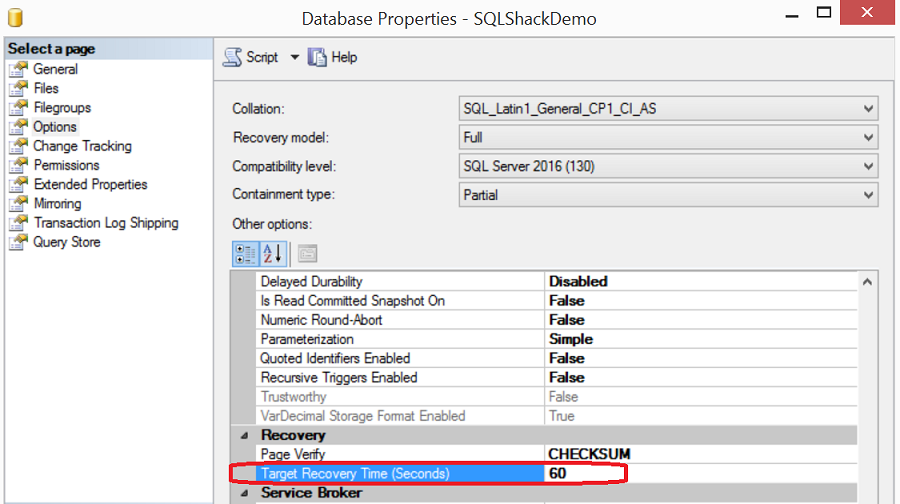
If we change the checkpoints type to indirect checkpoints, by modifying the database Target_Recovery_Time database option to 60 rather than 0 using the following ALTER DATABASE statement:
如果将检查点类型更改为间接检查点,请使用以下ALTER DATABASE语句将数据库Target_Recovery_Time数据库选项修改为60而不是0:
ALTER DATABASE [SQLShackDemo] SET TARGET_RECOVERY_TIME = 60 SECONDS WITH NO_WAIT
GO
Or using SQL Server Management Studio, from the Options tab of the Database Properties window as below:
或使用SQL Server Management Studio,从“数据库属性”窗口的“选项”选项卡中,如下所示:
And apply the same DML load on the database while monitoring the I/O write behavior using the Performance Monitor tool, the “smooth” writing result will be like:
并在使用性能监视器工具监视I / O写入行为的同时对数据库施加相同的DML负载,“平滑”的写入结果将类似于:
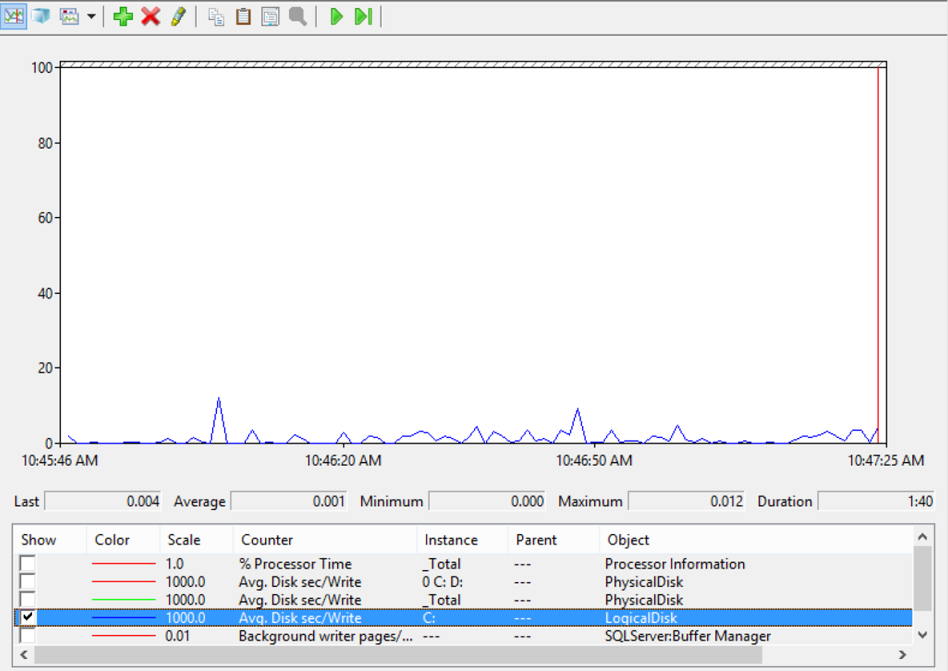
It is clear from the previous results that the write process will be in the form of big spikes when using the automatic checkpoints. When the database is configured to use the indirect checkpoints, the I/O stream became smooth small spikes providing more consistent response time on the disk with better overall performance.
从以前的结果可以明显看出,使用自动检查点时,写入过程将以大尖峰的形式出现。 将数据库配置为使用间接检查点时,I / O流变得平滑,小尖峰,从而在磁盘上提供更一致的响应时间,并具有更好的整体性能。
结论 (Conclusion)
A Checkpoint is the means in which the SQL Server Database Engine guarantees the databases consistency, where no data will be lost when the system is crashed as the dirty pages that are located in the memory and resulted from committed transaction will be redone although they are not written to the database files yet. SQL Server provides four main checkpoint types; Internal, Manual, Automatic and Indirect checkpoints. Starting from SQL Server 2016 version, the Indirect Checkpoint is the default checkpoint type that allows you to configure a faster and accurate recovery time at the database level and overcome the large writing spikes issue by writing in smooth small spikes as we clearly saw in the demo shown within the article.
检查点是SQL Server数据库引擎保证数据库一致性的一种方式,当系统崩溃时,不会丢失任何数据,因为位于内存中并由已提交事务导致的脏页将被重做,尽管它们不会被重做。写入数据库文件了。 SQL Server提供了四种主要的检查点类型: 内部,手动,自动和间接检查点。 从SQL Server 2016版本开始,间接检查点是默认检查点类型,它使您可以在数据库级别配置更快,更准确的恢复时间,并通过编写平滑的小尖峰来克服大尖峰问题,如我们在演示中清楚看到的那样显示在文章中。
Next article in this series:
本系列的下一篇文章:
- SQL Server 2016 Memory-Optimized Tables – The Checkpoint operationSQL Server 2016内存优化表–检查点操作
有用的链接 (Useful links)
- Database Checkpoints (SQL Server) 数据库检查点(SQL Server)
- CHECKPOINT (Transact-SQL) CHECKPOINT(Transact-SQL)
- Managing SQL Server transaction logs 管理SQL Server事务日志
翻译自: https://www.sqlshack.com/database-checkpoints-enhancements-sql-server-2016/
sql 数据库检查
sql 数据库检查_数据库检查点– SQL Server 2016中的增强功能相关推荐
- sql server 加密_SQL Server 2016中的新功能–始终加密
sql server 加密 There are many new features in SQL Server 2016, but the one we will focus on in this p ...
- sql 如何设置行级锁_SQL Server 2016中的行级安全性
sql 如何设置行级锁 With the release of SQL Server 2016 comes many great new features. One of these is the i ...
- sql 时态表的意义_在SQL Server 2016中拉伸时态历史记录表
sql 时态表的意义 背景 (Background) With the release of Microsoft SQL Server 2016 a lot of new features were ...
- ssas表格模型 权限控制_如何在SQL Server 2016中自动执行SSAS表格模型处理
ssas表格模型 权限控制 There are many ways to process your SSAS Tabular Model. This can be achieved in SSIS u ...
- sql server 统计_看SQL Server 2016中的新实时查询统计信息
sql server 统计 With the release of SQL Server 2016 also comes a great new feature to get a live view ...
- SQL Server 2016中的新PowerShell Cmdlet
介绍 (Introduction) PowerShell is Windows Shell that can be used to automate tasks in Windows, Exchang ...
- 如何在SQL Server 2016中比较查询执行计划
SQL Server 2016 provides great enhancement capability features for troubleshooting purposes. Some of ...
- 如何在SQL Server 2016中使用R导入/导出CSV文件
介绍 (Introduction) Importing and exporting CSV files is a common task to DBAs from time to time. 导入和导 ...
- 如何在SQL Server 2016中使用并行插入以提高查询性能
介绍 (Introduction ) In the first part of this article, we will discuss about parallelism in the SQL S ...
最新文章
- AI研究过于集中狭隘,我们是不是该反思了?
- 请领导审阅并提意见应怎么说_职场中,领导不喜欢你,暗中排挤你,怎么办?老员工给你支5招!...
- java.lang.ClassNotFoundException: org.apache.htrace.SamplerBuilder
- C语言里printf函数格式控制符的完整格式
- 关于VM虚拟机与主机不能互PING的一种可能的原因
- Java Se 、JavaEE、JavaME区别
- winForm中 Invalidate(),Update(),Reflash(),
- plupload上传文件 php,jQuery Plupload上传插件的使用方法详解
- 微信小程序:全新圣诞节头像框制作生成微信小程序源码下载支持多模板
- 使用VMware Workstation安装FusionCompute CNA和VRM
- 如何在Mysql中运行SQL文件
- ol3 加载天地图服务
- espanso-跨平台文本扩展工具
- selenium之判断是否定位正确
- android11obb,exagear安卓11数据包obb合集版
- java 画图板 锯齿_java绘画中的锯齿问题
- 医院信息系统中服务器配置的原则,如何保障医院信息系统(HIS)中数据库的安全性...
- Ubuntu16.04开机后黑屏无法进入系统登陆界面
- Android近场通信
- git版本控制命令行说明