python k近邻算法_python中的k最近邻居算法示例
python k近邻算法
K最近邻居(KNN) (K-Nearest Neighbors (KNN))
KNN is a supervised machine learning algorithm that can be used to solve both classification and regression problems. The principal of KNN is the value or class of a data point is determined by the data points around this value.
KNN是一种监督的机器学习算法,可用于解决分类和回归问题。 KNN的原理是数据点的值或类,由该值周围的数据点确定。
To understand the KNN classification algorithm it is often best shown through example. This tutorial will demonstrate how you can use KNN in Python with your own classification problems. The Jupyter Notebook which corresponds to this example can be found here, in case you would like to follow along.
为了理解KNN分类算法,通常最好通过示例来展示。 本教程将演示如何在遇到自己的分类问题的情况下在Python中使用KNN。 如果您想继续阅读,可以在此处找到与该示例相对应的Jupyter Notebook。
The prediction algorithm calculates the distance from unknown point x, to all the points in your data. The points in your data are then sorted by increasing distance from x. The prediction is made by predicting the majority label from ‘K’ closest points.
预测算法计算从未知点x到数据中所有点的距离。 然后,通过增加与x的距离来对数据中的点进行排序。 通过从“ K”个最接近点预测多数标签来进行预测。
Choosing a K will affect what class a new point will be assigned to.
选择K将影响将新点分配到的类别。
In the example below, choosing a K value of 2 will assign unknown point (black circle) to class 2. However, if the K value is 7, the unknown point will be assigned to class 1.
在下面的示例中,将K值选择为2会将未知点(黑色圆圈)分配给类别2。但是,如果K值为7,则将未知点分配给类别1。
创建假数据集 (Creating the fake dataset)
First, we import the libraries will we need, and then create a fake dataset using the makeblobs function from sklearn. We can pass in the number of samples, the features in our dataset, how many centres or classes the data will fall into, and finally the standard deviation of those clusters. For consistency between multiple runs of this Jupyter notebook, I have assigned the integer 101 to the random_state parameter.
首先,我们导入所需的库,然后使用sklearn的makeblobs函数创建一个伪数据集。 我们可以输入样本数量,数据集中的特征,数据将落入多少个中心或类别,最后是这些聚类的标准偏差。 为了在此Jupyter笔记本的多次运行之间保持一致性,我将整数101分配给random_state参数。
Note, to begin, we will have a large cluster standard deviation. This will introduce variance into the classification, which we can improve on later, by specifically choosing the optimal K value. This can be achieved using the elbow method.
注意,首先,我们将有一个较大的群集标准偏差。 这会将方差引入分类中,我们可以稍后通过具体选择最佳K值来进行改进。 这可以使用肘部方法来实现。
The makeblobs function of sklearn returns a 2-element tuple. We can create a dataframe of our features using pd.DataFrame, and passing in the index of the first tuple which corresponds to the feature data. The second element of the data tuple corresponds to the labels of the features.
sklearn的makeblobs函数返回一个2元素元组。 我们可以使用pd.DataFrame创建要素的数据框,并传入与要素数据相对应的第一个元组的索引。 数据元组的第二个元素对应于要素的标签。
We can now scale the data by importing the MinMaxScaler from Sklearn.preprocessing. Unlike other machine learning algorithms, we fit and transforms on all the training data, before performing our train test split.
现在,我们可以通过从Sklearn.preprocessing导入MinMaxScaler来缩放数据。 与其他机器学习算法不同,我们在执行训练测试拆分之前,对所有训练数据进行拟合和转换。
from sklearn.preprocessing import MinMaxScaler
scaler = MinMaxScaler()
X = scaler.fit_transform(df_feat)
from sklearn.model_selection import train_test_split
X_train, X_test, y_train, y_test = train_test_split(X, y, test_size=0.3, random_state=101)
预测算法和优化 (Prediction algorithms and optimisation)
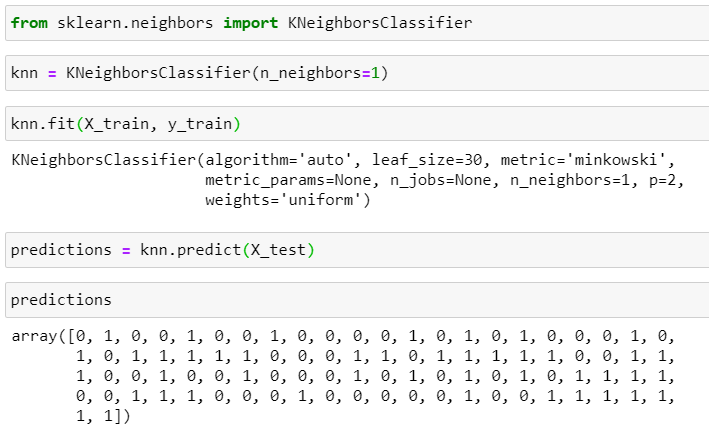
To implement predictions in code, we begin by importing KNeighborsClassifier from sklearn.neighbors. We then instantiate an instance of KNeighborsClassifier, by passing it an argument of 1 to n_neighbors, and assign this to the variable knn. The value passed to n_neighbors represents the K value.
为了在代码中实现预测,我们首先从sklearn.neighbors导入KNeighborsClassifier。 然后,我们通过将参数1传递给n_neighbors来实例化KNeighborsClassifier的实例,并将其分配给变量knn。 传递给n_neighbors的值表示K值。
We then fit to the training data, before making predictions, by calling the predict method on our KNeighborsClassifier object.
然后,在进行预测之前,通过在KNeighborsClassifier对象上调用predict方法来拟合训练数据。
Now we can assess the accuracy of the predictions using both a classification_report and confusion_matrix.
现在,我们可以同时使用category_report和confusion_matrix评估预测的准确性。
The metrics indicate that the accuracy is already very good. This is likely due to the fact that we made the dataset with makeblobs and specifically requested 2 centers. However, we did deliberately place a large value for the cluster standard deviation to introduce variance. This has resulted in the mis-classifications of 4 points in our dataset.
指标表明准确性已经非常好。 这可能是由于我们使用makeblob制作了数据集,并特别要求了两个中心。 但是,我们故意为群集标准偏差放置了一个较大的值,以引入方差。 这导致数据集中4个点的错误分类。
提高数据准确性 (Improving Data Accuracy)
We can attempt to improve the accuracy of our results by modifying the number of neighbours. This can be achieved using the elbow method.
我们可以尝试通过修改邻居数来提高结果的准确性。 这可以使用肘部方法来实现。
We first iterate through 40 neighbor values, instaniate a KNeighborsClassifier object with that number of neighbors. We can then fit the training data to this KNN model, get the predictions, and append the mean value between the predictions, pred_i and the correct values, y_test.
我们首先遍历40个邻居值,并使用该邻居数实例化一个KNeighborsClassifier对象。 然后,我们可以将训练数据拟合到此KNN模型,获得预测,并将平均值pred_i和正确值y_test附加在预测之间。
Where pred_i and y_test do not match up in the array, a true value is returned which has a value of 1. The higher this number, the more inaccurate the classification will be.
如果pred_i和y_test在数组中不匹配,则返回值为1的真实值。该数字越大,分类将越不准确。
The lower value for the error rate will correspond to a better performing model.
较低的错误率值将对应于性能更好的模型。
These results can be plotted using the range of i values on the x-axis, versus the error rate on the y-axis.
可以使用x轴上i值的范围相对于y轴上的错误率来绘制这些结果。
error_rate = []for i in range(1, 40):knn = KNeighborsClassifier(n_neighbors=i)knn.fit(X_train, y_train)pred_i = knn.predict(X_test)error_rate.append(np.mean(pred_i != y_test))plt.figure(figsize=(10, 6))plt.plot(range(1, 40), error_rate, color='blue', linestyle='--',markersize=10, markerfacecolor='red', marker='o')
plt.title('K versus Error rate')
plt.xlabel('K')
plt.ylabel('Error rate')
Now we can pick the lowest value of K which will return, the lowest error rate. Here, we can choose 5.
现在我们可以选择将返回的K的最小值,即最低的错误率。 在这里,我们可以选择5。
We can now, re-run the accuracy assessment with the confusion matrix and the classification report once more, to see if we more accurately classify the 4 misaligned points. We have improved, from 4 misclassified points to 2.
现在,我们可以再次使用混淆矩阵和分类报告重新运行准确性评估,以查看是否可以更准确地对4个未对齐的点进行分类。 我们已将错误分类的点数从4个提高到了2个。
在新数据点上进行培训 (Training on a new data point)
We can now create a data point using the original data. First we create two dataframes; one with the features and one with the labels, concatenate them into a single dataframe, and select the first row, as the data point to predict the label for. We must remember to scale the data point because the model was trained on scaled data.
现在,我们可以使用原始数据创建数据点。 首先,我们创建两个数据框; 一个带有特征,另一个带有标签,将它们连接到单个数据框中,然后选择第一行作为预测标签的数据点。 我们必须记住要缩放数据点,因为模型是在缩放数据上训练的。
The predictions indicate that data point 1, will give a label of 0, which matches up to the original dataset point, verified by calling df.head(1).
预测表明数据点1的标签为0,该标签与原始数据集点匹配,并通过调用df.head(1)进行了验证。
features = pd.DataFrame(data=data[0], columns=['feature_' + str(i) for i in range(1, 6)])
lables = pd.DataFrame(data[1], columns=['labels'])
dataset = pd.concat([features, lables], axis=1)
data_point_1 = scaler.transform(np.array(dataset.iloc[0][:-1]).reshape(-1, 5))
knn.predict(data_point_1)[0]# Output
# 0
摘要 (Summary)
KNNs are simple, the training is trivial, and it is easy to add more data. Further, there are few parameters. In this tutorial guide, I have only included the K parameter (n_neighbors) in the call to the KNeighborsClassifier class.
KNN很简单,训练很简单,并且添加更多数据很容易。 此外,参数很少。 在本教程指南中,我仅在对KNeighborsClassifier类的调用中包括了K参数(n_neighbors)。
KNNs do have drawbacks, however, which include a high prediction costs, which is worse for large datasets. KNNs are also sensitive to outliers, because outliers have an impact on the nearest points. Furthermore, they are not good with high dimensional datasets, and categorical features do not work well. The KNN algorithm becomes slow with more data, as the model needs to store all of these data points, in order to determine the distance between them.
但是,KNN确实有缺点,其中包括较高的预测成本,这对于大型数据集而言更糟。 KNN对异常值也很敏感,因为异常值会对最近的点产生影响。 此外,它们不适用于高维数据集,并且分类特征不能很好地工作。 由于模型需要存储所有这些数据点以便确定它们之间的距离,因此KNN算法在处理更多数据时会变慢。
This example is contrived and is mainly aimed at understanding how to code a KNN in Python. I deliberately made the dataset using makeblobs to illustrate how useful this function is as a tool to practise KNNs. if you would like to get my entire Jupyter Notebook, it is available here.
这个例子是人为设计的,主要目的是理解如何用Python编写KNN。 我特意使用makeblobs制作了数据集,以说明此功能作为实践KNN的工具有多有用。 如果您想获得我的整个Jupyter笔记本,可以在这里获得 。
Have a go at changing the cluster standard deviation to be a higher value, and then attempting to optimise the KNN classification using the K value with the lowest error rate.
尝试将群集标准偏差更改为更高的值,然后尝试使用具有最低错误率的K值来优化KNN分类。
In addition, KNNs can be used with to classify multiple classes. This could further be altered in the makeblobs function call by increasing the value passed to centers. These parameters can easily be adjusted and will aid the understanding of KNNs, so we can effectively incorporate them into our analysis.
此外,KNN可以用于对多个类别进行分类。 在makeblobs函数调用中,可以通过增加传递给中心的值来进一步更改此值。 这些参数可以轻松调整,并有助于理解KNN,因此我们可以将其有效地纳入我们的分析中。
Happy classifying.
分类愉快。
翻译自: https://towardsdatascience.com/k-nearest-neighbors-algorithm-in-python-by-example-79abc37a4443
python k近邻算法
http://www.taodudu.cc/news/show-2719949.html
相关文章:
- ZUCC_BB平台-Quiz
- 12个同父异母的孩子都有自闭症,简历造假的捐精者吸引了全球顶级专家
- 如何在充满不确定性的当下探索未来?
- 福特汉姆大学计算机科学专业,福特汉姆大学研究生学院
- 福特汉姆计算机专业,福特汉姆大学计算机如何
- 福特汉姆大学计算机科学专业,福特汉姆大学计算机研究生
- 编程计算三色球问题
- c语言编辑三色球问题,C语言实例编程:三色球问题
- python 三色球问题
- C语言每日一练——第85天:三色球问题
- 三色球问题,python解决
- C语言-三色球问题
- 1177三色球
- 100个python算法超详细讲解2.1:三色球
- C++枚举类型实验:三色球问题
- 【基础入门题031】三色球问题
- 算法-经典趣题-三色球
- 三色球问题python_零基础入门学习Python习题3【输密码+水仙花数+摸三色球】
- 三色球问题python_Python:验证密码程序与水仙花数、三色球问题
- 三色球问题python_面试题-三色球问题
- c语言课程设计三色球问题,C++三色球问题描述与算法分析
- java三色球问题_三色球问题,Java,算法
- java三色球问题_C语言三色球问题代码解析
- 三色球
- 三色球问题
- 影响利率风险结构的因素_利率风险结构是什么意思 影响利率的因素
- 风险热度地图(Risk heat map)
- matlab rho是什么意思,什么是Rho值
- [高项]消极风险VS积极风险
- 风险管理可分为哪两类?具体方法是什么?
python k近邻算法_python中的k最近邻居算法示例相关推荐
- python新式类c3算法_python中的MRO和C3算法
一. 经典类和新式类 1.python多继承 在继承关系中,python子类自动用友父类中除了私有属性外的其他所有内容.python支持多继承.一个类可以拥有多个父类 2.python2和python ...
- 减治算法——序列中第k大的数字
现在有一个无序序列T,我们现在的需求是寻找其中第k大的一个数字. 这种问题我一般就直接sort然后返回了,但是这里使用减治法,我们可以参考之前的快速排序的思路,先把整个数组从轴值划分,但是不用像快排那 ...
- python 预测算法_Python 与金融数据使用机器学习算法预测交易策略
记得 关注.分享.点在看 呀- 这样您就能持续收到优质的推送啦 这一期,我们将使用上一期处理好的数据特征和标签训练机器,然后预测交易策略.我们将分别使用 K近邻算法和集成学习两种方法分别完成模型的训练 ...
- python计算平方面积_python中求平方
python学习(2)--变量与表达式 python学习(2)--变量与表达式 1.与java和c语言相通,python中也分为四种运算符: (1)算数运算符(如:+.-.*./); 学过java或者 ...
- python设置堆大小_Python中的堆问题
Heap in python 堆(英语:Heap)是计算机科学中一类特殊的数据结构的统称.堆通常是一个可以被看做一棵树的数组对象.在队列中,调度程序反复提取队列中第一个作业并运行,因为实际情况中某些时 ...
- python正则化调优_Python实例介绍正则化贪心森林算法(附代码)
作者:Ankit Chaoudhary 翻译:笪洁琼 校对:梁傅淇本文共3515字,建议阅读7分钟. 通过本文与大家讨论一个被称为正则化的贪心森林算法. 引言 作为一名参与多个机器学习竞赛数据科学家, ...
- python数据库模糊查询_python中数据库like模糊查询方式
python中数据库like模糊查询方式 在Python中%是一个格式化字符,所以如果需要使用%则需要写成%%. 将在Python中执行的sql语句改为: sql = "SELECT * F ...
- python生成随机数代码_Python中产生随机数
一.Python自带的random库 1.参生n--m范围内的一个随机数: random.randint(n,m) 2.产生0到1之间的浮点数: random.random() 3.产生n---m之间 ...
- python编写ATM类_Python中编写类的各种技巧和方法
有关 Python 内编写类的各种技巧和方法(构建和初始化.重载操作符.类描述.属性访问控制.自定义序列.反射机制.可调用对象.上下文管理.构建描述符对象.Pickling).你可以把它当作一个教程, ...
最新文章
- dump mysql database_【MySQL Database】数据迁移工具:mysqldump
- 广义逆高斯分布及推广(To be continued)
- 雷蛇键盘灯光配置文件_指尖的流光溢彩,雷蛇黑寡妇蜘蛛V3竞技版开箱
- 登陆页老是提示验证码错误,validate验证控件IE下用remote方法明明返回true 但是还是报错,提示验证码错误...
- mvc if 显示html,asp.net mvc - 在MVC3 Razor中,如何在动作中获取渲染视图的html?
- 【APICloud系列|24】 MNNavigationMenu模块(导航菜单)的实现
- 利用永恒之蓝入侵服务器复制文件,msf利用永恒之蓝进行漏洞攻击
- android开源人脸识别插件,face-android-demo
- 编译华硕路由器ACRH17源代码小记
- Centos7解压Zip文件
- 计算机 仿真 流体力学剪切应力,基于影像的计算流体力学在冠状动脉疾病中的研究进展...
- html表白代码大全可复制,浪漫的html表白特效网页制作源
- 【2G模组Air202开发】使用LuatTools下载Luat底层Lod及编写第一个程序:流水灯
- 解决PageHelper.startPage(page, size)后total和PageSize总是相等的问题
- “挖坑填坑”理解快速排序
- Bigemap APP(Android)手机离线地图使用说明
- 北京最牛的医院 最牛的科室排名出炉
- 如何用python查看pyc文件_如何理解.pyc文件内容
- 【2022】年度总结——彼此当年少 莫负好时光
- 计算机网络笔记Part2 物理层(Physical Layer)