r-cnn 行人检测_了解用于对象检测的快速R-CNN和快速R-CNN。
r-cnn 行人检测
I’ve discussed Object Detection and R-CNN in detail in my previous article. You can read it here to get a better intuition.
在上一篇文章中,我已经详细讨论了对象检测和R-CNN。 您可以在此处阅读以获得更好的直觉。
One needs to know about these state-of-the-art models for Object Detection which were evolved over time and are now considered as a strong foundation to much more powerful networks existing today.
人们需要了解这些最新的对象检测模型,这些模型随着时间的流逝而发展,现在被认为是当今更强大的网络的坚实基础。
Let’s dive into the topic.
让我们深入探讨该主题。
So, there are some drawbacks to using the R-CNN version for Object Detection. They are:
因此,使用R-CNN版本进行对象检测存在一些缺点。 他们是:
- It consumes a huge amount of time, storage, and computation power.它消耗大量时间,存储和计算能力。
- It has a complex multi-stage training pipeline(3 stage — Log loss, SVM, and BBox Regressor’s L2 loss).它具有复杂的多阶段训练流水线(3个阶段-日志损失,SVM和BBox回归器的L2损失)。
Fast R-CNN, which was developed a year later after R-CNN, solves these issues very efficiently and is about 146 times faster than the R-CNN during the test time.
Fast R-CNN是在R-CNN之后一年开发的,它可以非常有效地解决这些问题,并且在测试期间比R-CNN 快146倍 。
快速R-CNN (Fast R-CNN)
The Selective Search used in R-CNN generates around 2000 region proposals for each image and each region proposal is fed to the underlying network architecture. This means, for a single image, there’d be 2000 forward passes. Consider training the network with a dataset of 1000 images. That would be a total of 2M(2000 * 1000) forward passes which is huge!
R-CNN中使用的选择性搜索为每个图像生成大约2000个区域建议,并且每个区域建议被馈送到基础网络体系结构。 这意味着,对于单个图像,将有2000个前向通过。 考虑使用1000个图像的数据集训练网络。 那将是总共2M (2000 * 1000)的向前通过,这是巨大的!
So, Fast R-CNN was based on an idea that,
因此,Fast R-CNN基于这样的思想,
Why not consider running the CNN just once per image and then find a way to share that computation across the ~2000 proposals?
为什么不考虑每个图像只运行一次CNN,然后找到一种在约2000个提案中共享该计算的方法?
In Fast R-CNN, the image is fed to the underlying CNN just once and the selective search is run on the other hand as usual. These region proposals generated by Selective Search are then projected on to the feature maps generated by the CNN. This process is called ROI Projection(Region Of Interest).
在Fast R-CNN中,图像仅被馈送到基础CNN一次,而选择搜索则照常进行。 然后将由“选择性搜索”生成的这些区域建议投影到CNN生成的特征图上。 此过程称为ROI投影 (感兴趣区域)。
Before starting with ROI Projection, one needs to know about the Sub-Sampling Ratio. It is the ratio of the feature map size to the original size of the image. For example,
在开始进行ROI投影之前,需要了解子采样率 。 它是要素地图大小与图像原始大小的比率。 例如,

The idea of ROI projection is that we get the coordinates of the bounding box from the ROI proposal and we need to project them onto the feature maps by projecting the ROI proposal with respect to the subsampling ratio.
ROI投影的想法是,我们从ROI提案中获得边界框的坐标,我们需要通过针对子采样率投影ROI提案,将其投影到特征图上。

The above diagram looks a bit complex but it isn’t as it looks. Consider an image of size 688 x 920 is fed to a CNN whose subsampling ratio is 1/16. The resulting feature map’s size then leads to 43 x 58 (688/16 x 920/16). Similarly, the size of the ROI Proposal 320 x 128, after subsampling leads to 20 x 8. Generally, the coordinates of bounding boxes are represented in 2 ways.
上面的图看起来有点复杂,但看起来却并非如此。 考虑将大小为688 x 920的图像馈送到子采样比为1/16的CNN。 然后,生成的要素图的大小为43 x 58 ( 688/16 x 920/16 )。 同样,子采样后的ROI提案320 x 128的大小为20 x 8 。 通常,边界框的坐标以两种方式表示。
- Coordinates of mid-point of the box (X, Y), Width, Height. [X, Y, W, H]框的中点(X,Y),宽度,高度的坐标。 [X,Y,W,H]
- Opposite side coordinates of the bounding box. [X1, Y1, X2, Y2]边界框的相对侧坐标。 [X1,Y1,X2,Y2]
Here, we consider the first notation. From the diagram, the mid-point of the ROI Proposal is (340,450) which leads to (21,28) in the feature map. In this way, the ROI Proposal is projected on to the feature map.
在这里,我们考虑第一个符号。 从图中可以看出 ,ROI提案的中点是(340,450) ,导致特征图中的(21,28) 。 通过这种方式,将ROI提案投影到功能图上。
The main reason behind the usage of fixed size images for the network is because of the Fully Connected Layers. These expect fixed size vectors as there are fixed weights allocated. This is the main reason why variable sized images aren’t accepted by the network. To solve this, the authors of Fast R-CNN came up with an idea of ROI Pooling where the ROI Projection on the feature map is divided into fixed dimensions.
在网络上使用固定大小的图像的主要原因在于完全连接的层。 由于分配了固定的权重,因此这些期望固定大小的向量。 这是网络不接受可变大小图像的主要原因。 为了解决这个问题,Fast R-CNN的作者提出了ROI合并的想法,其中特征图上的ROI投影被分为固定的维度。

As shown above, consider the red box as the ROI Projection onto the 8 x 8 feature map. Let’s assume that we need a 2 x 2 dimensioned output. Then dividing them equally may not be possible if there is an odd-numbered dimension. In such cases, we’ll round off to the nearest value. As shown, assume we get a 5 x 4 sized proposal. To convert it into a fixed dimensional box, we divide the height and width to that of the required ones i.e., 5/2 x 4/2 = 2.5 x 2. Rounding it on them, either way gives 2 x 2 and 3 x 2. Then each block is max-pooled and the output is calculated. In this way, we get a fixed dimensional output for any variable-sized region proposal. So now, there’s no restriction on the size of the input.
如上所示,将红色框视为8 x 8功能图上的ROI投影。 假设我们需要2 x 2尺寸的输出。 如果存在奇数维,则将它们均分可能是不可能的。 在这种情况下,我们将四舍五入到最接近的值。 如图所示,假设我们得到一个5 x 4尺寸的提案。 要将其转换为固定尺寸的框,我们将高度和宽度除以所需的高度和宽度,即5/2 x 4/2 = 2.5 x2。将它们四舍五入,任意一种方式均得出2 x 2和3 x 2 。 然后将每个块最大池化,并计算输出。 这样,对于任何可变大小的区域建议,我们都会获得固定尺寸的输出。 因此,现在,输入的大小没有限制。

As there’s also the third dimension involved which is depth in the feature maps, you can imagine in this way like poking a hole through a deck of cards. You have to apply ROI Pool in the same way to every slice as discussed above.
由于还涉及第三维,即要素地图中的深度,因此您可以想象一下,就像在一副纸牌上戳一个洞一样。 如上所述,您必须以相同的方式将ROI Pool应用于每个切片。

In Fast R-CNN we use a 7 x 7 grid for pooling. We also get rid of the last pooling layer. ROI Pooling is applied to the feature maps of the last convolution layer. The above example is for AlexNet architecture.
在Fast R-CNN中,我们使用7 x 7网格进行池化。 我们还摆脱了最后一个池化层。 ROI合并应用于最后一个卷积层的特征图。 上面的示例适用于AlexNet体系结构。

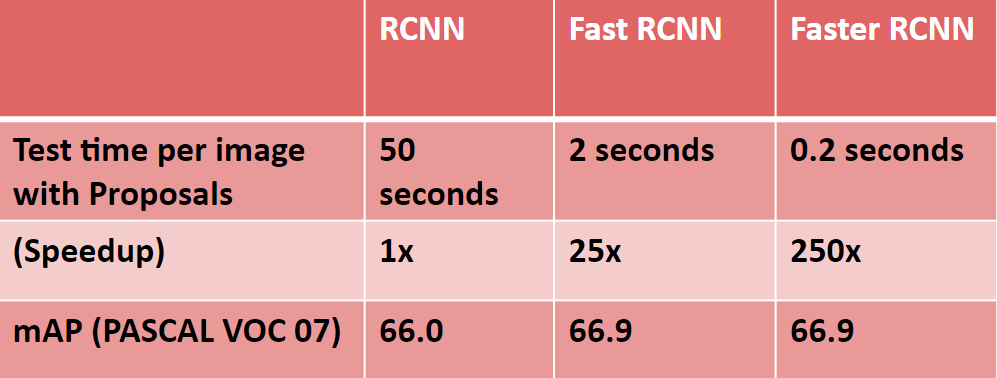
The changes from RCNN is that they’ve got rid of the SVM classifier and used Softmax instead. The loss function used for Bbox is a smooth L1 loss. The result of Fast RCNN is an exponential increase in terms of speed. In terms of accuracy, there’s not much improvement. Accuracy with this architecture on PASCAL VOC 07 dataset was 66.9%. The total loss here is the summation of the classification loss and the regression loss and the network is backpropagated with a single loss by which we can get rid of the multi-stage training problem.
RCNN的变化是它们摆脱了SVM分类器,而是使用Softmax。 用于Bbox的损失函数是平滑的L1损失。 快速RCNN的结果是速度呈指数级增长。 在准确性方面,没有太多改进。 在PASCAL VOC 07数据集上使用此体系结构的准确性为66.9% 。 这里的总损失是分类损失和回归损失的总和,网络是通过单个损失进行反向传播的,由此可以摆脱多阶段训练问题。
结果: (Results:)

更快的R-CNN (Faster R-CNN)
Even with all these advancements, there was still one remaining bottleneck in the Fast R-CNN process which is the region proposer. As we know, the first step in detecting the objects is to generate a set of potential bounding boxes around the object. In Fast R-CNN, the region proposals are created using Selective Search, a pretty slow process is found to be the bottleneck of the overall object detection process.
即使有了所有这些进步,快速R-CNN流程仍然存在一个瓶颈,这是区域提议者。 众所周知,检测物体的第一步是在物体周围生成一组潜在的边界框。 在快速R-CNN中,区域建议是使用“ 选择性搜索”创建的,发现缓慢的过程是整个对象检测过程的瓶颈。
So, we need a better technique where it gives less than 2000 region proposals, faster than selective search, as accurate as selective search or better, and should be able to propose overlapping ROIs with different aspect ratios and scales.
因此,我们需要一种更好的技术,该技术可以提供少于2000个区域建议,比选择性搜索更快,精度可以达到或优于选择性搜索,并且应该能够提出具有不同长宽比和比例的重叠ROI。
From Fast R-CNN, we know that region proposals depend on features of the image that were already calculated with the forward pass of the CNN.
从Fast R-CNN中,我们知道区域提议取决于通过CNN前向传递已经计算出的图像特征。
So why don’t we reuse those same CNN results for region proposals instead of running a separate selective search algorithm?
那么,为什么不将那些相同的CNN结果重用于区域提案,而不是运行单独的选择性搜索算法?
First, let’s understand the concept of overlapping ROIs with different aspect ratios and scales.
首先,让我们了解具有不同纵横比和比例的ROI重叠的概念。
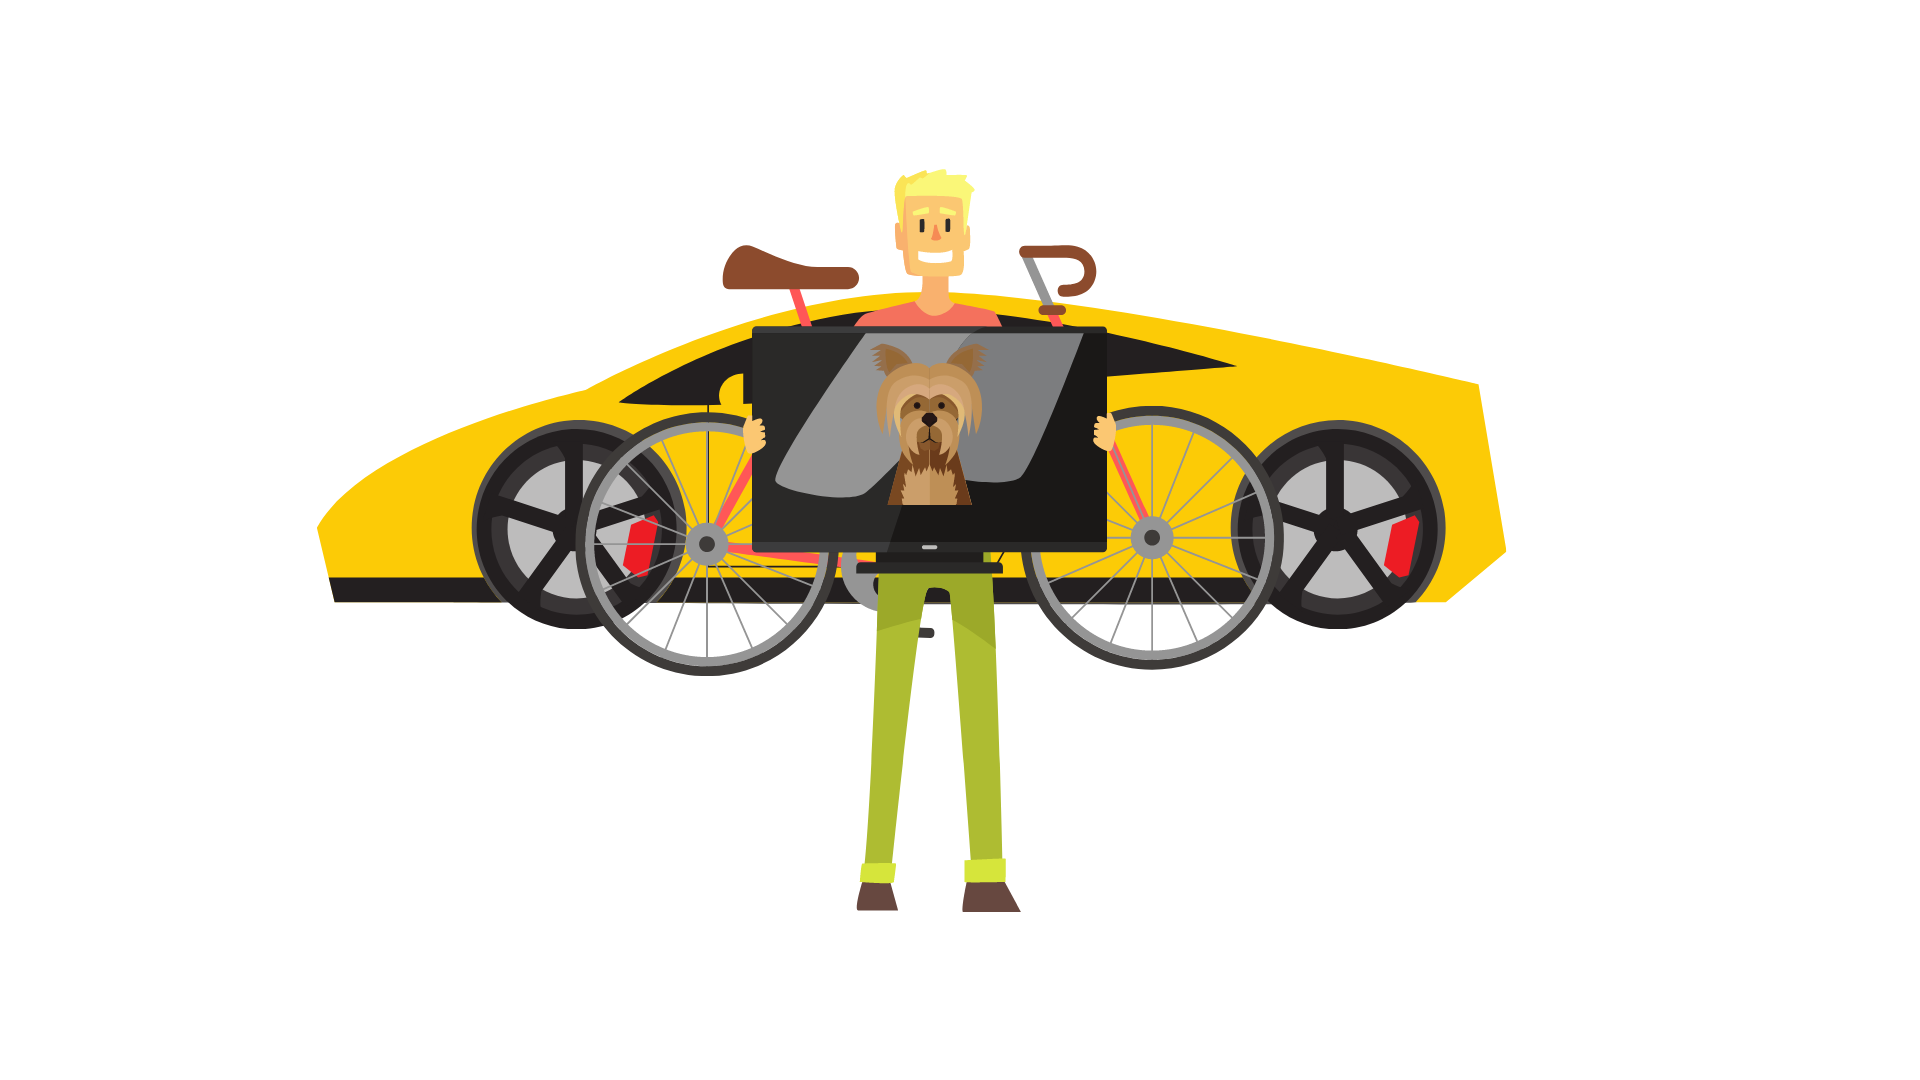
From the image, we see a lot of objects overlapping each other. We see a car, a bicycle, a person holding a television, and a dog inside this television. The selective search could solve this problem but we end up with a huge number of ROIs. We need to think of an idea that efficiently solves this.
从图像中,我们看到许多对象相互重叠。 我们在这部电视中看到一辆汽车,一辆自行车,一个拿着电视的人和一只狗。 选择性搜索可以解决此问题,但最终会产生大量的ROI。 我们需要考虑一个可以有效解决此问题的想法。
If we draw the bounding boxes around the different objects, it looks in this way.
如果我们在不同对象周围绘制边界框,它的外观将是这样。

It’s a bit complicated to achieve this but the idea of Anchor Boxes makes it simple. Let’s understand what these anchor boxes mean.
要实现此目标有些复杂,但是“锚定框”的概念使其变得简单。 让我们了解一下这些锚框的含义。
In general, objects can fit either in a squared box, or rectangular and wide, or rectangular and tall. Broadly, they can be said to be either big, small, or of medium size. So, experimentally it is found out that any object in the image can be detected using boxes of 3 different scales and 3 different aspect ratios.
通常,对象可以放在一个正方形的盒子中,也可以放在矩形和宽,或者矩形和高的盒子中。 从广义上讲,它们可以说是大,小或中等大小。 因此,通过实验发现,可以使用3种不同比例和3种不同宽高比的框来检测图像中的任何对象。

If we consider the above overlapping image it is highly possible that combining all these boxes, as shown above, will give you all the overlapping proposals, but not very accurately. A major part of the object will be covered. This could be a technique that can be used to solve our purpose of replacing the region proposer. We can think of some alternatives such as:
如果我们考虑以上重叠的图像,则很有可能将所有这些框组合在一起,如上所示,将为您提供所有重叠的建议,但不是很准确。 该对象的主要部分将被覆盖。 这可能是一种可以用来解决我们替换区域提议者的目的的技术。 我们可以想到一些替代方案,例如:
1. Removing Selective Search and applying a sliding window on top of the Feature Maps. But with this, we end detecting mostly objects of a single scale.
1.删除“选择性搜索”,然后在“要素地图”顶部应用滑动窗口。 但是,到此,我们结束了大部分检测单个尺度的对象的工作。
2. To take care of multiple scales, we have to use Image Pyramids at the input. But using images of 5 different scales (by which almost every object can be detected) makes the network 4 times slower.
2.为了照顾多个尺度,我们必须在输入处使用图像金字塔。 但是,使用5种不同比例的图像(几乎可以检测到每个物体)可以使网络慢4倍。
3. Another option is to use sliding windows of different sizes (9, as shown above) on the Feature Map. This concept is called the Feature Pyramid. This involves the use of sliding windows of 9 different sizes on top of the feature maps.
3.另一个选择是在功能图上使用不同大小的滑动窗口(如上所示,为9)。 这个概念称为特征金字塔。 这涉及在特征图的顶部使用9种不同大小的滑动窗口。
But for an image of say 600x1000, we would have had a Feature Map of size ~40x60. And using 9 different sliding windows at each position, for all the 40x60 values in the Feature Map, we end up having,40x60x9 =~20,000 proposals. Compared to Selective Search which gives just 2000 proposals, we have almost 10 times more proposals. This would be computationally more expensive and also would have more False Positives.
但是对于一个说600x1000的图像,我们将有一个大小约为40x60的功能图。 并且在每个位置使用9个不同的滑动窗口,对于“要素地图”中的所有40x60值,我们最终有40x60x9 =〜20,000个提案。 与仅提供2000个提案的“选择性搜索”相比,我们的提案几乎增加了10倍。 这将在计算上更加昂贵,并且还将具有更多的误报。
4. Consider using a simple CNN BBox regressor in place of Selective Search to get the approximate region proposals of the image which could further be fed to the underlying Fast R-CNN architecture. This is the core idea behind Faster R-CNN. Let’s dig a bit deeper.
4.考虑使用简单的CNN BBox回归器代替“选择性搜索”来获得图像的近似区域提议,然后可以将其进一步馈送到基础Fast R-CNN体系结构。 这是Faster R-CNN背后的核心思想。 让我们深入一点。

This network which gives us the approximate ROIs is termed to be the Region Proposal Network(RPN). So how do we design this RPN such that it gives us the approximate ROIs which can be further processed?
该网络为我们提供了近似的ROI,称为区域提案网络(RPN) 。 那么,我们如何设计该RPN,以便为我们提供可以进一步处理的近似ROI?
The idea here is we make use of the 9 boxes as discussed above. These are termed as the Anchor Boxes or Reference Boxes. At any point on the image, we get around 9 different bounding boxes of different scales and aspect ratios.
这里的想法是我们利用上面讨论的9个框。 这些被称为锚定框或参考框。 在图像上的任何一点,我们都会得到9个不同比例和纵横比的不同边界框。
A sliding window of size 3x3 is used upon the feature maps and on the top of each sliding window, we place these 9 boxes at the center to detect any objects present in the respective window. Let’s zoom into the RPN.
在功能图上使用大小为3x3的滑动窗口,并且在每个滑动窗口的顶部,我们将这9个框放在中心以检测相应窗口中存在的任何对象。 让我们放大RPN。

This is how we get different region proposals from all the regions of the image. The 9x represents, that part is repeated 9 times for 9 different anchors. From this, we get the required ROIs. But the problem here is again we end up with a huge number of proposals.
这就是我们从图像的所有区域中获得不同区域建议的方式。 9x表示该部分针对9个不同的锚点重复9次。 由此,我们获得了所需的投资回报率。 但是这里的问题再次是,我们最终提出了大量建议。
Considering the same example of 40x60 feature maps, we again get around 20K proposals (40 x 60 x 9). A maximum of boxes in these doesn’t have any object and such boxes should be eliminated. For that, we use a binary classifier that predicts if the box contains a foreground or any background. With this, all the boxes containing background gets eliminated. Let’s assume there are about 15K background boxes. We are left with 5K more boxes yet. As the classification includes a Softmax layer at the end, we get the confidence scores for each box indicating the probability of an object present inside that box. In this way, we can rank the boxes according to the confidence scores and use top-n proposals as ROIs. The n can be tweaked accordingly.
考虑相同的40x60特征图示例,我们再次得到约2万个提案(40 x 60 x 9)。 这些中最多没有任何对象的框,应删除此类框。 为此,我们使用二元分类器预测盒子是否包含前景或任何背景。 这样,所有包含背景的盒子都被消除了。 假设有大约15,000个背景框。 我们还剩下5K个盒子。 由于分类的最后包括S oftmax层,因此我们获得了每个盒子的置信度得分,表明该盒子内存在对象的概率。 这样,我们可以根据置信度得分对这些框进行排名,并使用前n个建议作为ROI。 可以相应地调整n。
Also, note that as we don’t use the ROI Pooling layer in the RPN, we use a convolution operation there, which acts like a sliding window and the FC layers here are replaced by the convolution operations similar to that of the Overfeat which was a predecessor to the R-CNN.
另外,请注意,由于我们不在RPN中使用ROI池化层,因此我们在其中使用了卷积运算,其作用类似于滑动窗口,并且此处的FC层被卷积运算所替代,类似于Overfeat的卷积运算。 R-CNN的前身。

So the feature maps are first convolved with a 3x3 window or filter which gives us the required anchors, followed by 1x1 convolutions one for each classification and regression parts.
因此,首先将特征图与3x3窗口或过滤器进行卷积,从而为我们提供所需的锚点,然后对每个分类和回归部分使用1x1卷积。

On the whole, this is the architecture of Faster R-CNN.
总体而言,这是Faster R-CNN的体系结构。
The Faster R-CNN is jointly trained with 4 losses:
Faster R-CNN经过联合训练,但有4项损失:
- RPN classification (Object foreground/background)RPN分类(对象前景/背景)
- RPN regresssion (Anchor → ROI)RPN回归(锚点→投资回报率)
- Fast RCNN Classification (object classes).快速RCNN分类(对象类)。
- Fast RCNN Regression (ROI → Bounding Box)快速RCNN回归(ROI→边界框)
结果: (Results:)
结论 (Conclusion)
I hope this clears your understanding of Fast and Faster R-CNNs. In December 2015, Faster RCNN along with the backbone network as ResNet -101 won the COCO Object Detection Contest and is considered as a state-of-the-art model for object detection till date. Hope you learned something new today! I’ll discuss more on Mask R-CNN and Detectron2 in my upcoming articles.
我希望这能清除您对Fast and Faster R-CNN的理解。 2015年12月, Faster RCNN与作为ResNet -101的骨干网一起赢得了COCO对象检测竞赛的冠军 ,被认为是迄今为止最先进的对象检测模型。 希望您今天学到了新东西! 我将在我的后续文章中讨论有关Mask R-CNN和Detectron2的更多内容。
If you’d like to get in touch, connect with me on LinkedIn.
如果您想取得联系,请通过LinkedIn与我联系。
If you’d like to know more about Cross-Entropy, you can read my previous article on it here.
如果您想了解有关交叉熵的更多信息,可以在这里阅读我以前的文章。
翻译自: https://towardsdatascience.com/understanding-fast-r-cnn-and-faster-r-cnn-for-object-detection-adbb55653d97
r-cnn 行人检测
http://www.taodudu.cc/news/show-1874121.html
相关文章:
- 语义分割空间上下文关系_多尺度空间注意的语义分割
- 自我监督学习和无监督学习_弱和自我监督的学习-第2部分
- 深度之眼 alexnet_AlexNet带给了深度学习的世界
- ai生成图片是什么技术_什么是生成型AI?
- ai人工智能可以干什么_我们可以使人工智能更具道德性吗?
- pong_计算机视觉与终极Pong AI
- linkedin爬虫_这些框架帮助LinkedIn大规模构建了机器学习
- 词嵌入生成词向量_使用词嵌入创建诗生成器
- 端到端车道线检测_如何使用Yolov5创建端到端对象检测器?
- 深度学习 检测异常_深度学习用于异常检测:全面调查
- 自我监督学习和无监督学习_弱和自我监督的学习-第3部分
- 聊天工具机器人开发_聊天机器人-精致的交流工具? 还是您的客户服务团队不可或缺的成员?...
- 自我监督学习和无监督学习_弱和自我监督的学习-第4部分
- ai星际探索 爪子_探索AI地牢
- 循环神经网络 递归神经网络_递归神经网络-第5部分
- 用于小儿肺炎检测的无代码AI
- 建筑业建筑业大数据行业现状_建筑—第2部分
- 脸部识别算法_面部识别技术是种族主义者吗? 先进算法的解释
- ai人工智能对话了_产品制造商如何缓解对话式AI中的偏见
- 深度神经网络 轻量化_正则化对深度神经网络的影响
- dbscan js 实现_DBSCAN在PySpark上的实现
- 深度学习行人检测简介_深度学习简介
- ai初创企业商业化落地_初创企业需要问的三个关于人工智能的问题
- scikit keras_使用Scikit-Learn,Scikit-Opt和Keras进行超参数优化
- 异常检测时间序列_DeepAnT —时间序列的无监督异常检测
- 机器学习 结构化数据_聊天机器人:根据结构化数据创建自然语言
- mc2180 刷机方法_MC控制和时差方法
- 城市ai大脑_激发AI研究的大脑五个功能
- 神经网络算法优化_训练神经网络的各种优化算法
- 算法偏见是什么_人工智能中的偏见有什么作用?
r-cnn 行人检测_了解用于对象检测的快速R-CNN和快速R-CNN。相关推荐
- 开源代码MatrixNets:用于对象检测的新的比例和长宽比感知体系结构
今天我们介绍MatrixNets(xNets),这是一种用于对象检测的新的深层体系结构.xNets将具有相似大小和高宽比的对象映射到许多专门的层中,从而使xNets可以提供可感知比例和高宽比的体系结构 ...
- 欧几里得距离网络_使用Tensorflow对象检测模型和OpenCV的社交距离和遮罩检测器...
将深度学习和计算机视觉相结合的隔离项目社会距离化 这个术语已席卷全球,正在改变着我们的生活方式.社交距离也称为"物理距离",是指在您自己与其他并非来自家庭的人之间保持安全的空间.随 ...
- TensorFlow中的对象检测教程:实时对象检测
导言 创建能够在单个图像中识别和定位多个对象的精确机器学习模型仍然是计算机视觉中的核心挑战.但随着最近深度学习的进步,对象检测应用程序比以往更容易开发.TensorFlow的对象检测API是一个构建与 ...
- 深度学习cnn人脸检测_用于对象检测的深度学习方法:解释了R-CNN
深度学习cnn人脸检测 介绍 (Introduction) CNN's have been extensively used to classify images. But to detect an ...
- 深度学习算法原理_用于对象检测的深度学习算法的基本原理
深度学习算法原理 You just got a new drone and you want it to be super smart! Maybe it should detect whether ...
- 检测和语义分割_分割和对象检测-第2部分
检测和语义分割 有关深层学习的FAU讲义 (FAU LECTURE NOTES ON DEEP LEARNING) These are the lecture notes for FAU's YouT ...
- 检测和语义分割_分割和对象检测-第1部分
检测和语义分割 有关深层学习的FAU讲义 (FAU LECTURE NOTES ON DEEP LEARNING) These are the lecture notes for FAU's YouT ...
- 检测和语义分割_分割和对象检测-第5部分
检测和语义分割 有关深层学习的FAU讲义 (FAU LECTURE NOTES ON DEEP LEARNING) These are the lecture notes for FAU's YouT ...
- cnn 句向量_深度学习目标检测Fast R-CNN论文解读
前言 我们知道,R-CNN存在着以下几个问题: 分步骤进行,过程繁琐.Selective Search生成候选区域region proposal->fine tune预训练网络->针对每个 ...
- 如何使用 Yolo v5 对象检测算法进行自定义对象检测
介绍 在本文中,将向你解释如何使用 Yolo v5 算法检测和分类60+个不同类型的道路交通标志. 我们将从非常基础的开始,涵盖每个步骤,如准备数据集.训练和测试等.在本文中,我们将使用 Window ...
最新文章
- python序列类型-Python内置的序列类型
- 感谢有你 WebRTCon 2018优秀出品人、讲师与志愿者
- 第十八章 12判断string类型字符串是否为空
- java中局部内部类_Java内部类详解--成员内部类,局部内部类,匿名内部类,静态内部类...
- 电路制版工作笔记001---印刷电路板的制作过程
- 当前网页正在试图打开你的受信用站点列表中的站点.你想允许这样做吗?
- 9个offer,12家公司,35场面试,计算机应届毕业生求职之路
- PHP所支持的时区列表
- C++类的常数据成员和常成员函数
- MyBatis官网下载步骤
- CRAFTS:端对端的场景文本检测器
- 微信8年,这几个冷知识你都知道吗?想必知道的人也不多吧
- 量产无人车?Waymo将在 底特律建厂并大规模生产自动驾驶出租车
- ReactNative基础(四)了解ListView的使用、实现GridView效果、编写一个真实网络请求案例
- ActiveMQ(二)
- 二维码生成插件qrious(纯JS)
- DMZ network
- C和C++中的struct
- 原生JS--增删改查
- hybrid7 宝马active_宝马Active Hybrid 7:最快的混合动力轿车
热门文章
- ubuntu硬盘安装及启动,menu.lst
- Markdown——让你专注写作
- 关于sql server 代理(已禁用代理xp)
- 策划入门(二)如何写一个项目建议书
- 190710每日一句
- 190317每日一句
- Atitit 头像文件上传功能实现目录1. 上传文件原理 11.1. 界面ui 11.2. 预览实现 21.3. 保存头像文件php 21.4. 保存文件nodejs java 32
- Atitit sumdoc index v6 u33.docx Atitit sumdoc index s99 目录 1. Zip ver 1 1.1. C:\Users\Adminis
- Atitit 可读性的艺术 目录 1. 原则类 1 2. 方法类 2 2.1. 1.8. 选择选择表格化 3 2 2.2. 体现了“声明式编程”的风格,即只要说明意图,而不需要写出处理细节。 2 2
- Atitit springcloud的艺术 attilax总结 目录 1.1. 服务治理:Spring Cloud Eureka 39 注册中心 1 1.2. 第4章 客户端负载均衡:Spring