About Memory leak
Using Windbg
To start working with Windbg:
- Configure the symbol file path to the Microsoft symbol server “SRV*d:\symbols*http://msdl.microsoft.com/download/symbols”.
- Add your program EXE/DLL PDB (program database) path to the symbol file path.
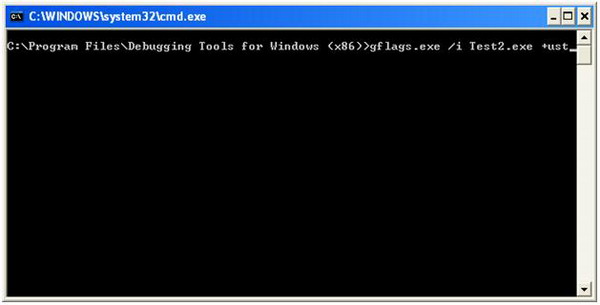
- You also need to to configure the Operating System's flag to enable user stack trace for the process which has memory leaks. This is simple, and can be done withgflags.exe.Gflags.exe is installed during Windbg's installation. This can also be done through command line, using the command “gflags.exe /i MemoryLeak.exe +ust”. My program name isTest2.exe; hence, for the demo, I will be usingTest2.exe rather thanMemoryLeak.exe. The snapshot below shows the setting of OS flags for the applicationTest2.exe.
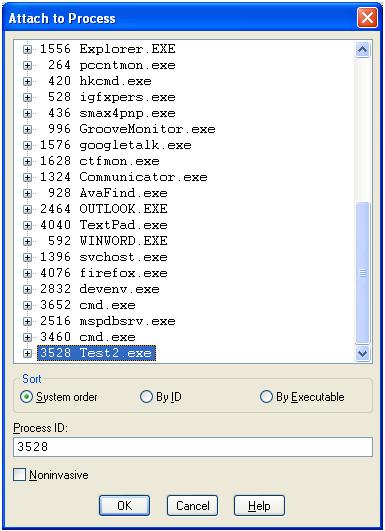
Once we have configured Windbg for the symbol file path, start the process which is leaking memory, and attach Windbg to it. The Attach option in Windbg is available under the File menu, or can be launched using the F6 shortcut. The snapshot below shows the same:
The !heap command of Windbg is used to display heaps. !heap is well documented in the Windbg help.
I have developed a small program which leaks memory, and will demonstrate further using the same.
 Collapse | Copy Code
int _tmain(int argc, _TCHAR* argv[])
{   while(1)
{
AllocateMemory();
}
return 0;
}
void AllocateMemory()
{
int* a = new int[2000];
ZeroMemory(a, 8000);
Sleep(1);
}
The above program leaks an integer array of size 2000*4 bytes.
After attaching Windbg to the process, execute the !heap –s command.-s stands for summary. Below is the output of the!heap -s for the leaking process:
Collapse | Copy Code
0:001> !heap -s
NtGlobalFlag enables following debugging aids for new heaps:
validate parameters
stack back traces
Heap     Flags   Reserv  Commit  Virt   Free  List   UCR  Virt  Lock  Fast
(k)     (k)    (k)     (k) length      blocks cont. heap
-----------------------------------------------------------------------------
00150000 58000062    1024     12     12      1     1     1    0      0   L
00250000 58001062      64     24     24     15     1     1    0      0   L
00260000 58008060      64     12     12     10     1     1    0      0
00330000 58001062   64576  47404  47404     13     4     1    0      0
-----------------------------------------------------------------------------
Let the process execute for some time, and then re-break in to the process, and execute!heap -s again. Shown below is the output of the command:
Collapse | Copy Code
0:001> !heap -s
NtGlobalFlag enables following debugging aids for new heaps:
validate parameters
stack back traces
Heap     Flags   Reserv  Commit  Virt   Free  List   UCR  Virt  Lock  Fast
(k)     (k)    (k)     (k) length      blocks cont. heap
-----------------------------------------------------------------------------
00150000 58000062    1024     12     12      1     1     1    0      0   L
00250000 58001062      64     24     24     15     1     1    0      0   L
00260000 58008060      64     12     12     10     1     1    0      0
    00330000 58001062  261184 239484 239484     14     4     1    0      0
-----------------------------------------------------------------------------
Lines marked in bold show the growing heap. The above snapshot shows a heap with the handle00330000 growing.
Execute “!heap -stat –h 00330000” for the growing heap. This command shows the heap statistics for the growing heap. Shown below is the command's output.
Collapse | Copy Code
0:001> !heap -stat -h 00330000
heap @ 00330000
group-by: TOTSIZE max-display: 20
size     #blocks     total     ( %) (percent of total busy bytes)
1f64 76c6 - e905f58  (99.99)
1800 1 - 1800  (0.00)
824 2 - 1048  (0.00)
238 2 - 470  (0.00)
244 1 - 244  (0.00)
4c 5 - 17c  (0.00)
b0 2 - 160  (0.00)
86 2 - 10c  (0.00)
50 3 - f0  (0.00)
74 2 - e8  (0.00)
38 4 - e0  (0.00)
48 3 - d8  (0.00)
c4 1 - c4  (0.00)
62 2 - c4  (0.00)
be 1 - be  (0.00)
b8 1 - b8  (0.00)
ae 1 - ae  (0.00)
ac 1 - ac  (0.00)
55 2 - aa  (0.00)
a4 1 - a4  (0.00)
The above snapshot shows 0x76c6 blocks of size 1f64 being allocated (marked in bold). Such a huge number of blocks of the same size makes us suspect that these can be leaked blocks. Rest of the block allocations do not have growing block numbers.
The next step is to get the address of these blocks. Use the command !heap -flt s 1f64. This command filters all other blocks of heap and displays the details of blocks having size 1f64.
Shown below is the output for the command:
Collapse | Copy Code
0:001> !heap -flt s 1f64
_HEAP @ 150000
_HEAP @ 250000
_HEAP @ 260000
_HEAP @ 330000
HEAP_ENTRY Size Prev Flags    UserPtr UserSize - state
003360e0 03f0 0000  [07]   003360e8    01f64 - (busy)
00338060 03f0 03f0  [07]   00338068    01f64 - (busy)
00339fe0 03f0 03f0  [07]   00339fe8    01f64 - (busy)
0033bf60 03f0 03f0  [07]   0033bf68    01f64 - (busy)
0033dee0 03f0 03f0  [07]   0033dee8    01f64 - (busy)
01420040 03f0 03f0  [07]   01420048    01f64 - (busy)
01421fc0 03f0 03f0  [07]   01421fc8    01f64 - (busy)
01423f40 03f0 03f0  [07]   01423f48    01f64 - (busy)
01425ec0 03f0 03f0  [07]   01425ec8    01f64 - (busy)
01427e40 03f0 03f0  [07]   01427e48    01f64 - (busy)
01429dc0 03f0 03f0  [07]   01429dc8    01f64 - (busy)
0142bd40 03f0 03f0  [07]   0142bd48    01f64 - (busy)
0142dcc0 03f0 03f0  [07]   0142dcc8    01f64 - (busy)
0142fc40 03f0 03f0  [07]   0142fc48    01f64 - (busy)
01431bc0 03f0 03f0  [07]   01431bc8    01f64 - (busy)
01433b40 03f0 03f0  [07]   01433b48    01f64 - (busy)
01435ac0 03f0 03f0  [07]   01435ac8    01f64 - (busy)
01437a40 03f0 03f0  [07]   01437a48    01f64 - (busy)
014399c0 03f0 03f0  [07]   014399c8    01f64 - (busy)
0143b940 03f0 03f0  [07]   0143b948    01f64 - (busy)
0143d8c0 03f0 03f0  [07]   0143d8c8    01f64 - (busy)
0143f840 03f0 03f0  [07]   0143f848    01f64 - (busy)
014417c0 03f0 03f0  [07]   014417c8    01f64 - (busy)
01443740 03f0 03f0  [07]   01443748    01f64 - (busy)
014456c0 03f0 03f0  [07]   014456c8    01f64 - (busy)
01447640 03f0 03f0  [07]   01447648    01f64 - (busy)
014495c0 03f0 03f0  [07]   014495c8    01f64 - (busy)
0144b540 03f0 03f0  [07]   0144b548    01f64 - (busy)
0144d4c0 03f0 03f0  [07]   0144d4c8    01f64 - (busy)
0144f440 03f0 03f0  [07]   0144f448    01f64 - (busy)
014513c0 03f0 03f0  [07]   014513c8    01f64 - (busy)
01453340 03f0 03f0  [07]   01453348    01f64 - (busy)
014552c0 03f0 03f0  [07]   014552c8    01f64 - (busy)
01457240 03f0 03f0  [07]   01457248    01f64 - (busy)
014591c0 03f0 03f0  [07]   014591c8    01f64 - (busy)
0145b140 03f0 03f0  [07]   0145b148    01f64 - (busy)
0145d0c0 03f0 03f0  [07]   0145d0c8    01f64 - (busy)
0145f040 03f0 03f0  [07]   0145f048    01f64 - (busy)
01460fc0 03f0 03f0  [07]   01460fc8    01f64 - (busy)
01462f40 03f0 03f0  [07]   01462f48    01f64 - (busy)
01464ec0 03f0 03f0  [07]   01464ec8    01f64 - (busy)
01466e40 03f0 03f0  [07]   01466e48    01f64 - (busy)
01468dc0 03f0 03f0  [07]   01468dc8    01f64 - (busy)
Use any UsrPtr column value from the listed output, and then use the the command!heap -p -a UsrPtr to display the call stack forUsrPtr. I have selected 0143d8c8 marked in bold.
Upon execution of !heap -p -a 0143d8c8, we get the call stack shown below:
Collapse | Copy Code
0:001> !heap -p -a 0143d8c8
address 0143d8c8 found in
_HEAP @ 330000
HEAP_ENTRY Size Prev Flags    UserPtr UserSize - state
0143d8c0 03f0 0000  [07]   0143d8c8    01f64 - (busy)
Trace: 0025
7c96d6dc ntdll!RtlDebugAllocateHeap+0x000000e1
7c949d18 ntdll!RtlAllocateHeapSlowly+0x00000044
7c91b298 ntdll!RtlAllocateHeap+0x00000e64
102c103e MSVCR90D!_heap_alloc_base+0x0000005e
102cfd76 MSVCR90D!_heap_alloc_dbg_impl+0x000001f6
102cfb2f MSVCR90D!_nh_malloc_dbg_impl+0x0000001f
102cfadc MSVCR90D!_nh_malloc_dbg+0x0000002c
102db25b MSVCR90D!malloc+0x0000001b
102bd691 MSVCR90D!operator new+0x00000011
        102bd71f MSVCR90D!operator new[]+0x0000000f
4113d8 Test2!AllocateMemory+0x00000028
41145c Test2!wmain+0x0000002c
411a08 Test2!__tmainCRTStartup+0x000001a8
41184f Test2!wmainCRTStartup+0x0000000f
7c816fd7 kernel32!BaseProcessStart+0x00000023
The lines marked in bold shows the functions from our code.
Note: Sometimes, it might happen that the “!heap -s” command does not show a growing heap. In that case, use the “!heap -stat -h” command to list all the heaps with their sizes and number of blocks. Spot the growing number of blocks, and then use the “!heap –flt s SIZE” (SIZE = the size of the suspected block) command.
License
This article, along with any associated source code and files, is licensed underThe Code Project Open License (CPOL)
About the Author
|
Mayank Rai
Software Developer (Senior)
Member |
 India
India首先使用windbg工具gflags.exe设置内存启动跟踪内存泄露进程的user stack
启动方法就是运行下面指令gflags.exe /i test.exe +ust
等价于HKEY_LOCAL_MACHINE\SOFTWARE\Microsoft\Windows NT\CurrentVersion\Image File Execution Options,命令“gflags.exe /i test.exe +ust”实际上就是在该路径下创建一个子键“test.exe”并创建一个名为GlobalFlag内容为0x00001000的REG_DWORD值。
使用windbg加载test.exe,运行关闭时windbg中会提示内存泄露
normal block at 0x026A5F98, 4000 bytes long .
Data: < > CD CD CD CD CD CD CD CD CD CD CD CD CD CD CD CD
Object dump complete.
|
可以发现地址0x026A5F98就是内存泄漏的地址泄漏4000个字节
通过!heap命令对该地址进行分析可以发现具体的调用堆栈
0:000> !heap -p -a 0x026A5F98
address 026a5f98 found in
_HEAP @ 14f0000
HEAP_ENTRY Size Prev Flags UserPtr UserSize - state
026a5f60 01fc 0000 [00] 026a5f78 00fc4 - (busy)
77a1b234 ntdll!RtlAllocateHeap+0x00000274
584d7743 MSVCR100D!_heap_alloc_base+0x00000053
584e5d8c MSVCR100D!_heap_alloc_dbg_impl+0x000001fc
584e5b2f MSVCR100D!_nh_malloc_dbg_impl+0x0000001f
584e5adc MSVCR100D!_nh_malloc_dbg+0x0000002c
584e5a91 MSVCR100D!_malloc_dbg+0x00000021
58694dd6 mfc100ud!operator new +0x00000026
58694e6a mfc100ud!operator new []+0x0000001a
58694768 mfc100ud!operator new []+0x00000018
*** WARNING: Unable to verify checksum for SendMsgEx.exe
2a3c25 SendMsgEx!CSendMsgExDlg::Thread1Proc+0x00000055
767c1174 kernel32!BaseThreadInitThunk+0x0000000e
779fb3f5 ntdll!__RtlUserThreadStart+0x00000070
779fb3c8 ntdll!_RtlUserThreadStart+0x0000001b
|
可以发现内存泄漏的地址在CSendMsgExDlg::Thread1Proc这个地址里面调用了new[]导致内存泄漏
DWORD WINAPI CSendMsgExDlg::Thread1Proc(__in LPVOID lpParameter)
{
INT *pVal = new INT [1000];
//..................
}
|
如此即可发现导致内存泄漏的原因和地址!
一般我用两种方法:
1. 用Debug Diagnostic Tool的Leak监测分析功能,注意配置好PDB文件。
DebugDiag 会生成完整的Leak Report。看看帮助很方便。
2. 用WinDBG的!heap扩展命令。注意要为你的程序打开Normal PageHeap。
然后当内存出现明显泄漏时用 !heap -l 命令分析内存。-l 参数使用类似Java/C#的Garbage Collection算法,这样能找到大部分在程序中没有被引用的HeapBlock。
这是一个示例输出:
0:011> !heap -l
Searching the memory for potential unreachable busy blocks.
......
Heap 017a0000
Scanning VM ...
Scanning references from 3586 busy blocks (0 MBytes) ...
Entry User Heap Segment Size PrevSize Unused Flags
-----------------------------------------------------------------------------
00253198 002531a0 00250000 00250000 b8 78 14 busy extra
00253250 00253258 00250000 00250000 78 b8 13 busy extra
00286a38 00286a40 00250000 00250000 b8 b8 15 busy extra
00286af0 00286af8 00250000 00250000 b8 b8 15 busy extra
00286ba8 00286bb0 00250000 00250000 b8 b8 15 busy extra
00286c60 00286c68 00250000 00250000 b8 b8 15 busy extra
00286d18 00286d20 00250000 00250000 b8 b8 15 busy extra
00286dd0 00286dd8 00250000 00250000 b8 b8 15 busy extra
找到最常出现的Size值(这里是b8),一般就是持续泄漏的内存块大小。随便选一行,记下Entry地址(比如00286a3)。
dt _DPH_BLOCK_INFORMATION 00286a3 + 8 //8 是HeapEntry结构的大小,跟在其后的就是PageHeap meta data,结构名是_DPH_BLOCK_INFORMATION.
0:011> dt _DPH_BLOCK_INFORMATION 00286a3+ 8
ntdll!_DPH_BLOCK_INFORMATION
+0x000 StartStamp : 0xabcdaaaa
+0x004 Heap : 0x80151000
+0x008 RequestedSize : 0x7b
+0x00c ActualSize : 0xa3
+0x010 FreeQueue : _LIST_ENTRY [ 0x2e - 0x0 ]
+0x010 TraceIndex : 0x2e
+0x018 StackTrace : 0x00357140
+0x01c EndStamp : 0xdcbaaaaa
看到StackTrace那行,这是相应的user mode stack trace database的地址。
0:011> dds 0x00357140
00357140 abcdaaaa
......
00357160 7c949d18 ntdll!RtlAllocateHeapSlowly+0x44
00357164 7c91b298 ntdll!RtlAllocateHeap+0xe64
00357168 004017fe 06_DebugDiag_MemoryLeak!MyHeapAlloc+0x1e [g:\debugging101\projects\06_debugdiag_memoryleak\06_debugdiag_memoryleak\06_debugdiag_memoryleak.cpp @ 11]
0035716c 0040182b 06_DebugDiag_MemoryLeak!WorkerThread+0x1b [g:\debugging101\projects\06_debugdiag_memoryleak\06_debugdiag_memoryleak\06_debugdiag_memoryleak.cpp @ 27]
00357170 7c80b683 kernel32!BaseThreadStart+0x37
这就是上次通过Heap Manager函数操作这个HeapBlock的StackTrace,一般也就是分配这个Block的地方。
Windbg加载Symbol
1. 若符号存在D:\DebugSymbols,输入命令:
.sympath SRV*d:\DebugSymbols*http://msdl.microsoft.com/download/symbols
2 .[使用!sym noisy命令希望WinDBG在获得符号的时候取得更多的信息,接着使用!lmi命令让WinDBG查看Windows的ntoskrnl模块。然后使用.reload /f尝试获取ntoskrnl的符号.]如下:
kd> !sym noisy
kd> !lmi nt
kd> .reload /f nt
成功于否输入命令查看之: kd> !lmi nt
About Memory leak相关推荐
- Android 内存管理 amp;Memory Leak amp; OOM 分析
1.Android 流程管理&内存 Android主要应用在嵌入式设备其中.而嵌入式设备因为一些众所周知的条件限制,通常都不会有非常高的配置,特别是内存是比較有限的. 假设我们编写的代 码其中 ...
- LeakDiag 微软一款检测memory leak的工具
LeakDiag是微软一款检测memory leak的工具,使用比较简单 首先去下载一个 ftp://ftp.microsoft.com/PSS/Tools/Developer%20Support%2 ...
- 《memory leak: stackwalk》
<memory leak: stackwalk> /// // // StackWalk.cpp // // Author: Oleg Starodumov // // NOTE: THI ...
- mysql memory leak_解决memory leak问题
应用程序注册了JDBC驱动,但当程序停止时无法注销这个驱动,tomcat为了防止内存溢出,就给强制注销了 解决: 重写了org.apache.commons.dbcp.BasicDataSource ...
- This is very likely to create a memory leak.
前言 tomcat 7.0.78 java 1.8.0_161 现象 tomcat启动过程中出现如下报错: The web application [/xx/xxx] appears to have ...
- Android 内存管理 Memory Leak OOM 分析
转载博客:http://blog.csdn.net/vshuang/article/details/39647167 1.Android 进程管理&内存 Android主要应用在嵌入式设备当中 ...
- 使用LeakTracer检测android NDK C/C++代码中的memory leak
Memory issue是C/C++开发中比较常遇到,经常带给人比较大困扰,debug起来又常常让人无从下手的一类问题,memory issue主要又分为memory leak,野指针,及其它非法访问 ...
- 一次bug调试经验----To prevent a memory leak, the JDBC Driver has been forcibly unregistered.
5-Feb-2019 11:03:11.635 严重 [RMI TCP Connection(2)-127.0.0.1] org.apache.catalina.core.StandardContex ...
- MFCButton Memory leak(内存泄露问题)
MFCButton Memory leak(内存泄露问题) http://m.blog.csdn.net/blog/haoekin/8851219 1.无法显示右边箭头的问题 无论怎么折腾都没显示不出 ...
- 一则JVM memory leak解决的过程
起因是我们的集群应用(3台机器)新版本测试过程中,一般的JVM内存占用 都在1G左右, 但在运行了一段时间后,慢慢升到了4G, 这是一个明显不正常的现象. 定位 过程: 1.先在该机器上按照步骤尝试重 ...
最新文章
- 手动配置mysql_手动配置Mysql,无需安装的方法以及Mysql的一些基本命令
- 基于插件化的企业级开发平台JXADF(开源)
- eclipse 提交git失败_简单10步教你使用eclipse整合gitee码云实现共享开发
- Linux下crontab乱码,Linux下crontab自动运行Java程序乱码解决方案
- 06 / LiveVideoStack主编观察:六岁的Frame.io被收购
- 路由器的修改特权密码、还原出厂设置、备份配置文件和升级操作系统实际操作...
- 提交页面插入到数据库2.jsp
- android 6.0 ios9谁快,没安卓6.0流畅?iOS 9突飞猛进终于不卡
- elasticsearch部署
- 三次样条插值-轨迹规划
- Fedora 25-64位操作系统中安装配置Hyperledger Fabric过程
- matlab 三阶段dea模型,三阶段DEA模型SFA二阶段剔除过程
- EasyUI的Vue版本
- mysql职院毕业论文设计_小说网站的设计与实现(27页)-原创力文档
- kubectl rollout restart重启pod
- 【Zynq UltraScale+ MPSoC解密学习7】Zynq UltraScale+的PMU
- c语言寻找大富翁,PTA 7-38 寻找大富翁(25 分)解法(C/C++)暴力快排/精准堆排 解法...
- oracle 12c rac tablespace 表空间删除办法
- 古人的谦称、尊称与贱称
- 手机打字软件如何测试打字快,手机打字学好拼音最笨的方法 手机打字怎么练才能快...
热门文章
- 青岛市初中计算机考试成绩查询,2021年青岛市初中学业水平考试成绩查询入口http://edu.qingdao....
- Docker基本原理
- MySQL中字段类型为longtext的值导出后显示二进制串
- 虚拟机开机出现dracut_解决u盘安装centos7出现dracut的问题_网站服务器运行维护,centos7,dracut...
- BLE 蓝牙mash系统架构
- 翻转链表II[翻转链表3种方式+dummyHead/头插法/尾插法]
- JAVA中取整数的四种方法有哪些?面试篇(第五天)
- 往csdn博客文章里面插入动态图片(视频)
- InitializeCriticalSectionAndSpinCount()
- 让别人夸你的 JS 写得漂亮