sql server 群集_SQL Server中的Microsoft群集
sql server 群集
Microsoft Clustering is the next data mining topic we will be discussing in our SQL Server Data mining techniques series. Until now, we have discussed a few data mining techniques like: Naïve Bayes, Decision Trees, Time Series, and Association Rules.
Microsoft群集是我们将在SQL Server数据挖掘技术系列中讨论的下一个数据挖掘主题。 到目前为止,我们已经讨论了一些数据挖掘技术,例如:朴素贝叶斯,决策树,时间序列和关联规则。
Microsoft Clustering is an unsupervised learning technique. In supervised training, there will be a variable that is already tagged to. In unsupervised training, there is no previously set variable as such.
Microsoft群集是一种无监督的学习技术。 在监督训练中,将有一个已被标记为变量。 在无监督训练中,没有先前设置的变量。
Clustering is used to find out imperceptible natural grouping in a data set. This data set can be a large data set. Further, if there are a large number of attributes, you need a special technique to find natural grouping as the manual grouping is impossible.
聚类用于找出数据集中不可感知的自然分组。 该数据集可以是大数据集。 此外,如果存在大量属性,则由于无法进行手动分组,因此需要一种特殊的技术来查找自然分组。
Let us see how we can perform clustering in the Microsoft SQL Server platform. In this example, we will be using the vTargetMail view in the AdventureWorksDW sample database, as we did for previous examples in the series.
让我们看看如何在Microsoft SQL Server平台中执行群集。 在本示例中,我们将使用AdventureWorksDW示例数据库中的vTargetMail视图,就像本系列中的先前示例一样。
Let us first create a data source and the Data Source View as we did in the other examples. In this, the data source would be AdventureWorksDW, while vTargetMail is the data source views.
让我们首先创建一个数据源和“数据源视图”,就像在其他示例中一样。 在这种情况下,数据源将是AdventureWorksDW,而vTargetMail是数据源视图。
In the wizard, the next is to choose the data mining technique:
在向导中,下一步是选择数据挖掘技术:
Since there is only one view in the Data Source View, vTargetMail will be the Case table and next is to choose relevant attributes as shown in the below screenshot:
由于数据源视图中只有一个视图,因此vTargetMail将成为Case表,接下来是选择相关属性,如下面的屏幕快照所示:
In the above, the Customer Key is chosen as the Key from the algorithm. Since it is assumed that attributes such as Middle Name, Title will not make major contributions towards the natural grouping, input variables are chosen with sense. If not, there will be unnecessary processing time for the data mining structures. So in the above selection, Age, BikeBuyer, CommuteDistance, EnglishEducation, EnglishOccupation, Gender, HouseOwnerFlag, MaritalStatus, NumberCarsOwned, NumberChildrenatHome, Region, TotalChildren and YearlyIncome were chosen as relevant attributes.
在上面,从算法中选择了客户密钥作为密钥。 由于假定诸如中间名,标题之类的属性不会对自然分组做出重大贡献,因此请合理选择输入变量。 否则,数据挖掘结构将不必要的处理时间。 因此,在以上选择中,选择了“ 年龄”,“骑自行车的人”,“通勤距离”,“英语教育”,“英语职业”,“性别”,“房屋所有者标志”,“婚姻状况”,“拥有的汽车数量”,“ NumberChildrenatHome”,“ Region”,“ TotalChildren”和“ YearlyIncome”作为相关属性。
Since we are using the Microsoft Clustering algorithm, there is no need to choose Predict variable. This is why we said earlier that the Microsoft Clustering is an unsupervised learning technique.
由于我们使用的是Microsoft聚类算法,因此无需选择Predict变量。 这就是为什么我们之前说过Microsoft群集是一种无监督的学习技术的原因。
Next is to select the correct Content types, though there are default Content types. Content types can be modified from the following screen:
尽管存在默认的内容类型,但下一步是选择正确的内容类型。 可以从以下屏幕修改内容类型:
In the above screenshot, for the numerical data type or long data type, the default content type will be Continuous. For example, columns like Age, Number Cars owned are numeric data types. Though they are numeric, we know that values are Discrete as Number Cars Owned contain values such as 0, 1, 2, 3, etc. Content-Type of Age, Bike Buyer, Number Cars Owned, Number Children at Home and Total Children attributes were changed to Discrete from Continuous. We will leave the Yearly Income content type as Continuous.
在上面的屏幕截图中,对于数字数据类型或长数据类型,默认内容类型将为“连续”。 例如,“年龄”,“拥有的汽车数量”之类的列是数字数据类型。 尽管它们是数字,但我们知道值是离散的,因为拥有的汽车数量包含诸如0、1、2、3等值。内容类型的年龄,自行车购买者,拥有的汽车数量,在家中子代数和子代总数属性从连续更改为离散。 我们将“年收入”内容类型保留为“连续”。
In the data mining wizard, default settings are used and now you are ready to process the data mining structure as shown in the below screenshot. This is the Solution Explorer for the Clustering data mining technique:
在数据挖掘向导中,将使用默认设置,现在您可以准备处理数据挖掘结构,如下面的屏幕快照所示。 这是用于集群数据挖掘技术的解决方案资源管理器:
After processing the data mining structure, now let us view the results. There are four analysis graphs: Cluster Diagram, Cluster Profiles, Cluster Characteristics, and Cluster Discrimination.
处理完数据挖掘结构后,现在让我们查看结果。 有四个分析图:群集图,群集配置文件,群集特征和群集区分。
集群图 (Cluster Diagram)
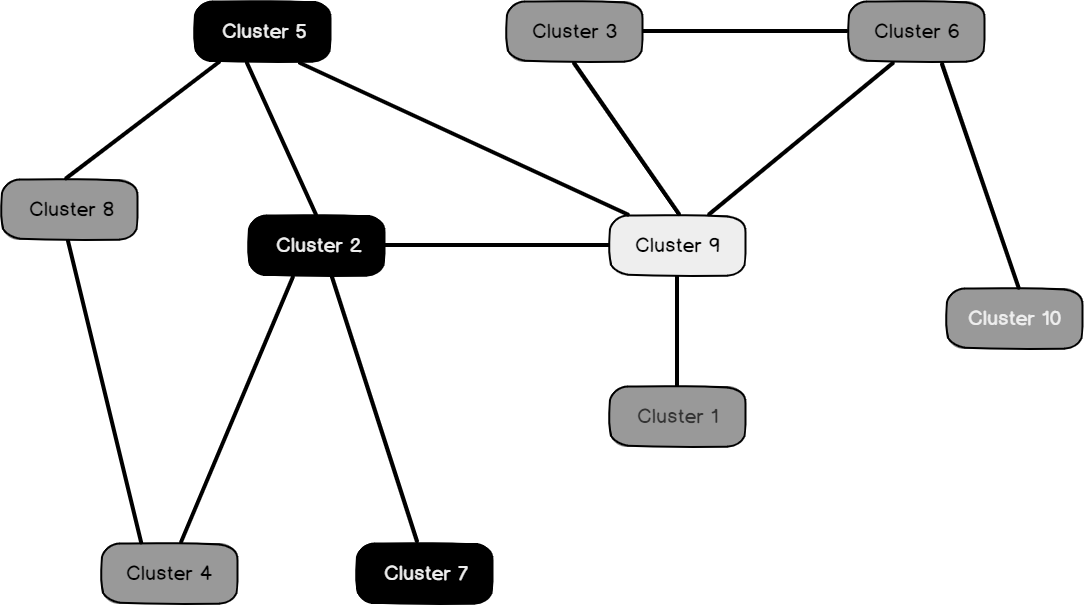
The cluster diagram has main two features. You can find the cluster distribution from the Cluster diagram. From the available drop-down, you can find the relevant cluster. When the relevant values are selected, the color will change accordingly.
群集图具有两个主要功能。 您可以从“群集”图中找到群集分布。 从可用的下拉列表中,您可以找到相关的集群。 选择相关值后,颜色将相应改变。
Following is the Cluster diagram for Bike buyer =1. This means Cluster 5, Cluster 9 and Cluster 4 have the Bike buyer = 1:
以下是自行车购买者= 1的群集图。 这意味着集群5,集群9和集群4的自行车购买者= 1:
Following is the Cluster diagram for Marital Status = S:
以下是婚姻状况= S的聚类图:
You can select the attribute and its values from the two available dropdowns.
您可以从两个可用的下拉列表中选择属性及其值。
In addition, a Cluster diagram can find out similar clusters and weak and strong links by moving the sliders up or down.
此外,通过向上或向下移动滑块,群集图可以发现相似的群集以及弱连接和强链接。
集群配置文件 (Cluster Profiles)
Each cluster has its own property. You can view the cluster profiles from this view. Since there are a few numbers of attributes, cluster profiles are shown in two images.
每个群集都有其自己的属性。 您可以从此视图查看群集配置文件。 由于属性数量很少,因此群集配置文件显示在两个图像中。
This is the first screenshot, which shows Age, Bike Buyer, Commute Distance, English Education, and Gender attributes:
这是第一张屏幕截图,显示了“年龄”,“自行车购买者”,“通勤距离”,“英语教育”和“性别”属性:
This is the second screenshot, which shows Number Children at Home, Region, Total Children, Yearly Income attributes:
这是第二张屏幕截图,显示了“在家中的孩子数”,“地区”,“孩子总数”,“年收入”属性:
Except for Yearly Income, all the other attributes are dropdowns attributes that are shown in stack bars. Continuous attribute, Yearly Income is shown as five numbers (Minimum, Maximum, Mean, First Quartile, and Third Quartile) format.
除年收入外,其他所有属性都是下拉菜单属性,显示在堆栈栏中。 连续属性,年收入显示为五个数字(最小,最大,均值,第一四分位数和第三四分位数)格式。
If you make a move on top of each stack, you will see the contributions, as shown in the below screenshot:
如果在每个堆栈的顶部进行移动,您将看到贡献,如以下屏幕截图所示:
If you closely look at these cluster profiles, you will see that Cluster 4, Cluster 5 and Cluster 9 have a higher percentage of Bike Buyers. Out of those three clusters, Cluster 4 has the highest percentage of customers who do not have a car. Further, you will see that Cluster 4 is a Low-Income as well. This means Cluster 4 can be labeled as Low Income Bike Buyers without a Car. You can rename the cluster with a business-friendly name accordingly that is shown in the below image:
如果仔细查看这些集群配置文件,您会发现集群4,集群5和集群9的自行车购买者比例更高。 在这三个集群中,集群4的无车客户比例最高。 此外,您还将看到集群4也是低收入的。 这意味着第4组可以标记为没有汽车的 低收入 自行车购买者 。 您可以使用下图所示的业务友好名称重命名集群:
After naming these clusters, if you go back to the previous cluster diagram, you will see that new cluster names are updated, as shown in the below screenshot:
在命名这些集群之后,如果返回上一个集群图,您将看到新的集群名称已更新,如以下屏幕截图所示:
With this rename option, your cluster profiles are much readable than using the default cluster names.
使用此重命名选项,与使用默认群集名称相比,您的群集配置文件更具可读性。
集群特征 (Cluster Characteristics)
You can view the characteristics of clusters using the Cluster Characteristics tab, as shown in the below screenshot:
您可以使用“群集特征”选项卡查看群集的特征,如以下屏幕截图所示:
集群歧视 (Cluster Discrimination)
Since there are ten clusters in this example, sometimes you might be interested to know the difference between the two clusters. By choosing any two clusters, you will understand the difference between the selected clustered, as shown in the below screenshot:
由于在此示例中有十个群集,所以有时您可能想知道两个群集之间的区别。 通过选择任意两个集群,您将了解所选集群之间的区别,如以下屏幕截图所示:
In the above screenshot, the first cluster predominantly has customers in Europe while the other cluster contains customers from North America.
在上面的屏幕截图中,第一个集群主要在欧洲拥有客户,而另一个集群则包含来自北美的客户。
算法参数
(Algorithm Parameters
)
As we discussed in the previous articles, we can gain better results by modifying the algorithm parameters from the following screenshot:
如前几篇文章所述,通过修改以下屏幕截图中的算法参数,可以获得更好的结果:
Let us look at important parameters for the Microsoft Clustering technique.
让我们看一下Microsoft群集技术的重要参数。
簇数
(Cluster Count
)
This parameter defines the number of clusters. As you can remember, we had 10 clusters in the example. There is no limit on the number of clusters. If this value is set to 0, a number of clusters will be decided by the algorithm. However, it is essential to limit the number of clusters to visualize better results and of course, the performance of the model. Typically, cluster count 5 is the optimal value.
此参数定义群集的数量。 您可能还记得,示例中有10个集群。 群集数量没有限制。 如果将此值设置为0,则算法将决定多个簇。 但是,必须限制聚类的数量以可视化更好的结果,当然还有模型的性能。 通常,群集计数5是最佳值。
聚类法
(Cluster Method
)
The clustering method algorithm uses can be:
算法使用的聚类方法可以是:
- Scalable EM 可扩展EM
- Non-scalable EM 不可扩展的EM
- Scalable K-means 可扩展的K均值
- Non-scalable K-means 不可缩放的K均值
In Microsoft Clustering, there are two main methods for clustering: Expectation-Maximization (EM) and K-Means. EM cluster assignment method uses a probabilistic measure while K-Means uses Euclidean distance. EM method is also called as soft clustering as one object can be fallen into multiple clusters with different probabilities. Conversely, the K-mean clustering is called Hard Clustering.
在Microsoft群集中,有两种主要的群集方法:Expectation-Maximization(EM)和K-Means。 EM集群分配方法使用概率测度,而K-Means使用欧几里得距离。 EM方法也称为软聚类,因为一个对象可以分为具有不同概率的多个聚类。 相反,K均值聚类称为硬聚类。
Clustering is an iterative process. If there are a large number of data points, a large amount of memory will be consumed. With the scalable framework, if the algorithm finds that the data point is not going to change its cluster, those points are removed from the iteration. In this technique, data is loaded by chunk. The number of data points is defined by the SAMPLE SIZE parameter. By doing so, the clustering technique will be much scalable.
聚类是一个反复的过程。 如果存在大量数据点,则会消耗大量内存。 使用可伸缩框架,如果算法发现数据点不会更改其簇,则将这些点从迭代中删除。 在这种技术中,数据是按块加载的。 数据点的数量由SAMPLE SIZE参数定义。 这样,群集技术将具有很大的可扩展性。
样本量 (Sample Size)
If you have chosen any scalable clustering option, this parameter defines how many data points should be selected for each iteration. The default value is 50,000.
如果选择了任何可伸缩的群集选项,则此参数定义每次迭代应选择多少个数据点。 默认值为50,000。
停止宽容 (Stopping Tolerance)
This parameter determines the convergence point for the iteration process to stop. Increasing this number will cause the iteration to stop quickly. If you have a large data set, you can increase this value.
此参数确定要停止的迭代过程的收敛点。 增加此数字将导致迭代快速停止。 如果数据量较大,则可以增加此值。
聚类预测 (Cluster Prediction)
The next important aspect is predicting the cluster for a given data set. This can be done by using the Mining Model prediction tab.
下一个重要方面是预测给定数据集的聚类。 这可以通过使用“挖掘模型预测”选项卡来完成。
First, you need to select the built data mining model. We will check the cluster for a one value set; hence we should select, Singleton Query option from the top:
首先,您需要选择构建的数据挖掘模型。 我们将在集群中检查一个值集; 因此,我们应该从顶部选择Singleton Query选项:
Now we need to enter values for each attribute. For the nominal variables, you need to select from the available values, whereas, for the continuous variables like Yearly Income, you need to type a value.
现在我们需要为每个属性输入值。 对于名义变量,您需要从可用值中进行选择,而对于像年收入这样的连续变量,则需要输入一个值。
The following screenshot shows how values are entered for a variable:
以下屏幕截图显示了如何为变量输入值:
In case you don’t know values for any variables, you can tag that as Missing. However, it is important to catch as much as values possible.
如果您不知道任何变量的值,可以将其标记为Missing 。 但是,重要的是要捕获尽可能多的值。
Then you will choose Prediction function in the bottom half of the screen, as shown below:
然后,您将在屏幕的下半部分选择预测功能,如下所示:
When the result option is clicked, you will get the following results, showing the relevant cluster that this data set belongs to:
单击结果选项时,您将获得以下结果,显示此数据集所属的相关集群:
This result indicates that your data set belongs to the Two Children North America cluster with 0.61 probability. The Distance parameter indicates how far your data set is from this cluster. Basically, it is the inverse of the probability.
此结果表明您的数据集以0.61的概率属于“ 两个孩子的北美”集群。 Distance参数指示您的数据集与该群集的距离。 基本上,它是概率的倒数。
Then your next question would be what other probable clusters are. This can be obtained from the Predication function, Histogram, as shown in the below screenshot:
然后,您的下一个问题将是其他可能的集群。 可以从“预测”功能直方图获得,如以下屏幕快照所示:
The following screenshot shows the results for the above prediction function:
以下屏幕截图显示了上述预测功能的结果:
The above result shows that this particular data set belongs to three different clusters with different probabilities.
以上结果表明,该特定数据集属于三个具有不同概率的不同群集。
摘要
(Summary
)
Clustering is an unsupervised technique that can be used to create natural grouping in a data set. There are two main techniques K-Means and EM. To facilitate large data volumes, the scalable option is available too. In Microsoft Clustering, there are multiple views to get more details into the clustering. Cluster Diagram provides you with the relationship of available clusters. The cluster Profile view provides the pictorial view of the cluster profiles. The Cluster Characteristics view will provide you with the details of a selected cluster, whereas Cluster Discrimination will provide you the option of comparison of two selected clusters.
聚类是一种不受监督的技术,可用于在数据集中创建自然分组。 K-Means和EM有两种主要技术。 为了促进大数据量,可伸缩选项也可用。 在Microsoft群集中,有多个视图可将更多详细信息添加到群集中。 集群图为您提供可用集群的关系。 群集配置文件视图提供了群集配置文件的图片视图。 “群集特征”视图将为您提供选定群集的详细信息,而“群集区分”将为您提供两个选定群集的比较选项。
From the built model, predications can be done where we can get the cluster it belongs to and its probability.
从构建的模型中,可以进行谓词预测,从中可以获取它所属的集群及其概率。
目录 (Table of contents)
| Introduction to SQL Server Data Mining |
| Naive Bayes Prediction in SQL Server |
| Microsoft Decision Trees in SQL Server |
| Microsoft Time Series in SQL Server |
| Association Rule Mining in SQL Server |
| Microsoft Clustering in SQL Server |
| Microsoft Linear Regression in SQL Server |
| Implement Artificial Neural Networks (ANNs) in SQL Server |
| Implementing Sequence Clustering in SQL Server |
| Measuring the Accuracy in Data Mining in SQL Server |
| Data Mining Query in SSIS |
| Text Mining in SQL Server |
| SQL Server数据挖掘简介 |
| SQL Server中的朴素贝叶斯预测 |
| SQL Server中的Microsoft决策树 |
| SQL Server中的Microsoft时间序列 |
| SQL Server中的关联规则挖掘 |
| SQL Server中的Microsoft群集 |
| SQL Server中的Microsoft线性回归 |
| 在SQL Server中实现人工神经网络(ANN) |
| 在SQL Server中实现序列聚类 |
| 在SQL Server中测量数据挖掘的准确性 |
| SSIS中的数据挖掘查询 |
| SQL Server中的文本挖掘 |
翻译自: https://www.sqlshack.com/microsoft-clustering-in-sql-server/
sql server 群集
sql server 群集_SQL Server中的Microsoft群集相关推荐
- sql server序列_SQL Server中的Microsoft时间序列
sql server序列 The next topic in our Data Mining series is the popular algorithm, Time Series. Since b ...
- sql 实现决策树_SQL Server中的Microsoft决策树
sql 实现决策树 Decision trees, one of the very popular data mining algorithm which is the next topic in o ...
- sql server 关联_SQL Server中的关联规则挖掘
sql server 关联 Association Rule Mining in SQL Server is the next article in our data mining article s ...
- sql server序列_SQL Server中的序列对象功能
sql server序列 序列介绍 (Introduction to Sequences) 序列是SQL Server 2012中引入的用于密钥生成机制的新对象. 它已在所有版本SQL Server ...
- sql server 群集_SQL Server群集索引概述
sql server 群集 This article targets the beginners and gives an introduction of the clustered index in ...
- sql server 加密_SQL Server 2016中的新功能–始终加密
sql server 加密 There are many new features in SQL Server 2016, but the one we will focus on in this p ...
- sql server 密钥_SQL Server中的升序密钥和CE模型变化
sql server 密钥 In this note, I'm going to discuss one of the most useful and helpful cardinality esti ...
- sql数据透视_SQL Server中的数据科学:取消数据透视
sql数据透视 In this article, in the series, we'll discuss understanding and preparing data by using SQL ...
- sql语句截断_SQL Server中SQL截断和SQL删除语句之间的区别
sql语句截断 We get the requirement to remove the data from the relational SQL table. We can use both SQL ...
最新文章
- Twisted入门教程(3)
- 技术战“疫”,贾扬清、李飞飞要给程序员直播讲AI技术!
- FoundationDB Record Layer 宣布开源,提供关系数据库功能
- 148. Leetcode 455. 分发饼干 (贪心算法-基础题目)
- 计算机软件可分为哪三类,系统总线是什么_系统总线分为哪三类
- 苹果再因“降频门”遭遇集体诉讼,11.5万用户出拳
- SKNode的子类和常用的Action
- 【学习笔记】浅识差分隐私
- mysql workbench uml_Ubuntu 16.04下UML建模PowerDesigner的替代ERMaster和MySQL Workbench
- 一款号称最适合程序员的编程字体(JetBrains Mono)专为开发人员设计。
- 【音频】G711编码原理
- CICD篇-Travis-CI环境搭建
- 非IE浏览器下ActiveX技术的替代方案
- delphi技巧总结收集
- 禁止搜索引擎收录网站内容的几种方法
- spring boot redisLock redis分布式锁
- Lib之过?Java反序列化漏洞通用利用分析
- Android 调用.so包时报错:UnsatisfiedLinkError: No implementation found for XXX 时的解决办法
- outer和left outer join有什么区别??
- stanford-corenlp 中各词性含义标注