SQL Server内存性能监视工具
内存压力使查询变慢 (Memory pressure slowing down queries)
This article is the sequel in a series about SQL Server monitoring tools and common performance issues. The first article SQL Server monitoring tools for disk I/O performance is about how to detect and solve high input/output on hard disk subsystems when doing too much work during peak or maintenance times.
本文是有关SQL Server监视工具和常见性能问题的系列文章的续篇。 有关提高磁盘I / O性能SQL Server监视工具的第一篇文章是有关在高峰或维护时间内进行过多工作时如何检测和解决硬盘子系统上大量输入/输出的问题。
This article can be read independently but to get the full picture it’s recommended that part one is read first. Also, because issues described with the disk I/O performance can be manifested from memory issues. Therefore, feel free to check out initial write-up at the following link: SQL Server monitoring tools for disk I/O performance
可以独立阅读本文,但要全面了解,建议您首先阅读第一部分。 同样,因为磁盘I / O性能描述的问题可以从内存问题中看出来。 因此,请随时通过以下链接检查初始记录: 用于磁盘I / O性能SQL Server监视工具
One of the obvious problems with memory that doesn’t really require any SQL Server monitoring tool to be detected is when the system simply doesn’t have enough random-access memory AKA RAM. In such cases, memory pressure can occur because SQL Server simply cannot allocate enough memory.
内存中并不需要任何SQL Server监视工具的明显问题之一就是系统根本没有足够的随机存取内存AKA RAM。 在这种情况下,可能会出现内存压力,因为SQL Server根本无法分配足够的内存。
Hopefully, this will be a short article rather than a long one like I did with disk I/O performance but this stuff is essential to get the complete picture and take all things into account when troubleshooting performace issues. If you’ve troubleshooted memory issue before, then you probably encountered some of the symptoms like system wide performance decrease and I/O increase.
希望这将是一篇简短的文章,而不是像我对磁盘I / O性能所做的那样篇幅较长的文章,但这对于获得完整的概况以及在对性能问题进行故障排除时要考虑到所有因素至关重要。 如果您之前已经解决了内存问题,那么您可能会遇到一些症状,例如系统范围的性能下降和I / O增大。
性能监控工具 (Tools for performance monitoring)
动态管理视图 (Dynamic management views)
So, let’s get started with the Dynamic Management Views AKA DMVs. Most of you knows what DMVs are, but for those who doesn’t, DMVs are views and functions that return server state information which can be used to monitor the health of a server instance, diagnose problems, etc.
因此,让我们开始使用动态管理视图 AKA DMV。 你们中的大多数人都知道DMV是什么,但对于那些不知道的DMV,则DMV是返回服务器状态信息的视图和函数,这些信息可用于监视服务器实例的运行状况,诊断问题等。
The three commonly used DMVs in SQL Server for memory performance are:
SQL Server中用于内存性能的三种常用DMV是:
- sys.dm_os_sys_info sys.dm_os_sys_info
- sys.dm_os_sys_memory sys.dm_os_sys_memory
- sys.dm_os_process_memory sys.dm_os_process_memory
Let’s fire up SSMS and execute some queries, see what those DMVs will return. Use the code from bellow and execute it:
让我们启动SSMS并执行一些查询,看看那些DMV将返回什么。 使用下面的代码并执行:
SELECT dosi.physical_memory_kb, dosi.virtual_memory_kb, dosi.committed_kb, dosi.committed_target_kb
FROM sys.dm_os_sys_info dosi;
This will return set of useful information about the machine:
这将返回有关机器的有用信息集:
- physical_memory_kb – total amount of physical memory on the machine physical_memory_kb –计算机上的物理内存总量
- virtual_memory_kb – total amount of virtual address space available to the process in user mode virtual_memory_kb –用户模式下进程可使用的虚拟地址空间总量
- committed_kb – committed memory in kilobytes (KB) in the memory manager commit_kb –内存管理器中已提交的内存,以千字节(KB)为单位
- committed_target_kb – amount of memory, in kilobytes (KB), that can be consumed by SQL Server memory manager commit_target_kb – SQL Server内存管理器可以消耗的内存量(以千字节(KB)为单位)
To view current system memory information, use the query below:
要查看当前系统内存信息,请使用以下查询:
SELECT dosm.total_physical_memory_kb, dosm.available_physical_memory_kb, dosm.system_memory_state_desc
FROM sys.dm_os_sys_memory dosm;
This time, we actually got a friendly user message that available physical memory is high which is nice:
这次,我们实际上收到了一条友好的用户消息,即可用物理内存很高,这很不错:
- total_physical_memory_kb – total amount of physical memory available to the operating system total_physical_memory_kb –操作系统可用的物理内存总量
- available_physical_memory_kb – total amount of physical memory available available_physical_memory_kb-可用的物理内存总量
- system_memory_state_desc – explanation of the memory state (Available physical memory high or low/Physical memory usage is steady/Physical memory state is transitioning) system_memory_state_desc –内存状态的说明(可用的物理内存高或低/物理内存使用率稳定/物理内存状态正在转变)
The last one shows current SQL Server process memory:
最后一个显示当前SQL Server进程内存:
SELECT dopm.physical_memory_in_use_kb, dopm.process_physical_memory_low, dopm.process_virtual_memory_low
FROM sys.dm_os_process_memory dopm;
This will return flags to let us know if physical and virtual process memory for SQL Server is low:
这将返回标志,让我们知道SQL Server的物理和虚拟进程内存是否不足:
- physical_memory_in_use_kb – indicates the process working set in KB physical_memory_in_use_kb –表示以KB为单位的进程工作集
- process_physical_memory_low – indicates that the process is responding to low physical memory notification process_physical_memory_low –指示进程正在响应低物理内存通知
- process_virtual_memory_low – indicates that low virtual memory condition has been detected process_virtual_memory_low –指示已检测到虚拟内存不足的情况
If both flags are zero, you’re in good shape.
如果两个标志均为零,则状态良好。
资料收集器 (Data collector)
Moving on, let’s take a look at some counters for performance monitoring and SQL Server monitoring tools that can be used to track them:
继续,让我们看一些 用于性能监视的计数器和可用于跟踪它们SQL Server监视工具:
Memory available megabytes – this is just a great all around counter especially if we track it for a long time because we can find out what thresholds are for memory. The default memory threshold value is 100 MB.
可用内存兆字节 –这只是一个很好的计数器,特别是如果我们长时间跟踪它,因为我们可以找出内存的阈值。 默认内存阈值为100 MB。
SQLServer:Buffer Manager/Buffer cache hit ratio – this represents a percentage of how often SQL Server can find data pages in memory as opposed to fetching them from the disk. This number should be == > 98%. I’d say that if that ratio is less than 95% than the server is under memory pressure. We always want this to be extremely high.
SQLServer:缓冲区管理器/缓冲区高速缓存命中率 –表示SQL Server在内存中查找数据页面(而不是从磁盘中获取数据)的频率的百分比。 此数字应为==> 98%。 我要说的是,如果该比例小于服务器承受内存压力的95%。 我们一直希望这个数字很高。
SQLServer:Buffer Manager/Page life expectancy – this is probably the most popular performance counter when it comes to memory in SQL Server. It represents the number of seconds a page will stay in the buffer pool without the references. If I’d have to choose one counter, this metric is the one that all SQL Server monitoring tools should be able to track. So, essentially, we want the page to stay in the buffer for as long as possible because it will lead to high performance. This is simply because if a request comes in for that page, it can be read from the cache rather than searching on the disk and ultimately reduce I/O. As for the expected value, this is a tricky one. You’ll probably read online that it should be more than 300. This is an old rule, when SQL Server memory could maximum be 4 GB. These days, we can have much more RAM than that and this metric is basically memory dependent. Therefore, one of the most known memory formulas that can be found to calculate your PLE value online is the amount of allocated memory to SQL Server divide by 4 and multiply that number with 300. For example, if 16 GB is allocated to SQL Server it should look like this 300 * (16/4) = 1.200. So, this number is your base and if our PLE value is below this number that would be a good indication that SQL Server does not have enough memory to keep pages in the buffer long enough. By the way, this will directly affect buffer cache hit ratio. Therefore, those two are the most important SQL Server monitoring tools and commonly used counters to discover memory pressures.
SQLServer:Buffer Manager /页面预期寿命 –当涉及到SQL Server中的内存时,这可能是最受欢迎的性能计数器。 它表示没有引用页将保留在缓冲池中的秒数。 如果必须选择一个计数器,则此指标是所有SQL Server监视工具都应能够跟踪的指标。 因此,从本质上讲,我们希望页面尽可能长时间地保留在缓冲区中,因为它将导致高性能。 这仅仅是因为,如果有针对该页面的请求进入,则可以从缓存中读取该请求,而不必在磁盘上进行搜索,从而最终减少了I / O。 至于期望值,这是一个棘手的问题。 您可能会在网上阅读到它应该大于300。这是一条旧规则,当SQL Server内存最大为4 GB时。 如今,我们可以拥有更多的RAM,而该指标基本上取决于内存。 因此,可以找到用于在线计算PLE值的最著名的内存公式之一是分配给SQL Server的内存量除以4,然后将该数字乘以300。例如,如果为SQL Server分配了16 GB应该看起来像这样300 *(16/4)= 1.200。 因此,此数字是您的基础,并且如果我们的PLE值低于此数字,则可以很好地表明SQL Server没有足够的内存来将页面在缓冲区中保留足够长的时间。 顺便说一句,这将直接影响缓冲区高速缓存命中率。 因此,这两个是最重要SQL Server监视工具,也是发现内存压力的常用计数器。
For more information about monitoring two types of counters above, see the SQL Server memory performance metrics – Part 4 – Buffer Cache Hit Ratio and Page Life Expectancy article.
有关监视以上两种类型的计数器的更多信息,请参见SQL Server内存性能指标-第4部分-缓冲区高速缓存命中率和页面预期寿命一文。
SQLServer:Buffer Manager/Lazy writes/sec – this number represents how many pages are flushed from memory outside of the checkpoint process when there’s memory pressure. This value should always be < 20, if it’s greater then you should probably consider allocating more memory to SQL Server.
SQLServer:Buffer Manager /延迟写入/秒-此数字表示在存在内存压力时从检查点进程之外的内存中刷新了多少页。 该值应始终小于20,如果大于20,则可能应考虑为SQL Server分配更多的内存。
For more information about monitoring this type of counter, see the SQL Server memory performance metrics – Part 5 – understanding Lazy Writes, Free List Stalls/sec, and Memory Grants Pending article.
有关监视此类计数器的更多信息,请参见SQL Server内存性能指标–第5部分–了解惰性写入,空闲列表停顿/秒和“内存授予未决”一文。
性能监控器 (Performance Monitor)
Next, let’s see how we can monitor some of the counters using the native system SQL Server monitoring tool Performance Monitor. If you’re not familiar with this tool, check out the first part of the series for detailed information on how to run it and more importantly how to create a custom data set for monitoring specific counters. I’ve already created one called “Memory” and from the list of available counters, I’ve added the following:
接下来,让我们看看如何使用本机系统SQL Server监视工具Performance Monitor监视某些计数器。 如果您不熟悉此工具,请查看该系列的第一部分,以获取有关如何运行它的详细信息,更重要的是,如何创建用于监视特定计数器的自定义数据集。 我已经创建了一个称为“内存”的内存,并从可用计数器列表中添加了以下内容:
Now, if I would just start this data collection set, nothing unusual would have happened on my local machine. On idle, the result would have been perfect. So, let’s create some heat by running the SQL Server monitoring tool shipped within SQL Server called SQLIOSim. Again, I’m going to use the same stress test in which I’ve already pre-configured everything. If needed, jump to part one for details on how to do it.
现在,如果我只是启动此数据收集集,则在本地计算机上不会发生任何异常情况。 闲置时,结果将是完美的。 因此,让我们运行运行在SQL Server中SQL Server监视工具SQLIOSim来制造热量。 同样,我将使用已经预先配置所有内容的压力测试。 如果需要,请跳至第一部分以获取有关操作方法的详细信息。
Basically, I’ve just ran the stress test, then also started data collector set in Performance Monitor and let both run for about 10 minutes. Feel free to let the stress test finish its job, but this can be time consuming depending on the machine configuration:
基本上,我刚刚进行了压力测试,然后还启动了性能监视器中的数据收集器设置,并让它们都运行了大约10分钟。 随意让压力测试完成其工作,但这可能很耗时,具体取决于机器配置:
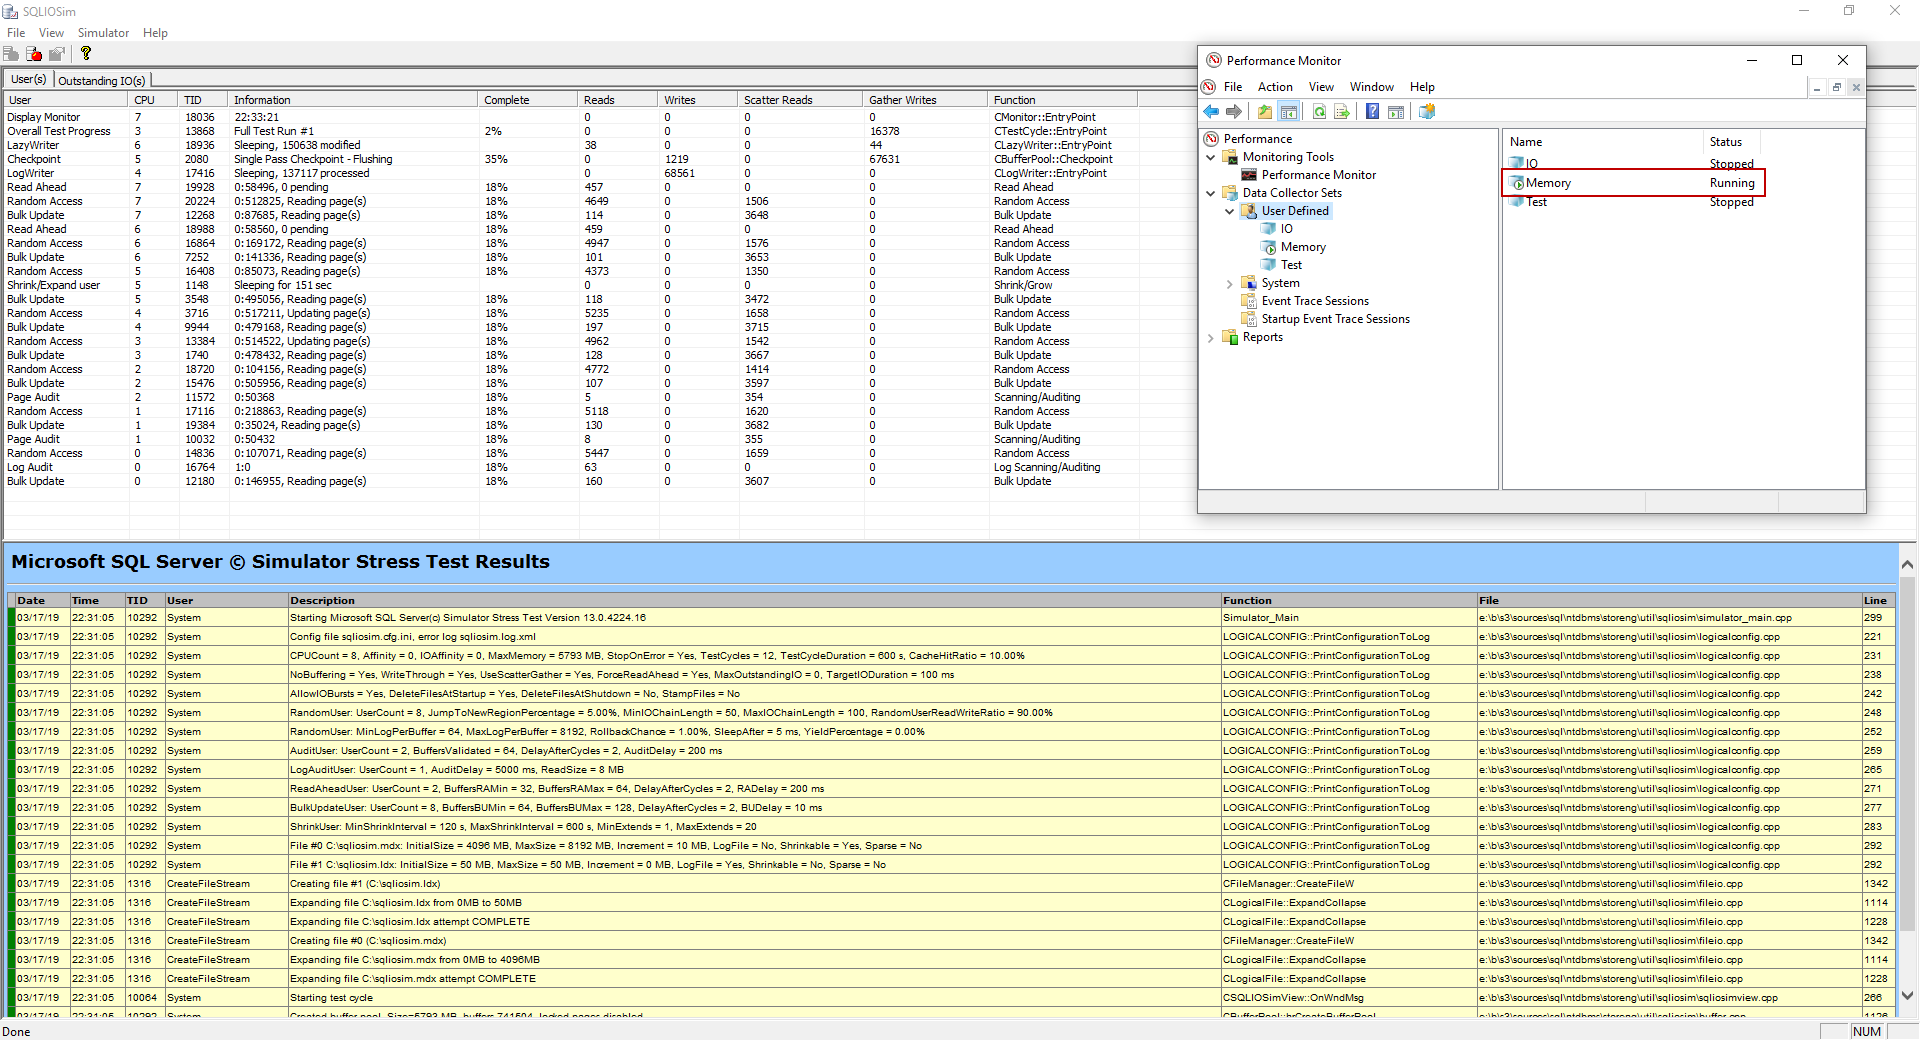
Once it’s done, click the memory report under user defined reports folder and switch over to report graph type:
完成后,单击用户定义的报告文件夹下的内存报告,然后切换到报告图形类型:
On my local machine, I’ve got 16 GB od RAM. We can run the query below to see how much is dedicated to SQL Server:
在我的本地计算机上,我有16 GB的od RAM。 我们可以在下面运行查询,以了解有多少专用于SQL Server:
SELECT c.name, c.value_in_use
FROM sys.configurations c
WHERE c.name LIKE '%server memory%';
Results from my machine:
我的机器的结果:
If the number of maximum amounts of memory that SQL Server will use is 2147483647 that indicates SQL Server will use as much memory as it can get, assuming it needs it. This is also the default value for max server memory (MB). So, back to the report, we’ve got almost 5 gigs od available RAM. More importantly, under the buffer manager counters, we have Buffer cache hit ratio at almost 100 percent. Now, this is as good as it gets, remember that we want a high value here. Lazy writer a second at zero are even better. Last but not least, Page life expectancy value is way above the base for this system which is really good. This means that pages are not getting flushed out of the memory because memory is not getting turned over.
如果SQL Server将使用的最大内存量为2147483647,则表明SQL Server将假定需要使用尽可能多的内存。 这也是最大服务器内存(MB)的默认值。 因此,回到报告中,我们已经获得了将近5 gig od的可用RAM。 更重要的是,在缓冲区管理器计数器下,缓冲区高速缓存命中率几乎达到100%。 现在,这已尽善尽美了,请记住,我们要在这里获得高价值。 懒惰的作家零秒的表现甚至更好。 最后但并非最不重要的一点是,Page Life预期值远高于该系统的基础,这确实不错。 这意味着页面不会从内存中清除掉,因为内存没有被翻转。
These counters are absolutely what you need in a SQL Server monitoring tool and what you want to look at when troubleshooting memory issues because they give us a lot of insight into how SQL Server is using memory.
这些计数器绝对是您在SQL Server监视工具中所需的,以及在排除内存问题时要查看的计数器,因为它们使我们可以深入了解SQL Server如何使用内存。
目录 (Table of contents)
| SQL Server monitoring tools for disk I/O performance |
| SQL Server monitoring tools for memory performance |
| SQL Server monitoring tool for CPU performance |
| 用于磁盘I / O性能SQL Server监视工具 |
| SQL Server内存性能监视工具 |
| 用于CPU性能SQL Server监视工具 |
翻译自: https://www.sqlshack.com/sql-server-monitoring-tools-for-memory-performance/
SQL Server内存性能监视工具相关推荐
- sql server 内存_SQL Server内存性能指标–第1部分–内存页/秒和内存页故障/秒
sql server 内存 SQL Server performance basics article, we explained why performance monitoring was imp ...
- SQL Server内存泄漏
翻译自:https://mssqlwiki.com/2012/12/04/sql-server-memory-leak/ 什么是内存泄漏? 当一个进程分配了内存,它应该回收并释放给操作系统.如果由于代 ...
- SQL Server密码破解工具简介
在对SQL Server系统执行入侵测试或者更高级别的安全审计时,有一种测试不应该被忽略,那就是SQL Server密码测试.这一点看起来显而易见,但是很多人都会忽略它. 密码测试可以帮助检查恶意入侵 ...
- SQL Server密码爆破工具SQLdict
SQL Server密码爆破工具SQLdict SQL Server是Windows系统常用的数据库服务器.它广泛采用用户名和密码方式,进行身份认证.Kali Linux提供一款专用的数据库密码爆破工 ...
- sql server 内存初探
原文:sql server 内存初探 一. 前言 对于sql server 这个产品来说,内存这块是最重要的一个资源, 当我们新建一个会话,相同的sql语句查询第二次查询时间往往会比第一次快,特别是在 ...
- sql server转mysql工具下载_SQL Server转换为MySQL工具推荐(Mss2sql)
SQL Server转换为MySQL工具,用了一下 感觉蛮不错的. 分享上来,同时也以便记录下来以后自用. 工具名称:Mss2sql 来个操作流程: 1.首先下载工具 用户名与密码都是www.linu ...
- MSSQL-Scripter,一个新的生成T-SQL脚本的SQL Server命令行工具
这里向大家介绍一个新的生成T-SQL脚本的SQL Server命令行工具:mssql-scripter.它支持在SQL Server.Azure SQL DB以及Azure SQL DW中为数据库生成 ...
- SQL SERVER 内存分配及常见内存问题(1)——简介
原文:SQL SERVER 内存分配及常见内存问题(1)--简介 一.问题: 1.SQL Server 所占用内存数量从启动以后就不断地增加: 首先,作为成熟的产品,内存溢出的机会微乎其微.对此要了解 ...
- SQL Server 内存泄露(memory leak)——游标导致的内存问题
原文:SQL Server 内存泄露(memory leak)--游标导致的内存问题 转自:http://blogs.msdn.com/b/apgcdsd/archive/2011/07/01/sql ...
最新文章
- AI一分钟 | 阿里联合蚂蚁金服95亿美元收购饿了么;西湖大学正式获批成立
- C#常用正则表达式总结
- java绘图机器猫_用绘图语句画机器猫(初学 C 语言的同学必看)
- insert ... on duplicate key update产生death lock死锁原理
- 某大厂外包员工在工作群抢新年红包,却被要求退回...
- html5视频播放事件相关
- 升级php7_PHP 5.6 已结束安全支持,你升级到 PHP 7 系列了吗?
- pyinstaller 打包出现问题
- Transact-SQL命令语法-数据表
- python脚本批量登录crt_Python实现批量新建SecureCRT Session
- 【三十二】thinkphp之连接数据库、实例化模型
- 23模式之: 迭代器模式demo
- 190106每日一句
- Atitit 如何设置与安放知识的trap陷阱 知识聚合 rss url聚合工具 以及与trap的对比
- linux搭建.net开发环境,ASP.NET Core知多少(5): Linux上搭建.Net Core开发环境
- openGauss数据库日志管理指导
- 云盘万能钥匙插件(无需输入网盘提取密码)
- MySQL连接navicat出现 2059 - authentication plugin ‘caching_sha2_password解决方法
- Java调用regester命令
- 电脑格式化之后如何进行数据恢复【图文教程】
热门文章
- linux中特殊符号分割,Shell_Linux Shell 中实现字符串切割的几种方法
- python画相关系数矩阵图_pyhton中matplotlib箱线图的绘制(matplotlib双轴图、箱线图、散点图以及相关系数矩阵图))...
- python写一个数据库的界面_Python GUI教程(十四):在PyQt5中使用数据库
- 搭建 Kafka 集群 (v2.12-2.3.0)
- Java回文数的判断与生成
- 如何设置 Windows 默认命令行窗口大小和缓冲区大小
- react-router-dom系列之-codesandbox
- 【王道考研计算机网络】—OSI参考模型
- 图解HTTP笔记(二)——HTTP状态码
- vue引入外部文件_vue3+typescript引入外部文件