计算机视觉 图像处理_通过图像处理找到计算机视觉通道
计算机视觉 图像处理
How does coding a Lane finding system in an active video feed sounds? It seemed ubercool to me when I did this project with Udacity back in 2017. At that point, the aim was just to know enough basics and code a system somehow to get to the end result to have a feel of the power of computer vision even if you do not understand the exact details of behind the scenes. However, the main aim of this post is to explain image processing techniques. It is more about the journey than the destination.You might end up with a cool project in the end but there are always some side effects :)
在活动视频源中编码车道发现系统的声音如何? 当我在2017年与Udacity进行此项目时,对我来说似乎很酷。那时,我们的目标只是了解足够的基础知识和编码系统,以某种方式获得最终结果,甚至可以感受到计算机视觉的力量如果您不了解幕后的确切细节。 但是,这篇文章的主要目的是解释图像处理技术。 它更多地是关于旅程而不是目的地。您可能最终会得到一个很棒的项目,但总会有一些副作用:)
The aim is to identify the lane lines in an image and then extend the algorithm to a video to identify the left and right lane lines effectively irrespective of their shape ( solid vs dashed) or colour ( white vs yellow) or slope ( straight or angled or curved). The images/ video used for the project are from a US highway where the lanes are clearly marked and they are mostly straight and not much curved.
目的是识别图像中的车道线,然后将算法扩展到视频,以有效地识别左右车道线,而不管其形状(实线还是虚线),颜色(白线还是黄色)或坡度(直线或成角度)或弯曲)。 该项目使用的图像/视频来自美国高速公路,车道上有清晰的标记,并且大多是笔直的,弯道并不多。
Following features have been used for the identification:
下列功能已用于识别:
1- Colour : Lane lines are generally light coloured (white/ yellow) compared to the road (dark grey). So a black/white image works better as the lanes can easily be distinguished from the background.
1- 颜色 :与道路(深灰色)相比,车道线通常为浅色(白色/黄色)。 因此,黑白图像效果更好,因为可以轻松地将车道与背景区分开。
2- Shape: Lane lines are usually solid or dashed lines which can be used to separate them from other objects in the image. Edge Detection algorithms such as Canny can be used the find all the edges/ lines in the image. Then we can use further information to decide which edges can be qualified as the lane lines.
2- 形状 :车道线通常是实线或虚线,可用于将其与图像中的其他对象分开。 可以使用诸如Canny之类的边缘检测算法来查找图像中的所有边缘/线条。 然后,我们可以使用更多信息来确定哪些边线可以作为车道线。
3- Orientation: Highway Lane lines are more closed to vertical than they are to horizontal. So the slope of the lines detected in an image can be used to check whether it is a possible candidate for the lane or not.
3- 方向 :公路车道线相对于水平方向更靠近垂直方向。 因此,在图像中检测到的线的斜率可用于检查它是否可能是该车道的候选者。
4- Position in Image: In a regular highway image taken by a dash cam mounted looking ahead on the car, Lane lines typically appears in the lower half of the image. So the search area can be narrowed down to the region of interest to reduce any noise.
4- 图像中的位置 :在向前看时在汽车上安装的行车记录仪拍摄的常规高速公路图像中,车道线通常出现在图像的下半部分。 因此,搜索范围可以缩小到感兴趣的区域,以减少任何噪音。
颜色选择 (Colour Selection)
Each image can be thought of made up of different colour channels. In RGB colour scheme, every pixel in the image is made up of values of Red, Green and Blue channels. The value of these vary from 0 to 255 with 0 being the darkest and 255 being the brightest. In this way the colour white is [255, 255, 255] and the black is [0,0,0]. If you take the average of the three and use that for every pixel, the resulting image is grayscale.
可以认为每个图像都由不同的颜色通道组成。 在RGB配色方案中,图像中的每个像素都由红色,绿色和蓝色通道的值组成。 这些值的范围从0到255,其中0是最暗的,而255是最亮的。 这样,白色为[255,255,255],黑色为[0,0,0]。 如果取三者的平均值,然后将其用于每个像素,则所得图像为灰度。
In order to achieve this, I used the following code
为了实现这一点,我使用了以下代码
# Define our color criteriared_threshold = 0green_threshold = 0blue_threshold = 0rgb_threshold = [red_threshold, green_threshold, blue_threshold]Here a colour threshold(rgb_threshold) is defined in the variables red_threshold, green_threshold, and blue_threshold . This vector contains the minimum values for red, green, and blue (R,G,B) that are allowed in the selection and anything above those could be set to zero (blacked out). This helps particularly in the case like this as lane lines are generally in contrast with the road and hence we can set the minimum value.
在此,在变量red_threshold , green_threshold和blue_threshold定义了颜色阈值(rgb_threshold)。 此向量包含选择中允许的红色,绿色和蓝色(R,G,B)的最小值,高于这些值的任何值都可以设置为零(涂黑)。 这在这样的情况下尤其有帮助,因为车道线通常与道路形成对比,因此我们可以设置最小值。
# Mask pixels below the thresholdcolor_thresholds = (image[:,:,0] < rgb_threshold[0]) | \ (image[:,:,1] < rgb_threshold[1]) | \ (image[:,:,2] < rgb_threshold[2])color_select[color_thresholds] = [0,0,0]The result, color_select, is an image in which pixels that were above the threshold have been retained, and pixels below the threshold have been blacked out.
结果color_select是一幅图像,其中保留了阈值以上的像素,而阈值以下的像素已被涂黑。
区域遮罩 (Region Masking)
Next task is region masking. If we assume that the images are coming from dash cam that is mounted in a fixed position on the car, the lane lines would only appear in a certain region in the car. This can be utilised to narrow down the search region. Here we can define a triangle as shown in the figure below and only use the region within that for our search.
下一个任务是区域屏蔽。 如果我们假设图像来自安装在汽车上固定位置的行车记录仪,则车道线只会出现在汽车的某个区域中。 这可以用来缩小搜索范围。 在这里,我们可以定义一个三角形,如下图所示,并且仅使用其中的区域进行搜索。
The variables left_bottom, right_bottom, and apex are used in the code below as the vertices of a triangular region that I would like to retain for my color selection, while masking everything else out. Here, triangular mask is used but in principle, you could use any polygon.
变量left_bottom , right_bottom和apex在下面的代码中用作三角形区域的顶点,在选择其他颜色时,我希望保留这些三角形以进行颜色选择。 在这里,使用了三角形蒙版,但原则上可以使用任何多边形。
Once the masking has been applied, the final image would look like :
应用遮罩后,最终图像将如下所示:
We can combine both the strategies as shown in the code below:
我们可以结合下面的代码所示的两种策略:
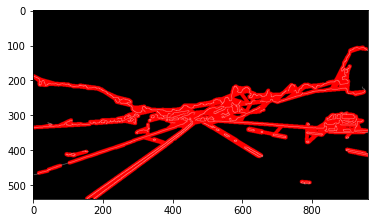
import matplotlib.pyplot as pltimport matplotlib.image as mpimgimport numpy as np# Read in the imageimage = mpimg.imread('test.jpg')# Grab the x and y sizes and make two copies of the image# With one copy we'll extract only the pixels that meet our selection,# then we'll paint those pixels red in the original image to see our selection # overlaid on the original.ysize = image.shape[0]xsize = image.shape[1]color_select= np.copy(image)line_image = np.copy(image)# Define our color criteriared_threshold = 200green_threshold = 200blue_threshold = 200rgb_threshold = [red_threshold, green_threshold, blue_threshold]# Define a triangle region of interest (Note: if you run this code, # Keep in mind the origin (x=0, y=0) is in the upper left in image processing# you'll find these are not sensible values!!# But you'll get a chance to play with them soon in a quiz ;)left_bottom = [0, 539]right_bottom = [900, 300]apex = [400, 0]fit_left = np.polyfit((left_bottom[0], apex[0]), (left_bottom[1], apex[1]), 1)fit_right = np.polyfit((right_bottom[0], apex[0]), (right_bottom[1], apex[1]), 1)fit_bottom = np.polyfit((left_bottom[0], right_bottom[0]), (left_bottom[1], right_bottom[1]), 1)# Mask pixels below the thresholdcolor_thresholds = (image[:,:,0] < rgb_threshold[0]) | \ (image[:,:,1] < rgb_threshold[1]) | \ (image[:,:,2] < rgb_threshold[2])# Find the region inside the linesXX, YY = np.meshgrid(np.arange(0, xsize), np.arange(0, ysize))region_thresholds = (YY > (XX*fit_left[0] + fit_left[1])) & \ (YY > (XX*fit_right[0] + fit_right[1])) & \ (YY < (XX*fit_bottom[0] + fit_bottom[1]))# Mask color selectioncolor_select[color_thresholds] = [0,0,0]# Find where image is both colored right and in the regionline_image[~color_thresholds & region_thresholds] = [255,0,0]# Display our two output imagesplt.imshow(color_select)plt.imshow(line_image)The resulting image after colour and region masking is imposed on the original image to indicate lane lines as :
颜色和区域遮罩后的结果图像被施加到原始图像上,以指示车道线为:

As shown in the figure, the colour detection was able to mark lane lines. However is it still not a great way to find them. It is easier when the lines are of single colour- white on black roads. However many times lines are different colours (yellow, white etc) and they may be solid or dashed. So we would need a more intelligent algorithm to find the lane lines in a video stream which is where edge detection comes in.
如图所示,颜色检测能够标记车道线。 但是,仍然不是找到它们的好方法。 如果线路是黑色道路上的白色,则更容易。 但是,许多时候线是不同的颜色(黄色,白色等),它们可能是实线或虚线。 因此,我们需要一种更智能的算法来查找视频流中的边缘线,这是边缘检测的来源。
坎尼边缘检测 (Canny Edge Detection)
Sometimes in a computer vision project, shape of an object can be utilised for its detection. To determine the shape of the objects in an image, edge detection is required.
有时在计算机视觉项目中,可以利用对象的形状进行检测。 为了确定图像中物体的形状,需要边缘检测。
The Canny edge detector is an edge detection operator that uses a multi-stage algorithm to detect a wide range of edges in images. It was developed by John F. Canny in 1986 — Wikipedia
Canny边缘检测器 是 边缘检测 ,使用一个多级操作 算法 以检测宽范围图像中的边缘。 它是由 John F. Canny 在1986年 开发的 —维基百科
A grayscale image is generally used as it is easier to get to edges. A greyscale image can be imagines as a 2D matrix function with each pixel as a matrix element containing x and y values. Hence we can perform mathematical operations like taking a gradient in x and y directions. An edge is just a rapid change in brightness of the pixel.
通常使用灰度图像,因为它更容易到达边缘。 可以将灰度图像想象为2D矩阵函数,每个像素作为包含x和y值的矩阵元素。 因此,我们可以执行数学运算,例如在x和y方向上取梯度。 边缘只是像素亮度的快速变化。
A gradient in both x and y direction is taken which gives the intensity of the pixel. The gradient often gives thick edges where we then apply threshold to get to actual pixels.
沿x和y方向都采用一个梯度,该梯度给出了像素的强度。 渐变通常会提供较粗的边缘,然后在此处应用阈值以获取实际像素。
The Canny edge detection algorithm is composed of following steps:
Canny边缘检测算法由以下步骤组成:
Noise reduction : Since the mathematics involved in the algorithm are mainly based on derivatives, edge detection results are highly sensitive to image noise. One way to get rid of the noise on the image, is by applying Gaussian blur to smooth it. To do so, image convolution technique is applied with a Gaussian Kernel (3x3, 5x5, 7x7 etc…). The kernel size depends on the expected blurring effect. Basically, the smallest the kernel, the less visible is the blur.
降噪 :由于算法中涉及的数学主要基于导数,因此边缘检测结果对图像噪声非常敏感。 消除图像上噪声的一种方法是应用高斯模糊对其进行平滑处理。 为此,将图像卷积技术应用于高斯核(3x3、5x5、7x7等)。 内核大小取决于预期的模糊效果。 基本上,内核越小,模糊越不明显。
2. Gradient calculation: Smoothened image is then filtered with a Sobel kernel in both horizontal and vertical direction to get first derivative in both directions. From these two images, we can find edge gradient and direction for each pixel as follows:
2.梯度计算:然后使用Sobel核在水平和垂直方向上对平滑图像进行滤波,以在两个方向上获得一阶导数。 从这两张图片中,我们可以找到每个像素的边缘渐变和方向,如下所示:

3. Non-maximum suppression: After getting gradient magnitude and direction, a full scan of image is done to remove any unwanted pixels which may not constitute the edge. For this, at every pixel, pixel is checked if it is a local maximum in its neighborhood in the direction of gradient
3.非最大抑制:获得梯度幅度和方向后,将对图像进行全面扫描,以去除可能不构成边缘的所有不需要的像素。 为此,在每个像素处,检查像素是否是其在梯度方向上附近的局部最大值
4. Edge Tracking by Hysteresis : This stage decides which are all edges are really edges and which are not. For this, we need two threshold values, minVal and maxVal. Any edges with intensity gradient more than maxVal are sure to be edges and those below minVal are sure to be non-edges, so discarded. Those who lie between these two thresholds are classified edges or non-edges based on their connectivity.
4.通过滞后进行边缘跟踪:该阶段确定哪些边缘全部是真正的边缘,哪些不是。 为此,我们需要两个阈值minVal和maxVal。 强度梯度大于maxVal的任何边缘必定是边缘,而小于minVal的那些边缘必定是非边缘,因此将其丢弃。 介于这两个阈值之间的对象根据其连通性被分类为边缘或非边缘。
In openCV, cv2.Canny function can be used to find edges in a grayscale smoothened image. Here is the full code:
在openCV中,可以使用cv2.Canny函数在灰度平滑图像中查找边缘。 这是完整的代码:
# Do relevant importsimport matplotlib.pyplot as pltimport matplotlib.image as mpimgimport numpy as npimport cv2# Read in and grayscale the imageimage = mpimg.imread('solidYellowCurve.jpg')gray = cv2.cvtColor(image,cv2.COLOR_RGB2GRAY)# Define a kernel size and apply Gaussian smoothingkernel_size = 5blur_gray = cv2.GaussianBlur(gray,(kernel_size, kernel_size),0)# Define our parameters for Canny and applylow_threshold = 30high_threshold = 100edges = cv2.Canny(blur_gray, low_threshold, high_threshold)plt.imshow(edges, cmap='Greys_r')The resultant image after edge detection :
边缘检测后得到的图像:
All the edges in the image are visible now but how would you extract lane lines from this edge detected image ? Now that we have all the points that represent the edges, we need something to connect them. This is where Hough Transform comes in.
现在可以看到图像中的所有边缘,但是如何从该边缘检测图像中提取车道线? 现在我们有了代表边缘的所有点,我们需要一些东西来连接它们。 这就是霍夫变换的来历。
霍夫变换 (Hough Transform)
In image space, a line is plotted as x vs. y, but in 1962, Paul Hough devised a method for representing lines in parameter space, which we call “Hough space” in his honour.
在图像空间中,一条线被绘制为x与y的关系,但是在1962年,Paul Hough设计了一种用于表示参数空间中的线的方法,以他的荣誉我们称之为“ Hough空间”。
A lines equation can be represented as y = mx+b where m is the slope and b is the intercept. In Hough space, I can represent my “x vs. y” line as a point in “m vs. b” instead. The Hough Transform is just the conversion from image space to Hough space. So, the characterisation of a line in image space will be a single point at the position (m, b) in Hough space.
线方程可以表示为y = mx + b,其中m是斜率,b是截距。 在霍夫空间中,我可以将“ x vs. y”线表示为“ m vs. b”中的点。 霍夫变换只是从图像空间到霍夫空间的转换。 因此,图像空间中线条的特征将是霍夫空间中位置(m,b)的单点。
A single point in image space has many possible lines that pass through it, but not just any lines, only those with particular combinations of the m and b parameters. Rearranging the equation of a line, we find that a single point (x,y) corresponds to the line b = y — xm. Therefore, a point in image space correspond to in a line in Hough space. And hence, if we plot various possible points in image space and corresponding lines in hough, intersection point of various lines in hough space would represent the line passing through those points in image space. This concept is used to identify various lines in an image.
图像空间中的单个点有许多可能通过的线,但不仅仅是任何线,只有那些具有m和b参数的特定组合的线。 重新排列直线方程,我们发现单点(x,y)对应于直线b = y — xm。 因此,图像空间中的点对应于霍夫空间中的线。 因此,如果我们在图像空间中绘制各种可能的点,并在hough中绘制相应的线,则hough空间中各种线的交点将代表穿过图像空间中那些点的线。 此概念用于识别图像中的各种线条。
Now using this cartesian coordinate representation of lines might pose issues in cases where the lines are vertical as the slope is than infinity. To remove this anomaly, polar coordinates are used.
现在,使用直线的直角坐标表示时,如果直线是垂直的(坡度比无穷大),可能会出现问题。 要消除此异常,请使用极坐标。
To apply Hough Transform in OpenCV, a function called HoughLinesP is used that takes several parameters.
为了在OpenCV中应用霍夫变换,使用了一个名为HoughLinesP的函数,该函数需要多个参数。
lines = cv2.HoughLinesP(masked_edges, rho, theta, threshold, np.array([]), min_line_length, max_line_gap)
lines = cv2.HoughLinesP(masked_edges, rho, theta, threshold, np.array([]), min_line_length, max_line_gap)
In this case, we are operating on the image masked_edges (the output from Canny) and the output from HoughLinesP will be lines, which will simply be an array containing the endpoints (x1, y1, x2, y2) of all line segments detected by the transform operation. The other parameters define just what kind of line segments we're looking for.
在这种情况下,我们在图像操作masked_edges (从输出Canny ),并从输出HoughLinesP将是lines ,这将简单地是包含所有线段所检测的端点(X1,Y1,X2,Y2)的阵列转换操作。 其他参数仅定义我们要查找的线段。
First off, rho and theta are the distance and angular resolution of our grid in Hough space. You need to specify rho in units of pixels and theta in units of radians.
首先, rho和theta是霍夫空间中网格的距离和角分辨率。 您需要以像素为单位指定rho ,以弧度为单位指定theta 。
The threshold parameter specifies the minimum number of votes (intersections in a given grid cell) a candidate line needs to have to make it into the output. The empty np.array([]) is just a placeholder, no need to change it. min_line_length is the minimum length of a line (in pixels) that you will accept in the output, and max_line_gap is the maximum distance (again, in pixels) between segments that you will allow to be connected into a single line. You can then iterate through your output lines and draw them onto the image to see what you got!
threshold参数指定候选行使其进入输出所需的最小投票数(给定网格单元中的交叉点)。 空的np.array([])只是一个占位符,无需更改它。 min_line_length是您将在输出中接受的一条线的最小长度(以像素为单位), max_line_gap是您将允许连接成一条线的线段之间的最大距离(再次以像素为单位)。 然后,您可以遍历输出lines并将它们绘制到图像上,以查看得到的结果!
Here is the final code:
这是最终代码:
# Do relevant importsimport matplotlib.pyplot as pltimport matplotlib.image as mpimgimport numpy as npimport cv2# Read in and grayscale the imageimage = mpimg.imread('exit-ramp.jpg')gray = cv2.cvtColor(image,cv2.COLOR_RGB2GRAY)# Define a kernel size and apply Gaussian smoothingkernel_size = 5blur_gray = cv2.GaussianBlur(gray,(kernel_size, kernel_size),0)# Define our parameters for Canny and applylow_threshold = 50high_threshold = 150masked_edges = cv2.Canny(blur_gray, low_threshold, high_threshold)# Define the Hough transform parameters# Make a blank the same size as our image to draw onrho = 1theta = np.pi/180threshold = 10min_line_length = 20max_line_gap = 30line_image = np.copy(image)*0 #creating a blank to draw lines on# Run Hough on edge detected imagelines = cv2.HoughLinesP(masked_edges, rho, theta, threshold, np.array([]), min_line_length, max_line_gap)# Iterate over the output "lines" and draw lines on the blankfor line in lines:for x1,y1,x2,y2 in line: cv2.line(line_image,(x1,y1),(x2,y2),(255,0,0),10)# Create a "color" binary image to combine with line imagecolor_edges = np.dstack((masked_edges, masked_edges, masked_edges)) # Draw the lines on the edge imagecombo = cv2.addWeighted(color_edges, 0.8, line_image, 1, 0) plt.imshow(combo)The resulting image after applying Canny edge detection and hough transform :
应用Canny边缘检测和霍夫变换后得到的图像:
放在一起 (Putting Everything Together)
Now all these concepts are utilised to identify the lane lines in the video. The pipeline used the following steps to mark the lane lines:
现在,所有这些概念都被用来识别视频中的车道线。 管道使用以下步骤标记车道线:
1- Converting the image to grayscale: Image is converted to grayscale by using OpenCV function cv2.cvtColor (). This made it easier to identify lanes and also helped with the next step of edge detection. Gausssian Blur is applied to average out the cell values in order to reduce noise before taking gradient.
1- 将图像转换为灰度:使用OpenCV函数cv2.cvtColor() 将图像转换为灰度。 这样可以更轻松地识别车道,并有助于下一步的边缘检测。 高斯模糊应用于对像元值进行平均,以便在进行渐变之前降低噪声。
2- Canny Edge Detection: Next the gradient of the image is taken to compute the boundaries or edges of the objects in an image. cv2.Canny(blur_gray, low_threshold, high_threshold) is the function used to perform canny edge detection where low and high thresholds are the thresholds for how strong an edge should be in order to be detected. We have used the values as low_threshold = 50 high_threshold = 150
2- Canny Edge Detection :接下来,采用图像的梯度来计算图像中对象的边界或边缘。 cv2.Canny(blur_gray,low_threshold,high_threshold)是用于执行精巧边缘检测的函数,其中低阈值和高阈值是为了检测边缘应具有的强度阈值。 我们使用的值为low_threshold = 50 high_threshold = 150
3- Region of interest: Next a four sided polygon is defined to mask the region of interest. As mentioned before, the parts of the image where lane lines can be found are identified which in our case was a polygon in lower half of image and the other regions of the image are masked to limit our search within that area.
3- 感兴趣区域 :接下来,定义一个四边形多边形以遮盖感兴趣区域。 如前所述,确定了可以找到车道线的图像部分,在我们的情况下,该部分是图像下半部分的多边形,而图像的其他区域则被遮罩以限制我们在该区域内的搜索。
4- Hough Transform: Once the edge pixels are detected in an image, hough transform is applied to connect these edge pixels to form lane lines. cv2.HoughLinesP is the function used which takes input image from Canny and a few other parameters in order to define the lane lines. The output from Hough Transform contains all the lane lines (solid/dashed). Next step is to find a common average line to smoothen them
4- Hough变换 :一旦在图像中检测到边缘像素,就应用霍夫变换将这些边缘像素连接起来以形成车道线。 cv2.HoughLinesP是用于从Canny和其他一些参数获取输入图像以定义车道线的函数。 Hough变换的输出包含所有车道线(实线/虚线)。 下一步是找到一条平均线以平滑它们
5- Finding average equation of line and smoothing: Once the lines are identified in the image, they are passed on to draw_lines(line_img, lines) function which finds the average equation of the line. It divides the left and right lane line by calculating slope. Negative values correspond to right positive to the left (based on image coordinates).
5- 查找直线和平滑的平均方程式 :一旦在图像中识别出直线,它们就会传递给draw_lines(line_img,lines)函数,该函数会找到直线的平均方程式。 通过计算斜率来划分左右车道线。 负值对应于从右到右(基于图像坐标)。
Once you have separate left and right lines, the slopes and intercepts for each left/right lines are averaged out by accumulating all the points in each left/ right and finding an average fit through them.
一旦您有了左右两边的线,就可以通过累加每个左/右点的所有点并找到它们的平均拟合度来平均每条左/右线的斜率和截距。
6- Extrapolation: Once you have average left /right line, they are extrapolated to generate a common solid average lane line. Once the pipeline starts working on the test images. The same is done for each frame of the video to generate the lane lines for the whole video.
6- 外推法 :一旦您获得了平均左/右线,就将它们外推以生成一条普通的实线平均车道线。 一旦管道开始处理测试图像。 对视频的每一帧都执行相同的操作,以生成整个视频的车道线。
The final pipeline was able to find the lane lines in the videos even when the lane lines are of different colours (yellow, white) and different shapes (solid, dashed etc).
即使车道线具有不同的颜色(黄色,白色)和不同的形状(实线,虚线等),最终的管道也能够在视频中找到车道线。
演示地址
Even though the code worked well when the lines were straight, it did not work well when the lines were more curved and we are fitting straight lines in the equation. Also, when there is varied lighting the algorithm finds it hard to detect lane. Possible Improvements include use of second degree polynomial in order to account for the curved lane and use of different lane identification techniques in order to be more accurate.
即使在直线的情况下代码运行良好,但在曲线更弯曲的情况下代码却无法正常工作,因此我们在方程中拟合了直线。 同样,当照明变化时,算法很难检测到车道。 可能的改进包括使用二阶多项式以解决弯道,并使用不同的车道识别技术以提高准确性。
演示地址
Final code for the project can be found at my github repo
该项目的最终代码可以在我的github仓库中找到
Written while listening to Prateek Kuhad
在听 Prateek Kuhad的 同时写
翻译自: https://medium.com/swlh/computer-vision-lane-finding-through-image-processing-516797e59714
计算机视觉 图像处理
http://www.taodudu.cc/news/show-4280913.html
相关文章:
- ui界面颜色设计_界面设计ui的颜色基础
- 双阈值检测阈值选择_通过阈值进行计算机视觉高级车道检测
- evm?衡そΑ_RGB? CMYK? Α? 什么是图像通道,它们是什么意思?
- CSS3 SVG波浪线条动画js特效
- canvas画圆和线条动画
- android酷炫转圈动画,android常用旋转线条加载动画
- CSS3实现边框线条动画特效
- css3直线运动_css3动画--边框线条动画
- 输入框线条动画
- android svg 线条动画教程,简单的SVG线条动画
- java runtime是什么软件_Java SE Runtime Environment (JRE) 运行Java程序的必备软件
- 图解HHTPS原理
- Java SE Development Kit (JDK) 安装
- SAP修改消息内容和报错类型(OBA5,SE91)
- Selenium基于Python的web自动化测试框架(1)-环境搭建
- PHP 输出各个时区对应的时差表
- java时间戳 时间格式转换与时差
- C# 操作MongoDB时间 时差问题
- 移动通信网认证协议,安全
- CDMA移动通信网的关键技术(转)
- 移动通信网络规划:频谱划分
- 4字节 经纬度_北京54坐标系转经纬度坐标系教程
- Android 高德地图(带有定位和点击显示经度纬度)
- mysql 单精度和双经度_mysql 下 计算 两点 经纬度 之间的距离 计算结果排序
- C++ 高级程序设计
- 南京邮电大学高级语言程序设计实验五(指针与字符串实验)
- c语言高级程序知识,《高级语言程序设计》知识点总结(一)
- SCAU高级语言程序设计OJ
- 卸载应用后,删除安装根目录下的所有文件,提示已在另一进程打开,在资源管理器进程中找不到该程序的解决
- 解决火绒提示helper_haozip.exe文件是病毒威胁
计算机视觉 图像处理_通过图像处理找到计算机视觉通道相关推荐
- 什么叫做形态学图像处理_形态学图像处理
形态学,即数学形态学(mathematical Morphology),是图像处理中应用最为广泛的技术之一,主要用于从图像中提取对表达和描绘区域形状有意义的图像分量,使后续的识别工作能够抓住目标对象最 ...
- 什么叫做形态学图像处理_数字图像处理在二值形态学及其灰度形态学方面的应用.ppt...
您所在位置:网站首页 > 海量文档  > 计算机 > 图形图像 数字图像处理在二值形态学及其灰度形态学方面的应用.pp ...
- python与医学图像处理_医学图像处理与深度学习(一)
从本文开始,作者将开始介绍图像处理的基础知识,基本的医学图像数据,并且对这些数据进行可视化处理. 利用深度学习技术,分析图像与视频,并且将之应用在诸如自动驾驶,无人机等等领域已经成为最新研究方向.在最 ...
- 三维图像处理_【图像处理】用于三维物体检测的三维骨干网络
用于三维物体检测的三维骨干网络 题目: 3D Backbone Network for 3D Object Detection 作者: Xuesong Li,Jose E Guivant,Ngaimi ...
- 三维图像处理_医学图像处理案例(六)——生成血管三维模型
在前面的文章中,已经分享了人体肋骨和肺组织分割生成三维模型的例子.今天将继续分享人体脑部血管分割并生成三维模型的案例. 1.导入MRA图像 大家肯定对MRI概念是很清楚的,但是对于MRA可能不太了解. ...
- 浅谈计算机视觉、机器视觉、图像处理
图像处理与计算机视觉是计算机科学的一个分支,而机器视觉是系统工程的一个特殊领域,属于多 学科交叉应用.它们在理论上存在一定的交叉重叠,但各自关注的侧重点不同. [图像处理] (数字图像一般指数字图像处 ...
- 入门理解计算机视觉、图形学、图像处理
入门理解计算机视觉.图形学.图像处理 2019年后工作开始了,对于新的技术要求,盲目学习一阵子,发现还是得自己理清思路. 搞了opencv一段时间,还是对这些概念比较模糊,经过一些博客和知乎的帖子,别 ...
- 图像处理、计算机图形学、计算机视觉和模式识别领域的区别和联系
(本文针对论坛多个人的说法,自己整理了一下,恳请大家批评指教.) 一.区别 1.数字图像处理(Digital Image Processing) 数字图像处理是对已有的图像进行变换.分析.重构,得到的 ...
- 广州大学计算机视觉实验一:图像处理入门
相关资料 广州大学计算机视觉实验一:图像处理入门 广州大学计算机视觉实验二:摄像机几何 广州大学计算机视觉实验三:图像滤波 广州大学计算机视觉实验四:图像分割 广州大学计算机视觉实验五:简易数字识别 ...
最新文章
- linux命令查看几位,Linux每周几个命令(一)--查找篇
- asp建站系统源码_【服务器安全】windows系统安全注意事项
- c语言case后面多字符,多SWITCH-CASE结构时的C语言对象方式化解
- delphi中richedit中光标如何定位到最后_嵌入式开发之Linux系统中Vi编辑器的使用
- OJ1010: 求圆的周长和面积
- Linux磁盘阵列技术详解(三)--raid 5和raid 10的创建 推荐
- [论文阅读] Stereoscopically Attentive Multi-scale Network for Lightweight Salient Object Detection
- C++之父访谈录:我也没想到 C ++ 会这么成功!
- 拍照比剪刀手泄露指纹信息;国内绿 iPhone11 抢断货;PostgreSQL 12 Beta 4 发布 | 极客头条...
- 对Moss 2007中访问群体的设置和使用补充
- XML通过XSL格式化的那点事(XML到自定义节点折叠显示)
- 算法----(3)选择排序
- 搭建邮件系统,采用sendmail+dovecot+openwebmail架构
- YAML_06 playbook从上往下顺序执行,若报错,不提示,继续往下执行
- cad.net 在cad2008引用了错误的com接口的dll导致出现了
- 给出汉字‘你’、‘我’、‘他’在Unicode表中的位置
- 计算机应用基础试题及答案东师,计算机应用基础试题及答案东师
- 【Zeekr_Tech】初谈我们共同的目标 NPDS + Agile
- 导向滤波算法原理与代码
- 让51单片机进行上网