python pca主成分_超越“经典” PCA:功能主成分分析(FPCA)应用于使用Python的时间序列...
python pca主成分
FPCA is traditionally implemented with R but the “FDASRSF” package from J. Derek Tucker will achieve similar (and even greater) results in Python.
FPCA传统上是使用R实现的,但是J. Derek Tucker的“ FDASRSF ”软件包将在Python中获得相似(甚至更高)的结果。
If you have reached this page, you are probably familiar with PCA.
如果您已到达此页面,则可能熟悉PCA。
Principal Components Analysis is part of the Data Science exploration toolkit as it provides many benefits: reducing dimensions of a large dataset, preventing multi-collinearity, etc.
主成分分析是数据科学探索工具包的一部分,因为它具有许多优点:减少大型数据集的维数,防止多重共线性等。
There are many articles out there that explain the benefits of PCA and, if needed, I suggest you to have a look at this one which summarizes my understanding of this methodology:
那里有很多文章解释了PCA的好处,如果需要的话,我建议您看一下这篇文章,总结一下我对这种方法的理解:
“功能性” PCA背后的直觉 (The intuition behind the “Functional” PCA)
In a standard PCA process, we define Eigenvectors to convert the original dataset into a smaller one with fewer dimensions and for which most of the initial dataset variance is preserved (usually 90 or 95%).
在标准PCA流程中,我们定义特征向量以将原始数据集转换为尺寸较小的较小数据集,并为此保留了大部分初始数据集差异(通常为90%或95%)。

Now let’s imagine that the patterns of the time-series have more importance than their absolute variance. For example, you would like to compare physical phenomena such as signals, temperatures’ variation, production batches, etc.. Functional Principal Components Analysis will act this way by determining the corresponding underlying functions!
现在,让我们想象一下时间序列的模式比其绝对方差更重要。 例如,您想比较诸如信号,温度变化,生产批次等物理现象。功能主成分分析将通过确定相应的基础功能来执行此操作!

Let’s take the example of the temperatures’ variation over a year across different locations in a four-seasons country: we can assume that there is a global trend from cold in winter to hot during summertime.
让我们以一个四个季节的国家中不同位置一年中温度的变化为例:我们可以假设存在从冬季寒冷到夏季炎热的全球趋势。
We can also assume that the regions close to the ocean will follow a different pattern than the ones close to mountains (i.e.: smoother temperature variations on the sea-side Vs extremely low temperatures during winter in the mountains).
我们还可以假设,靠近海洋的地区将遵循与靠近山脉的地区不同的模式(即:海边的温度变化更为平稳,而山区冬季的极端低温则相对较低)。

We will now use this methodology to identify such differences between French regions in 2019. This example is directly inspired by the traditional “Canadian weather” FPCA example developed in R.
现在,我们将使用此方法来确定2019年法国各地区之间的差异。此示例直接受到R中开发的传统“加拿大天气” FPCA示例的启发。
2019年按地区划分的法国温度数据集 (Dataset creation with French temperatures by regions in 2019)
We start by getting daily temperature records since 2018 in France by regions* and prepare the corresponding dataset.
我们首先获取自2018年以来法国各地区的每日温度记录*,并准备相应的数据集。
(*the temperatures are recorded at the “department” level, which is a smaller scale than regions in France (96 departments Vs 13 regions). However, we rename “Department” into “Region” for an easier understanding of readers.)
(*温度记录在“部门”级别,该范围比法国的区域小(96个部门对13个区域)。但是,我们将“部门”重命名为“区域”,以便于读者理解。)
We select 7 regions spread across France that correspond to different weather patterns (they will be disclosed later on): 06, 25, 59, 62, 83, 85, 75.
我们选择了分布在法国的7个区域,分别对应不同的天气模式(稍后将进行披露):06、25、59、62、83、85、75。
import pandas as pd
import numpy as np# Import the CSV file with only useful columns
# source: https://www.data.gouv.fr/fr/datasets/temperature-quotidienne-departementale-depuis-janvier-2018/
df = pd.read_csv("temperature-quotidienne-departementale.csv", sep=";", usecols=[0,1,4])# Rename columns to simplify syntax
df = df.rename(columns={"Code INSEE département": "Region", "TMax (°C)": "Temp"})# Select 2019 records only
df = df[(df["Date"]>="2019-01-01") & (df["Date"]<="2019-12-31")]# Pivot table to get "Date" as index and regions as columns
df = df.pivot(index='Date', columns='Region', values='Temp')# Select a set of regions across France
df = df[["06","25","59","62","83","85","75"]]display(df)# Convert the Pandas dataframe to a Numpy array with time-series only
f = df.to_numpy().astype(float)# Create a float vector between 0 and 1 for time index
time = np.linspace(0,1,len(f))
FDASRSF软件包在数据集上的安装和使用 (FDASRSF package installation and use on the dataset)
To install the FDASRSF package in your current environment, you simply need to run:
要在当前环境中安装FDASRSF软件包,您只需要运行:
pip install fdasrsf(note: based on my experience, you might need to install manually one or two additional packages to complete the installation properly. You just need to check the anaconda logs in case of failure to identify them.)
(注意:根据我的经验,您可能需要手动安装一个或两个其他软件包才能正确完成安装。您只需检查anaconda日志以防无法识别它们。)
The FDASRSF package from J. Derek Tucker provides a number of interesting functions and we will use two of them: Functional Alignment and Functional Principal Components Analysis (see corresponding documentation below):
J. Derek Tucker的FDASRSF软件包提供了许多有趣的功能,我们将使用其中两个功能 : 功能对齐和功能主成分分析 (请参见下面的相应文档) :
Functional Alignment will synchronize time-series in case they are not perfectly aligned. The illustration below provides a relatively simple example to understand this mechanism. The time-series are processed from both phase and amplitude’s perspectives (aka x and y axis).
如果它们未完全对齐, 功能对齐将同步时间序列。 下图提供了一个相对简单的示例来了解此机制。 从相位和幅度的角度(也称为x和y轴)角度处理时间序列。

To understand more precisely the algorithms involved, I highly recommend you to have a look at “Generative models for functional data using phase and amplitude separation” from J. Derek Tucker, Wei Wu, and Anuj Srivastava.
为了更精确地理解所涉及的算法,我强烈建议您看一下J. Derek Tucker,Wei Wu和Anuj Srivastava的“ 使用相位和幅度分离的功能数据生成模型 ”。
Even though this is quite hard to notice by simply looking at the Original and Warped Data, we can observe that the Warping functions do have some small inflections (see the yellow curve slightly lagging below the x=y axis), which means than these functions have synchronized the time series when needed. (As you might have guessed, temperature records are — by design — well aligned since they are captured simultaneously.)
尽管仅通过查看原始数据和变形数据很难注意到这一点,但我们可以观察到变形函数确实有一些小变形(请参见黄色曲线略微滞后于x = y轴),这意味着这些函数比在需要时已同步时间序列。 (您可能已经猜到,温度记录在设计上是一致的,因为它们是同时捕获的。)


Functional Principal Components Analysis
功能主成分分析
Now that our dataset is “warped”, we can run a Functional Principal Components Analysis. The FDASRSF package allows horizontal, vertical, or joint analysis. We will use the vertical one and plot the corresponding functions and coefficients for PC1 & PC2.
现在我们的数据集已经“扭曲”了,我们可以运行功能主成分分析了。 FDASRSF软件包允许进行水平,垂直或联合分析。 我们将使用垂直的一个,并绘制PC1和PC2的相应函数和系数。
from fdasrsf import fPCA, time_warping, fdawarp, fdahpca# Functional Alignment
# Align time-series
warp_f = time_warping.fdawarp(f, time)
warp_f.srsf_align()warp_f.plot()# Functional Principal Components Analysis# Define the FPCA as a vertical analysis
fPCA_analysis = fPCA.fdavpca(warp_f)# Run the FPCA on a 3 components basis
fPCA_analysis.calc_fpca(no=3)
fPCA_analysis.plot()import plotly.graph_objects as go# Plot of the 3 functions
fig = go.Figure()# Add traces
fig.add_trace(go.Scatter(y=fPCA_analysis.f_pca[:,0,0], mode='lines', name="PC1"))
fig.add_trace(go.Scatter(y=fPCA_analysis.f_pca[:,0,1], mode='lines', name="PC2"))
fig.add_trace(go.Scatter(y=fPCA_analysis.f_pca[:,0,2], mode='lines', name="PC3"))fig.update_layout(title_text='<b>Principal Components Analysis Functions</b>', title_x=0.5,
)fig.show()# Coefficients of PCs against regions
fPCA_coef = fPCA_analysis.coef# Plot of PCs against regions
fig = go.Figure(data=go.Scatter(x=fPCA_coef[:,0], y=fPCA_coef[:,1], mode='markers+text', text=df.columns))fig.update_traces(textposition='top center')fig.update_layout(autosize=False,width=800,height=700,title_text='<b>Function Principal Components Analysis on 2018 French Temperatures</b>', title_x=0.5,xaxis_title="PC1",yaxis_title="PC2",
)
fig.show()

Now we can add the different weather patterns on the plot, according to the weathers observed in France:
现在,根据法国观察到的天气,我们可以在地块上添加不同的天气模式:

很容易看出聚类与法国观测到的天气的吻合程度。 (It is easy to see how well the clustering fits with the observed weathers in France.)
It is also important to mention that I have chosen the departments arbitrarily according to the places where I live, work and travel frequently but they have not been selected because they were providing good results for this demo. I would expect the same quality of results with other regions.
还要提一提的是,我根据我经常居住,工作和旅行的地点随意选择了部门,但由于他们在此演示中提供了良好的结果,因此未选择这些部门。 我希望结果与其他地区的质量相同。
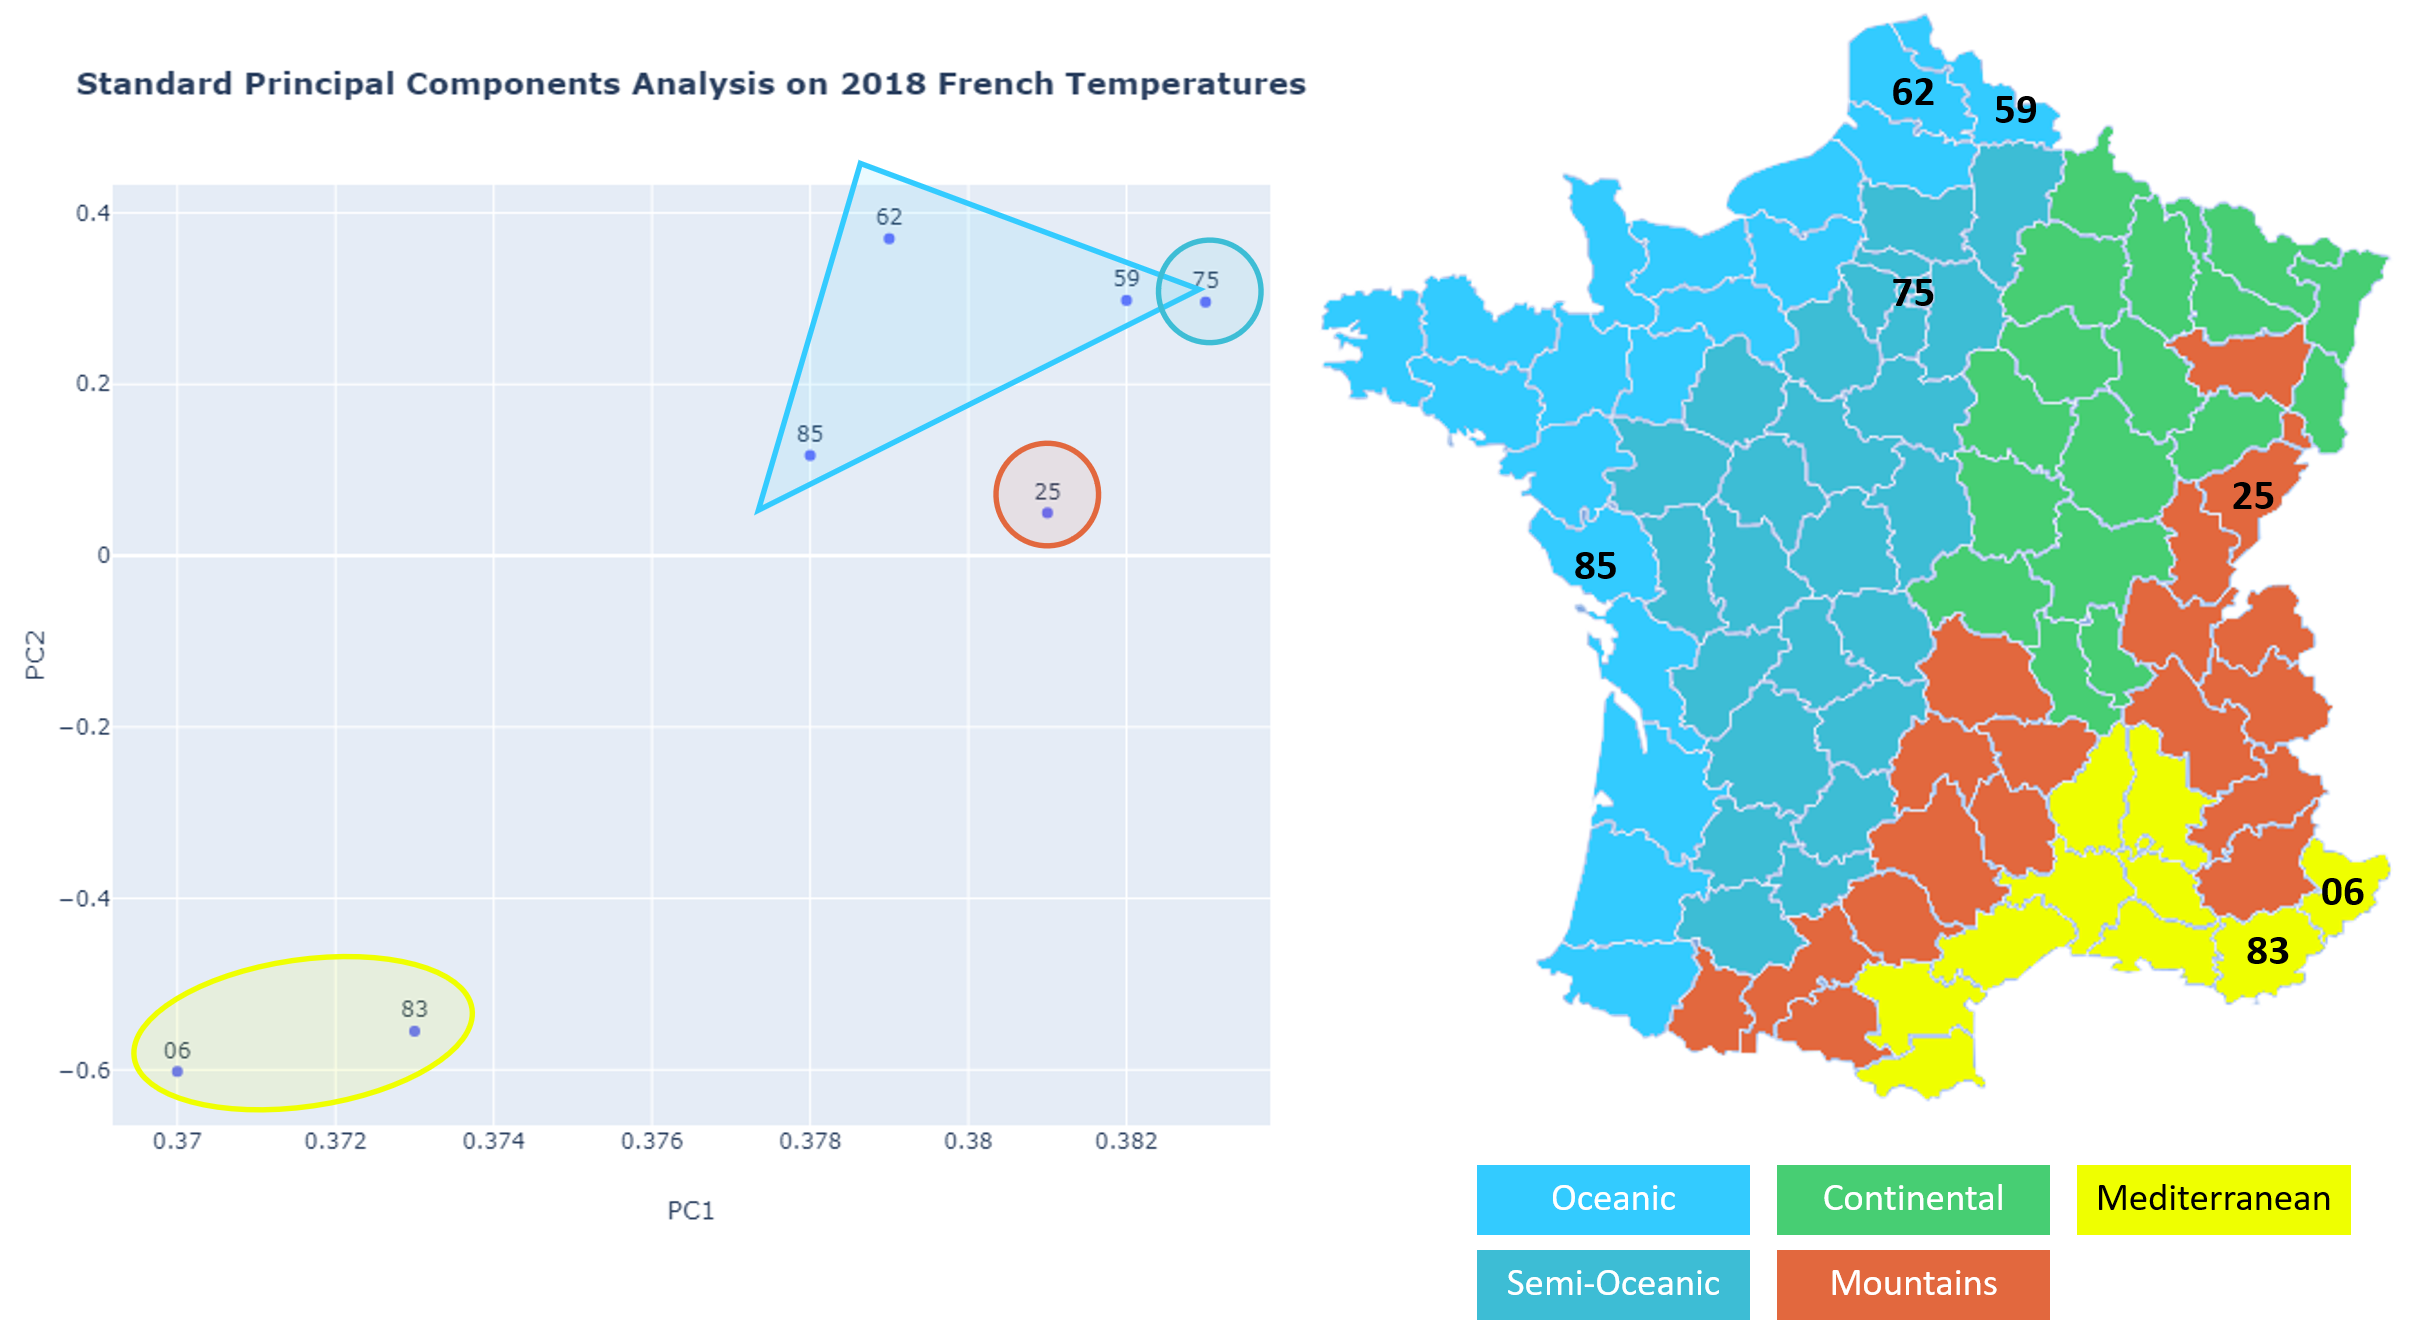
Maybe you are wondering if a standard PCA would also provide an interesting result?
也许您想知道标准PCA是否还会提供有趣的结果?
The plot here-below of standard PC1 and PC2 extracted from the original dataset shows that it is not performing as well as FPCA:
以下是从原始数据集中提取的标准PC1和PC2的图,显示其性能不如FPCA:
I hope this article has provided a better understanding of the Functional Principal Components Analysis to you.
希望本文为您提供了对功能主成分分析的更好理解。
I would also like to warmly thank J. Derek Tucker who has been kind enough to patiently guide me through the use of the FDASRSF package.
我还要衷心感谢J. Derek Tucker,他很友好地耐心指导我使用FDASRSF软件包。
The complete notebook is stored here.
完整的笔记本存储在此处 。
Here are some other articles you might like as well:
以下是您可能还会喜欢的其他一些文章:
翻译自: https://towardsdatascience.com/beyond-classic-pca-functional-principal-components-analysis-fpca-applied-to-time-series-with-python-914c058f47a0
python pca主成分
http://www.taodudu.cc/news/show-997452.html
相关文章:
- 大数据平台构建_如何像产品一样构建数据平台
- 时间序列预测 时间因果建模_时间序列建模以预测投资基金的回报
- 贝塞尔修正_贝塞尔修正背后的推理:n-1
- php amazon-s3_推荐亚马逊电影-一种协作方法
- 简述yolo1-yolo3_使用YOLO框架进行对象检测的综合指南-第一部分
- 数据库:存储过程_数据科学过程:摘要
- cnn对网络数据预处理_CNN中的数据预处理和网络构建
- 消解原理推理_什么是推理统计中的Z检验及其工作原理?
- 大学生信息安全_给大学生的信息
- 特斯拉最安全的车_特斯拉现在是最受欢迎的租车选择
- ml dl el学习_DeepChem —在生命科学和化学信息学中使用ML和DL的框架
- 用户参与度与活跃度的区别_用户参与度突然下降
- 数据草拟:使您的团队热爱数据的研讨会
- c++ 时间序列工具包_我的时间序列工具包
- adobe 书签怎么设置_让我们设置一些规则…没有Adobe Analytics处理规则
- 分类预测回归预测_我们应该如何汇总分类预测?
- 神经网络推理_分析神经网络推理性能的新工具
- 27个机器学习图表翻译_使用机器学习的信息图表信息组织
- 面向Tableau开发人员的Python简要介绍(第4部分)
- 探索感染了COVID-19的动物的数据
- 已知两点坐标拾取怎么操作_已知的操作员学习-第4部分
- lime 模型_使用LIME的糖尿病预测模型解释— OneZeroBlog
- 永无止境_永无止境地死:
- 吴恩达神经网络1-2-2_图神经网络进行药物发现-第1部分
- python 数据框缺失值_Python:处理数据框中的缺失值
- 外星人图像和外星人太空船_卫星图像:来自太空的见解
- 棒棒糖 宏_棒棒糖图表
- nlp自然语言处理_不要被NLP Research淹没
- 时间序列预测 预测时间段_应用时间序列预测:美国住宅
- 经验主义 保守主义_为什么我们需要行动主义-始终如此。
python pca主成分_超越“经典” PCA:功能主成分分析(FPCA)应用于使用Python的时间序列...相关推荐
- 【机器学习】PCA主成分项目实战:MNIST手写数据集分类
PCA主成分项目实战:MNIST手写数据集分类 PCA处理手写数字集 1 模块加载与数据导入 2 模型创建与应用 手动反爬虫:原博地址 https://blog.csdn.net/lys_828/ar ...
- python大型项目经验_经验丰富程序员才知道的8种高级Python技巧
全文共2330字,预计学习时长11分钟 图源:unsplash 本文将介绍8个简洁的Python技巧,若非经验十足的程序员,你肯定有些从未见过.向着更简洁更高效,出发吧! 1.通过多个键值将对象进行排 ...
- 【Python】Matplotlib 可视化进阶之PCA主成分分布图
这乍是一个简单的散点图,有两个主轴,显示一些高斯数据.并且在图中添加了一个垂直于第一个主成分轴的直方图,以显示主成份轴上的分布.这个图可能看起来很简单(散点图和有方向的直方图),其实不然,绘制这样的图 ...
- pca 主成分分析_超越普通PCA:非线性主成分分析
pca 主成分分析 TL;DR: PCA cannot handle categorical variables because it makes linear assumptions about t ...
- matlab mysvd代码解释,关于使用SVD进行PCA主成分提取的代码问题!也是必须涉及到原理的!...
如标题所示,目的是将矩阵进行PCA分析最终得到降维后的新主成分,对于特征值特征向量的提取方法是通过svd.代码和函数名称定义如下/如图所示 function [Xm,U,L]=pca(X,K); % ...
- matlab pca svd,关于使用SVD进行PCA主成分提取的代码问题!也是必须涉及到原理的!...
如标题所示,目的是将矩阵进行PCA分析最终得到降维后的新主成分,对于特征值特征向量的提取方法是通过svd.代码和函数名称定义如下/如图所示 function [Xm,U,L]=pca(X,K); % ...
- python dict批量选择_这一定是你见过最全面的python重点
由于总结了太多的东西,所以篇幅有点长,这也是我"缝缝补补"总结了好久的东西. Py2 VS Py3 print成为了函数,python2是关键字 不再有unicode对象,默认st ...
- python批量检索文献_快解锁新姿势,教你如何用Python搞定文献搜索和科研图片!...
相比实验论文,发表SCI应该更让科研狗们重视和焦虑. 起初看到读博的同学发表SCI论文,心里面就已经酸了,后来「本科生发数篇 SCI」的新闻屡见不鲜,现在甚至连小学生都跑出来分一杯羹-- 前段时间,B ...
- 主成分分析;主成分回归分析——Hald水泥问题;主成分分析案例——各地区普通高等教育发展水平综合评价;matlab
目的 对原变量加以"改造",在不致损失原变量太多信息的条件下尽可能地降低变量地维数,即用较少的"新变量"代替原来地各变量. 通过变换:用低维(主成分)近似高维( ...
最新文章
- 阿里巴巴Web前端面试的一道JS题目,求解答!!!
- 基于TableStore的数据采集分析系统介绍
- quartus编译错误不支持芯片_硒鼓粉盒芯片不识别、耗材佘量错误、打印机亮红灯问题解决方法...
- A Scala Tutorial for Java Programmers
- php连接oracle
- WPF 透明窗口在桌面上放虫子。。。
- 掌握了Docker Layer Caching才敢自称精通Dockerfile
- 计算机基础知识excle,职称计算机基础知识:Excel工作表的复制
- geolocation/ 百度地图api Geolocation 定位当前城市信息
- sql server无法绑定由多个部分组成的标识符_HTML5服务器推送事件(Server-sent-event)...
- 算捡漏么?我发现了一个值2万美金的 Facebook DOM XSS 漏洞
- java中的变量是原子的_Java原子变量
- xml提交数据的方法--gin
- 计算机编辑作业之目录制作,大学计算机ppt作业
- html实心圆点特殊符号,和平精英名称添加圆点符号的方法 和平精英圆点符号代码分享...
- 三亚适合几月份去玩 三亚必去的地方是哪里
- python 管道游戏_用python写游戏之 Flappy Bird
- mfc中插入PNG透明图片
- (c++)求平均成绩和优秀率
- 要闻君说:必应(Bing)搜索引擎已在国内被屏蔽;Verizon媒体业务宣布裁员7%;小米率先发布折叠屏手机...