机器学习 线性回归算法_探索机器学习算法简单线性回归
机器学习 线性回归算法
As we dive into the world of Machine Learning and Data Science, one of the easiest and fun ways is to explore the various machine learning algorithms. They can be intimidating, especially if you’re just starting out. One of the simplest algorithms that we can explore with very basic knowledge of data science is the Linear Regression algorithm.
当我们深入研究机器学习和数据科学的世界时,最简单有趣的方法之一就是探索各种机器学习算法。 它们可能令人生畏,尤其是如果您刚开始。 我们可以利用数据科学的基础知识探索的最简单的算法之一就是线性回归算法。
关于线性回归 (About Linear Regression)
Linear Regression is mainly used in predicting continuous values. We deal with 2 kinds of variables:
线性回归主要用于预测连续值。 我们处理两种变量:
Independent Variables: The variables whose values are not affected by any other variables in our dataset. Like the age of a person or the gender of an individual.
自变量:其值不受数据集中任何其他变量影响的变量。 就像一个人的年龄或一个人的性别。
Dependent Variables: If the value of a variable is influenced by the value of one or more variables, then that variable is a dependent variable. For example, the designation of a person will influence his/her salary, or the number of bedrooms in a house will influence the cost of the house.
因变量 :如果一个变量的值受一个或多个变量的值影响,则该变量为因变量。 例如,人员的指定将影响他/她的工资,或者房屋中的卧室数量将影响房屋的成本。
In any form of regression, our aim is to investigate the relationship between the independent and dependent variables.
在任何形式的回归中,我们的目的都是研究自变量和因变量之间的关系。
In simple linear regression, we try to model the data using a straight line that best fits our data. We then make the predictions using this line of best fit. Our predictions are usually the value of the independent variable and for this to work properly, our independent variable must be continuous rather than discrete.
在简单的线性回归中,我们尝试使用最适合我们数据的直线对数据建模。 然后,我们使用最合适的这条线进行预测。 我们的预测通常是自变量的值,为了使其正常工作,我们的自变量必须是连续的而不是离散的。
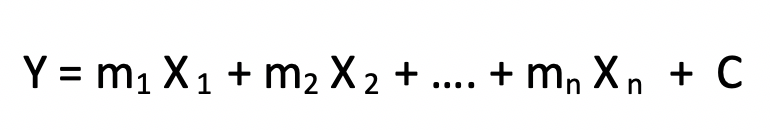
If you don’t want to go into the math too much, Linear Regression is simply expressing the relationship between the dependent and independent variables in a linear equation. For example, the equation for simple linear regression will look something like this:
如果您不想过多地研究数学,则线性回归只是在线性方程式中表达因变量和自变量之间的关系。 例如,用于简单线性回归的方程将如下所示:
Plugging in the various values of X, we can easily get the corresponding values of Y.
插入X的各种值,我们可以轻松获得Y的相应值。
For Multiple Linear Regression, we have more than one independent variables that influence our dependent variable. Here we form an equation like -
对于多重线性回归,我们有多个影响我们因变量的自变量。 在这里,我们形成一个等式-
Here again, by plugging in the various values of the independent variables, we get our corresponding value of Y.
同样,通过插入自变量的各种值,我们得到对应的Y值。

The formula for calculating the coefficients m and the intercept c isn’t something we need to memorize as, during our modelling stage, it would be automatically done for us when we train our data.
我们不需要记住用于计算系数m和截距c的公式,因为在建模阶段,当我们训练数据时将自动为我们完成公式。
线性回归的用途 (Uses of Linear Regression)
- Predicting continuous data or trends, like economic growth or sales estimates预测连续数据或趋势,例如经济增长或销售估算
- Predicting the prices of commodities based on their various characteristics, for example, calculating the price of a house based on the number of rooms, square footage, location etc.根据商品的各种特征预测商品的价格,例如,根据房间数量,平方英尺,位置等来计算房屋的价格。
- Sports predictions体育预测
逐步线性回归 (Step by Step Linear Regression)
A good way to practice linear regression for the first time is to take a dataset having 2 variables, an independent variable and a dependent variable, and test the algorithm.
第一次进行线性回归的一个好方法是获取一个包含2个变量(自变量和因变量)的数据集,并测试算法。
I will be taking a dataset consisting of 2 columns — “Hours” and “Scores”. The “Hours” depict the number of hours studied by a student for a test and the “Scores” depicts the percentage scored by the student on that test. We can imagine that the more a student studies, the higher scores he/she is likely to get. Of course, there can be other factors that we should be considering, but let's focus on just these two variables for now.
我将获取一个由两列组成的数据集-“小时”和“分数”。 “小时”表示学生为考试而学习的小时数,“分数”表示学生在该考试中所得分的百分比。 我们可以想象,学生学习的越多,他/她可能会获得更高的分数。 当然,我们可能还要考虑其他因素,但是现在让我们仅关注这两个变量。
- We start off with importing our libraries. This is very important as it helps us perform the various tasks further on.我们从导入我们的库开始。 这非常重要,因为它有助于我们进一步执行各种任务。

The pandas library allows us to work with dataframesThe numpy library allows us to work with arraysmatplotlib.pyplot will help us in plotting graphs to visualize our data.seaborn is a library made on top of matplotlib that also allows us in data visulaization.
pandas库允许我们使用数据框; numpy库允许我们使用数组matplotlib.pyplot将帮助我们绘制图形以可视化数据。 seaborn是在matplotlib之上构建的库,它也使我们能够进行数据可视化。
2. Now import your data. The data I worked with can be found on this link It was provided to me when I was working on this mini-project as part of a Data Science internship with The Sparks Foundation. I will use pandas to import my data into a dataframe.
2.现在导入您的数据。 我使用的数据可以在此链接上找到。当我在这个小型项目中工作时,该数据是作为我在The Sparks Foundation进行数据科学实习的一部分而提供的。 我将使用pandas将数据导入数据框。

3. Explore your data: Before you actually use linear regression to make predictions, you should see if your data actually has a linear relationship or not. We can use many visualization techniques to check this. My favourite is using seaborn’s regplot that not only plots our data, but also shows a regression line. This makes it easy to see if our data is has a linear relationship or not.
3. 探索数据 :在实际使用线性回归进行预测之前,您应该查看数据是否真正具有线性关系。 我们可以使用许多可视化技术来检查这一点。 我最喜欢的是使用seaborn的regplot,它不仅可以绘制我们的数据,还可以显示一条回归线。 这样可以轻松查看我们的数据是否具有线性关系。


We can see an obvious positive linear relationship between the Hours and the Scores. As the Hours are increasing, so are the scores and the increase is linear.
我们可以看到小时和分数之间存在明显的正线性关系。 随着小时数的增加,分数也随之增加,并且增加是线性的。
Such a regplot is good if you have less number of independent variables. But it's quite inconvenient to plot this for all variables if you have many of them. In that case, I recommend a Heat Map. Plotting the correlation between each independent variable with the dependent variable using a heatmap gives us information about the whole data in practically just 1 line of code.
如果您拥有较少的自变量,那么这样的regplot很好。 但是,如果您有很多变量,则很难为所有变量绘制此图。 在这种情况下,我推荐一个热图。 使用热图绘制每个自变量与因变量之间的相关性,实际上仅用一行代码即可为我们提供有关整个数据的信息。


The correlation between Hours and Scores is very high, Linear Regression to make predictions seems like a good idea.
Hours和Scores之间的相关性非常高,使用线性回归进行预测似乎是个好主意。
4. Making the Model: Now that we know we can use linear regression for this data, we make our model.
4. 建立模型:现在我们知道可以对数据使用线性回归了,我们建立模型。
Firstly, we store our values for independent and dependent variables in X and Y, respectively.
首先,我们分别将自变量和因变量的值存储在X和Y中。

Now we make use of the sklearn library and using model_selection we import train_test_split. This will allow us to split our data into 2 parts: a training part and a testing part. This is useful as we can train our data on one part and use the other part to test our accuracy. If we were to use all the data for training, we would have no way of knowing if any subsequent predictions made by us are accurate or not.
现在,我们使用sklearn库,并使用model_selection导入train_test_split。 这将使我们可以将数据分为两个部分:训练部分和测试部分。 这很有用,因为我们可以一方面训练数据,另一方面使用数据来测试我们的准确性。 如果我们将所有数据用于训练,我们将无法知道我们所做的任何后续预测是否准确。

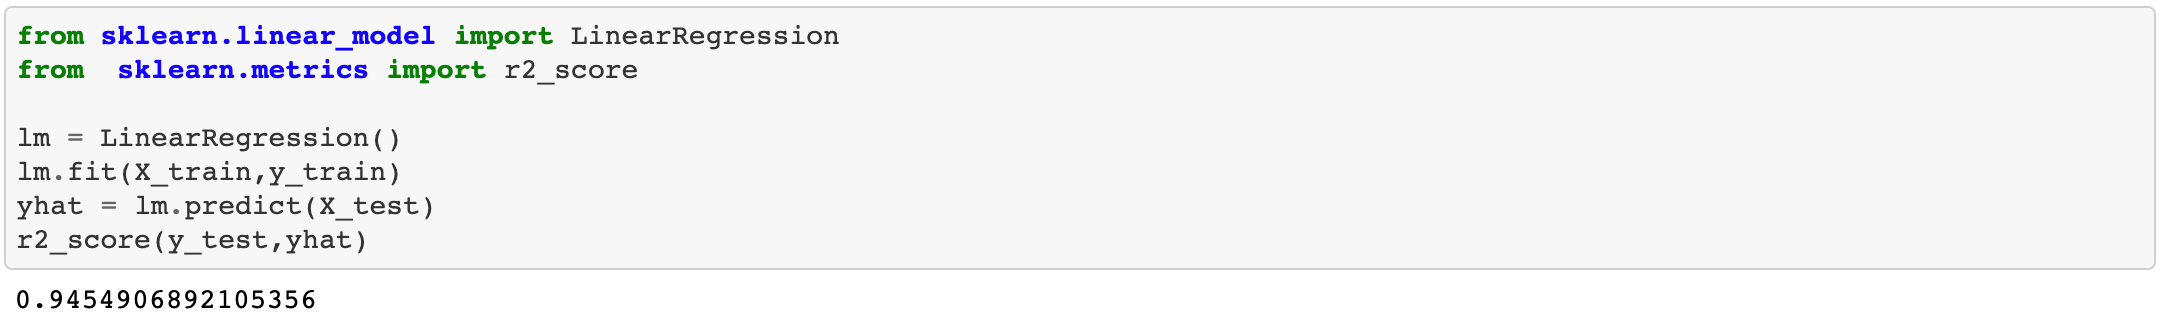
Now we make the model. From sklearn.linear_model, we import LinearRegression. We then create ‘lm’ which will be used for Linear regression.
现在我们制作模型。 从sklearn.linear_model,我们导入LinearRegression。 然后,我们创建将用于线性回归的“ lm”。
We fit and train our data and then store the predictions for the testing data in yhat. The r2_score is a metric that allows us to check the accuracy of our data. Here we can see that our data has a r2 score of about 0.9454, which is a very good accuracy score keeping the kind of data we have. We will explore what r2 score is in the further paragraphs.
我们拟合并训练数据,然后将测试数据的预测存储在yhat中。 r2_score是一个度量标准,可让我们检查数据的准确性。 在这里我们可以看到我们的数据的r2得分约为0.9454,这是一个非常好的准确性得分,保持了我们拥有的数据的种类。 我们将在后续段落中探讨r2得分是多少。
If we recall, Linear Regression was about finding a straight line that best fits our data points. Our model does just that. Using the coef_ and intercept_ commands we can access the coefficient of the X values and the intercept for our line.
如果我们还记得的话,线性回归就是要找到最适合我们数据点的直线。 我们的模型就是这样做的。 使用coef_和intercept_命令,我们可以访问X值的系数和行的截距。

Let us plot the line using these values of coefficient and intercept to see if it fits our data or not.
让我们使用这些系数值绘制线并截取以查看其是否适合我们的数据。


Our model has given us a well-fitted line. This line is what is being used for the prediction of our data. For each value of x that we provide, the model calculates the corresponding value of y on this line and that is our predicted value.
我们的模型为我们提供了一条合身的路线。 这条线用于预测我们的数据。 对于我们提供的每个x值,模型都会计算这条线上的y对应值,这就是我们的预测值。
评估我们的模型 (Evaluating our Model)
We will be using a metric called the R-Squared Value to check the accuracy of our predictions and how well our model works.
我们将使用一种称为R平方值的度量来检查我们的预测的准确性以及模型的运行情况。
The R-Squared value is a statistical measure of how close our data is to the predicted line of best fit. A value close to 1 tells us that our model works well and a value close to 0 means that our dependent variable is not at all dependent on our other variables.The R-squared value can also be negative. This happens when our prediction is actually worse than just using the mean value. What this means is — using the regression algorithm, our predictions are more inaccurate than just using the mean value for the independent variable.
R平方值是一种统计量度,用于衡量我们的数据与最佳拟合预测线的接近程度。 接近1的值表示模型运作良好,接近0的值表示因变量根本不依赖于其他变量.R平方值也可以为负。 当我们的预测实际上比仅使用平均值差时,就会发生这种情况。 这意味着-使用回归算法,我们的预测比仅使用自变量的平均值更不准确。
To calculate the R-squared value, we use the following mathematical formula:
要计算R平方值,我们使用以下数学公式:

Here, we are calculating the residual error (SSres) as the sum of the squares of the errors for each prediction and the total sum of the squared errors (SStot) as the sum of the squares of the distance between our data points and the mean.
在这里,我们正在计算残留误差(SSres)作为每个预测的误差平方和,而平方误差的总和(SStot)作为数据点与均值之间距离的平方和。

The advantage of splitting our data into training and testing datasets is that now wee can easily compare our predicted values with the already available values of Scores in our test data. We create a datafrane to compare our values:
将我们的数据分为训练和测试数据集的优势在于,现在我们可以轻松地将我们的预测值与测试数据中已有的分数值进行比较。 我们创建一个数据比较器来比较我们的值:

The predicted values are close to our actual values, we can visualise this using a bar graph where we plot the actual values and the predicted values simultaneously.
预测值接近我们的实际值,我们可以使用条形图将其可视化,在该图中我们可以同时绘制实际值和预测值。

We can see from the bar graph that using Linear Regression, the prediction made by us are very close to the actual values!
从条形图中我们可以看到,使用线性回归,我们所做的预测非常接近实际值!
You can find my full code on my GitHub:
您可以在GitHub上找到我的完整代码:
翻译自: https://medium.com/swlh/exploring-machine-learning-algorithms-simple-linear-regression-e0a086829106
机器学习 线性回归算法
http://www.taodudu.cc/news/show-4359400.html
相关文章:
- java中的variable是什么,Java POJO中的field,variable,attribute和property有什么区别?
- uni-app+uview 购物车模块组件(笔记)
- 专访Polychain创始人Olaf:我们只囤币,从不做空
- 5个Libra协会成员加入,这家创业公司凭什么与Facebook 竞争?
- Medkoo Biosciences艾美捷 甲氧沙林
- 计算机语言zuv,我们的拼语_大家的语言_新浪博客
- lpop 原子_深圳大学张文静教授团队ACS Nano:单原子铂修饰的二硫化钒催化剂提高电催化析氢性能...
- 风投是如何逆势布局DeFi项目的?
- 读书笔记 | 自动驾驶中的雷达信号处理(第9章 汽车雷达的应用概述)
- 微服务 ZooKeeper ,Dubbo ,Kafka 介绍应用
- 猛兽来袭——Integral Protocol
- 分析师:百度到2030年可能成为中国市值最高的公司
- 史上最全Git命令学习:从基础出发,Java中高级面试题总结(全面)
- Polychain重仓的Findora公链,想带领DeFi脱虚向实
- Flutter 制霸全平台?这事儿我看有戏。
- 使用 Microsoft AI 打造你的首款智能机器人(入门只需要1小时)
- Weex实战分享|Weex在极客时间APP中的实践
- 路由的导航守卫过渡动效transtion导航守卫 路由懒加载 路由元信息 @stage3---wee2--day7
- 听Polychain Capital创始人Olaf Carlson- Wee讲述他为何愿意为Celo背书
- 计算广告基础概念
- 好多粉数据上报之卧龙搜索ocpc API上报数据
- 【强化学习论文合集】二十九.2021国际机器学习大会论文(ICML2021)
- 【论文笔记】强化学习论文阅读-Model-Based RL 9篇
- 机器学习论文
- 25篇经典机器学习论文的分类
- 转自知乎,深度强化学习论文https://zhuanlan.zhihu.com/p/23600620
- 论文学习
- 论文学习及报告总结
- apache Ignite 节点生命周期事件例子
- /proc 文件系统中的文件及内容介绍
机器学习 线性回归算法_探索机器学习算法简单线性回归相关推荐
- 【Matlab】智能优化算法_蜻蜓优化算法DA
[Matlab]智能优化算法_蜻蜓优化算法DA 1.背景介绍 2.灵感 3.公式推导 3.1 勘探和开发操作 4.算法流程图 5.文件结构 6.伪代码 7.详细代码及注释 7.1 DA.m 7.2 d ...
- 【Matlab】智能优化算法_蚁狮优化算法ALO
[Matlab]智能优化算法_蚁狮优化算法ALO 1.背景介绍 2.基本思想 3.公式推导 3.1 ALO算法的运算符 3.2 蚂蚁的随机游动 3.3 困在蚂蚁坑里 3.4 修建陷阱 3.5 蚂蚁划向 ...
- 【Matlab】智能优化算法_灰狼优化算法GWO
[Matlab]智能优化算法_灰狼优化算法GWO 1.背景介绍 2.基本思想 2.1 等级制度 2.2 狩猎方式 3.公式推导 3.1 社会等级制度 3.2 包围猎物 3.3 包围猎物 3.4 攻击猎 ...
- python天气预测算法_使用机器学习预测天气(第二部分)
概述 这篇文章我们接着前一篇文章,使用Weather Underground网站获取到的数据,来继续探讨用机器学习的方法预测内布拉斯加州林肯市的天气 上一篇文章我们已经探讨了如何收集.整理.清洗数据. ...
- k近邻算法_【机器学习】K近邻算法(KNN)
点击关注上方"小田学python",获取更多精彩内容 机器学习是一门多领域交叉学科,涉及概率论.统计学.逼近论.凸分析.算法复杂度理论等多门学科.专门研究计算机怎样模拟或实现人类的 ...
- python线性回归算法简介_Python实现的简单线性回归算法实例分析
本文实例讲述了Python实现的简单线性回归算法.分享给大家供大家参考,具体如下: 用python实现R的线性模型(lm)中一元线性回归的简单方法,使用R的women示例数据,R的运行结果: > ...
- 使用机器学习预测天气_使用机器学习的二手车价格预测
使用机器学习预测天气 You can reach all Python scripts relative to this on my GitHub page. If you are intereste ...
- 27个机器学习图表翻译_使用机器学习的信息图表信息组织
27个机器学习图表翻译 Infographics are crucial for presenting information in a more digestible fashion to the ...
- 机器学习 客户流失_通过机器学习预测流失
机器学习 客户流失 介绍 (Introduction) This article is part of a project for Udacity "Become a Data Scient ...
最新文章
- 从零到一:用Phaser.js写意地开发小游戏(Chapter 4 - 游戏即将开始)
- ITK:迷你管道MiniPipeline
- golang调用matlab,Golang中Proto编写和生成
- HDU5187 zhx#39;s contest(计数问题)
- String封装——读时共享,写时复制
- Bootstrap滚动监控器
- saspython知乎_银行业为什么喜欢用 sas 而不是 python?
- paip.Answer 3.0 注册功能SQL注入漏洞解决方案
- Linux发行版简介
- python for spss statistics_SPSS Statistics功能介绍
- 机器学习-周志华总结
- 如何使用java连接网易企业邮箱
- 标准证件照电子版怎么做?
- matlab音乐键盘模拟,科学网—[原][Matlab][04] Midi音乐键盘 - 王楠的博文
- Cholesky分解(Matlab代码实现)
- Opengl中的三维数学二(点和向量的简单运算)
- 使用Python批量提取Word文档中的图片
- ENSP:防火墙IPSEC XXX
- SpringBoot 日志(学习笔记13)
- 阿里巴巴 Java开发手册
热门文章
- Tensorflow使用object_detetcion安装教程
- 【转载】Quartus II LPM使用指南-FIFO篇
- 服务器主板北桥芯片组有哪些,主板上北桥芯片组都负责管理哪些硬件?
- Google需警惕苹果Apple TV的10大原因
- USB无法debug调试:because an app is obscuring a permission request settings cab't verify your resonse
- Jqgird 如何使用自带的search模块进行数据查询
- 关于几何学发展的三阶段
- 从刚体动力学方程到 MATLAB 多种方法仿真验证
- Thinkphp框架的源码通读1
- 能源管理系统助力工业企业绿色低碳发展