Qwt--散点图/函数图
1.Qwt库
QwtPlot是用来绘制二维图像的widget。在它的画板上可以无限制的显示绘画组件。绘画组件可以是曲线(QwtPlotCurve)、标记(QwtPlotMarker)、网格(QwtPlotGrid)、或者其它从QwtPlotItem继承的组件。
2.简单介绍:原文链接,原作者辛苦........
QwtPlot拥有4个axes(轴线):
|
yLeft
|
Y axis left of the canvas. |
| yRight | Y axis right of the canvas. |
| xBottom | X axis below the canvas. |
| xTop | X axis above the canvas. |
常用函数接口:
| setAxisTitle | 设置轴标题 |
| enableAxis | 主要是显示xTop,yRight坐标轴 |
| setAxisMaxMajor | 设置某个某个坐标轴扩大比例尺的最大间隔数目 |
| setAxisMaxMinor | 设置某个某个坐标轴缩小比例尺的最大间隔数目 |
| setAxisScale | 禁用自动缩放比例尺,为某个坐标轴指定一个修改的比例尺 |
| insertLegend | 添加图例(标注) |
常用组件:
| QwtPlotCurve | 曲线 可以用曲线来完成散点图等等...... |
| QwtPlotMarker | 标记 |
| QwtPlotGrid | 网格 |
| QwtPlotHistogram | 直方图 |
| other | 从QwtPlotItem继承的组件 |
| QwtPlotItem | plot能显示的类,如果想要实现自己绘画图形,要继承此类实现rtti和draw接口 |
| QwtPlotPanner | 平移器 (用鼠标左键平移) |
| QwtPlotMagnifier | 放大器 (用鼠标滚轮缩放) |
| QwtPlotCanvas | 画布 |
| QwtScaleMap | 比例图---可以提供一个逻辑区域到实际区域的坐标转换 |
| QwtScaleWidget | 比例窗口 |
| QwtScaleDiv | 比例布局 |
| QwtLegent | 标注 |
| QwtPlotLayout | 布局管理器 |
| QwtScaleDraw | 自画坐标轴 |
| setPen | 设置画笔 |
| setData | 设置曲线的数据 |
| setStyle | 设置曲线形式,点、直线、虚线等等 |
| setCurveAttribute | 设置曲线属性,一般设置Fitted |
| attch | 把曲线附加到QwlPlot上 |
#include <QtGui/QApplication>
#include <Qt/qmath.h>
#include <QVector>
#include <qwt_plot.h>
#include <qwt_plot_curve.h>
#include <qwt_plot_magnifier.h>
#include <qwt_plot_panner.h>
#include <qwt_legend.h> int main(int argc, char *argv[])
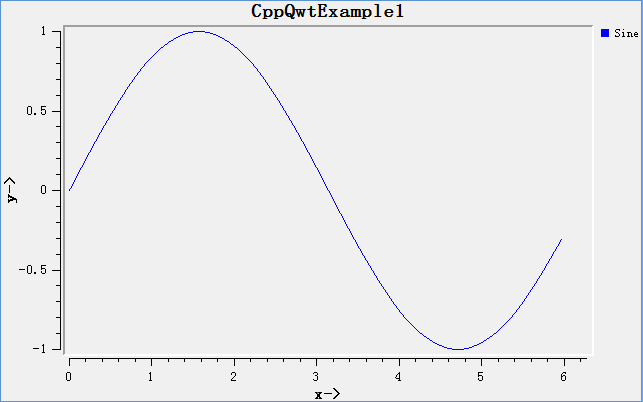
{ QApplication a(argc, argv); QwtPlot plot(QwtText("CppQwtExample1")); plot.resize(640,400); plot.setAxisTitle(QwtPlot::xBottom, "x->"); //设置坐标轴的名称 plot.setAxisTitle(QwtPlot::yLeft, "y->"); plot.setAxisScale(QwtPlot::xBottom, 0.0, 2.0 * M_PI); //设置坐标轴的范围 plot.setAxisScale(QwtPlot::yLeft, -1.0, 1.0); plot.insertLegend(new QwtLegend(), QwtPlot::RightLegend); //设置右边标注 (void) new QwtPlotMagnifier( plot.canvas() ); //使用滚轮放大/缩小 (void) new QwtPlotPanner( plot.canvas() ); //使用鼠标左键平移 //计算曲线数据 QVector<double> xs; QVector<double> ys; for (double x = 0; x < 2.0 * M_PI; x+=(M_PI / 10.0)) { xs.append(x); ys.append(qSin(x)); } //构造曲线数据 QwtPointArrayData * const data = new QwtPointArrayData(xs, ys); QwtPlotCurve curve("Sine"); curve.setData(data);//设置数据 curve.setStyle(QwtPlotCurve::Lines);//直线形式 curve.setCurveAttribute(QwtPlotCurve::Fitted, true);//是曲线更光滑 curve.setPen(QPen(Qt::blue));//设置画笔 curve.attach(&plot);//把曲线附加到plot上 plot.show(); return a.exec();
}3.使用QWT绘制科学图表、绘图
解释QwtSimple:simple是qwt自带的例子中最简单的一个, 一共只有一百来行的代码, 实现了数学中的正弦函数(sin())和余弦函数(cos())曲线。
4.我使用到的两种情况
4.1 对函数进行画图----曲线图(这个功能很别致的!)
包含文件:#include <qlayout.h>
#include <qwt_plot.h>
#include <qwt_plot_marker.h>
#include <qwt_plot_curve.h>
#include <qwt_legend.h>
#include <qwt_series_data.h>
#include <qwt_plot_canvas.h>
#include <qwt_plot_panner.h>
#include <qwt_plot_magnifier.h>
#include <qwt_text.h>
#include <qwt_math.h>
#include <math.h>把连续函数定义为全局函数,输入/返回值为double:double funcMy( doublef)
{return 0.15*f;
}定义序列数据;
class CArraySeriesDat:publicQwtSyntheticPointData
{
public:CArraySeriesDat(double(*y)(double)):QwtSyntheticPointData(100),d_y(y){   }virtual double y(double x) const    {   return d_y(x);    }private:double(*d_y)(double);};自定义画图类:class Plot:publicQwtPlot
{
public:Plot( QWidget *parent = NULL);~Plot( );void drawArray();//画图函数
protected:virtual void resizeEvent( QResizeEvent * );
private:void populateCos();void updateGradient();
};画图类初始化:Plot::Plot(QWidget*parent):QwtPlot( parent )
{// panning with the left mouse button(void) new QwtPlotPanner( canvas() );// zoom in/out with the wheel(void) new QwtPlotMagnifier( canvas() );setAutoFillBackground( true );setPalette( QPalette( QColor( 165, 193, 228 ) ) );updateGradient();setTitle("A Simple QwtPlot Demonstration");insertLegend(new QwtLegend(), QwtPlot::RightLegend);// axessetAxisTitle(xBottom, "x -->" );setAxisScale(xBottom, 0.0, 10.0);setAxisTitle(yLeft, "y -->");setAxisScale(yLeft, -1.0, 1.0);// canvascanvas()->setLineWidth( 1 );canvas()->setFrameStyle( QFrame::Box | QFrame::Plain );canvas()->setBorderRadius( 15 );QPalette canvasPalette( Qt::white );canvasPalette.setColor( QPalette::Foreground, QColor( 133, 190, 232 ) );canvas()->setPalette( canvasPalette );
}私有成员函数实现:void Plot::updateGradient()
{QPalette pal = palette();const QColor buttonColor = pal.color( QPalette::Button );
#ifdef Q_WS_X11// Qt 4.7.1: QGradient::StretchToDeviceMode is buggy on X11QLinearGradient gradient( rect().topLeft(), rect().bottomLeft() );gradient.setColorAt( 0.0, Qt::white );gradient.setColorAt( 0.7, buttonColor );gradient.setColorAt( 1.0, buttonColor );#elseQLinearGradient gradient( 0, 0, 0, 1 );gradient.setCoordinateMode( QGradient::StretchToDeviceMode );gradient.setColorAt( 0.0, Qt::white );gradient.setColorAt( 0.7, buttonColor );gradient.setColorAt( 1.0, buttonColor );#endifpal.setBrush( QPalette::Window, gradient );setPalette( pal );
}void Plot::resizeEvent( QResizeEvent *event )
{QwtPlot::resizeEvent( event );
#ifdef Q_WS_X11updateGradient();
#endif
}画图函数实现:void Plot::drawArray()
{// Insert new curvesQwtPlotCurve *cSin = new QwtPlotCurve("y = sin(x)");cSin->setRenderHint(QwtPlotItem::RenderAntialiased);cSin->setLegendAttribute(QwtPlotCurve::LegendShowLine, true);cSin->setPen(QPen(Qt::red));cSin->attach(this);QwtPlotCurve *cCos = new QwtPlotCurve("y = cos(x)");cCos->setRenderHint(QwtPlotItem::RenderAntialiased);cCos->setLegendAttribute(QwtPlotCurve::LegendShowLine, true);cCos->setPen(QPen(Qt::blue));cCos->attach(this);CArraySeriesDat*  ArraySeriesDat = new CArraySeriesDat(funcMy); //以函数指针的形式获取曲线cCos->setData(ArraySeriesDat);return;}函数测试:int main(intargc,char**argv)
{QApplication a(argc, argv);Plot *plot = new Plot();// We put a dummy widget around to have// so that Qt paints a widget background// when resizingQWidget window;QHBoxLayout *layout = new QHBoxLayout( &window );layout->setContentsMargins( 0, 0, 0, 0 );layout->addWidget( plot );  plot->drawArray();//画图...........window.resize(600,400);window.show();return a.exec();
}
4.2 散点图(基本功能)
头文件:
class CCruvePlot:publicQwtPlot
{
public:CCruvePlot();~CCruvePlot(void);public:void drawPlotCruve();
private:QwtPlotCurve *  curve;QVector<double> xData;QVector<double> yData;
};//实现文件:
#include "cruvePlot.h"
const int LineNum=7;
const int PointNum=7;
CCruvePlot::CCruvePlot(){}
CCruvePlot::~CCruvePlot(void){}void CCruvePlot::drawPlotCruve()
{//QMessageBox::information(this,"Running!","Running matlab Function.....");setTitle("A Simple QwtPlot Demonstration");//设置标题insertLegend(new QwtLegend(), QwtPlot::RightLegend);//设置标线的栏setAxisTitle(xBottom, "x -->");setAxisScale(xBottom, 0.0, 10.0);setAxisTitle(yLeft, "y -->");setAxisScale(yLeft, 0, 10.0);QwtPlotCurve *curve = new QwtPlotCurve("lineFirst");//实例化一条曲线curve->attach(this);double *x=new double[PointNum];double *y=new double[PointNum];for(int i=0;i<PointNum;i++) {x[i]=i;y[i]=i+3;}curve->setSamples (x,y,PointNum);//传画曲线的数据curve->setPen(QPen(Qt::red));QwtPlotCurve *curve2 = new QwtPlotCurve("lineSecond");//实例化另一条线curve2->attach(this);double *x2=new double[PointNum];double *y2=new double[PointNum];for(int i=0;i<PointNum;i++){x2[i]=i*3;y2[i]=i+3;}curve2->setSamples (x2,y2,PointNum);curve2->setPen(QPen(Qt::blue));return;}
4.3 对于QwtSymbol的使用,详细参考此博客:http://blog.csdn.net/qustdjx/article/details/7940896
为什么不封装成类似Matlab的用法呢?
Qwt--散点图/函数图相关推荐
- R语言pairs函数和ggpairs函数可视化实现散点图矩阵图实战
R语言pairs函数和ggpairs函数可视化实现散点图矩阵图实战 目录 R语言pairs函数和ggpairs函数可视化实现散点图矩阵图实战 #基本语法
- graphics | 基础绘图系统(七)——各式各样的散点图/折线图
前面已经用了六篇推文系统地介绍了R语言的基础绘图系统的主要函数用法,以及柱状图.直方图.箱形图.扇形图等常见图形的绘制方法,接下来将计划用四篇推文介绍使用基础绘图系统能够绘制的其他各类图形. 本篇介绍 ...
- graphics | 基础绘图系统(四)——柱状图、直方图、扇形图、箱形图和函数图象...
前面介绍的主函数plot()主要用于绘制散点图和折线图,绘制其他常见的图形如柱状图.直方图.扇形图和箱形图等可以调用专门的函数. 1 柱状图 绘制基础柱状图的函数是barplot(),其语法结构如下: ...
- matplotlib—画正弦、余弦函数图
一.导入模块 import matplotlib.pyplot as plt import numpy as np plt.rcParams['font.sans-serif']=['SimHei'] ...
- Matplotlib 2 |折线图| 柱状图| 堆叠图| 面积图| 填图| 饼图| 直方图| 散点图| 极坐标| 图箱型图
目录 Matplotlib 2 |折线图| 柱状图| 堆叠图| 面积图| 填图| 饼图| 直方图| 散点图| 极坐标| 图箱型图 1.基本图表绘制 plt.plot() ts.plot() 由Seri ...
- Matplotlib可视化②——3D绘制散点图曲面图折线图等高线图
公众号: 数据小斑马,关注即可获得价值1000元的数据分析学习资料 数据可视化系列汇总: Matplotlib可视化①--二维图表绘制(折线图&直方图&散点图&条形图& ...
- 计算机绘制函数的应用,信息技术应用用计算机绘制函数图象 (4).pptx
信息技术应用用计算机绘制函数图象 (4).pptx (12页) 本资源提供全文预览,点击全文预览即可全文预览,如果喜欢文档就下载吧,查找使用更方便哦! 9.9 积分 用计算机绘制函数图象高中数学人教A ...
- MATLAB的动态图,伪色彩图、矢量图、流线图,散点图折线图的绘制例子--流体力学;LBM
还是老规矩先宣传一下QQ群群: 格子玻尔兹曼救星:293267908.免费群!一切为了早日毕业. 最近群友问画图的挺多,动态图,伪色彩图.矢量图.流线图,散点图折线图..我在这里贡献一下自己的MATL ...
- 在Word中插入函数图象
前两天,一直忙着区评优课. 讲的是河北大学版的教材中,第二册 第三章 第5节 数据图表 的内容 成绩还不错, 特等奖. 也就是这个之后,区教研室的泽哥,问了一个问题. 想往WORD中插入函数图象, ...
- java 画数学函数图
java 画数学函数图不太方便,需要用第三方包 jfree,安装或下载方法网上有. 要用到 jfree 里面的 XYSeries,生成一系列数据. 然后根据生成的数据,使用 chart 描点画图. 举 ...
最新文章
- 2021年大数据Spark(五):大环境搭建本地模式 Local
- 说好的敬畏每一行代码呢?Antd代码彩蛋炸翻一圈人
- 查询数据库中的表结构信息
- IIS处理并发请求时出现的问题及解决
- 15丨基础篇:Linux内存是怎么工作的?
- 学习笔记(41):Python实战编程-按钮
- 【渝粤题库】国家开放大学2021春4010渠道管理答案
- apt-get、apt、yum、dpkg、rpm
- 手把手带你搭建Mvp+Dagger架构
- 第二天一早的飞鸽传书
- mongoDB cluster insert slow
- CentOS7环境下搭建ElasticSearch
- Linux环境运行Jmeter
- python怎么七个数字一换行_python中怎么换行?
- 大型项目用python吗_在大型项目上,Python 是个烂语言吗?
- 计算机驱动恢复出厂设置在哪里,Windows系统恢复出厂设置在哪?怎么恢复出厂设置?...
- 昆明二级计算机考试报名时间2015,2015年国家司法考试昆明考区公告
- 如何释放计算机内存吗,Win7如何释放内存?三招帮你将电脑中的垃圾全部清理掉!...
- 极路由2(HC5761)免云平台开启SSH
- 托米的咒语 牛客练习赛23 D