项目评价指标 误差回归_了解回归误差指标
项目评价指标 误差回归
Human brains are built to recognize patterns in the world around us. For example, we observe that if we practice our programming everyday, our related skills grow. But how do we precisely describe this relationship to other people? How can we describe how strong this relationship is? Luckily, we can describe relationships between phenomena, such as practice and skill, in terms of formal mathematical estimations called regressions.
人类的大脑旨在识别我们周围世界的模式。 例如,我们观察到,如果每天练习编程,我们的相关技能就会提高。 但是,我们如何精确地描述与他人的这种关系? 我们如何描述这种关系有多牢固? 幸运的是,我们可以用称为回归的形式化数学估计来描述诸如实践和技能之类的现象之间的关系。
Regressions are one of the most commonly used tools in a data scientist’s kit. When you learn Python or R, you gain the ability to create regressions in single lines of code without having to deal with the underlying mathematical theory. But this ease can cause us to forget to evaluate our regressions to ensure that they are a sufficient enough representation of our data.
回归是数据科学家工具包中最常用的工具之一。 当您学习Python或R时,您将能够在单行代码中创建回归,而无需处理基础数学理论。 但是这种轻松可能会导致我们忘记评估回归,以确保它们足以代表我们的数据。
We can plug our data back into our regression equation to see if the predicted output matches corresponding observed value seen in the data. The quality of a regression model is how well its predictions match up against actual values, but how do we actually evaluate quality?
我们可以将数据重新插入回归方程中,以查看预测输出是否与数据中看到的相应观察值匹配。 回归模型的质量是其预测与实际值的匹配程度,但是我们如何实际评估质量?
Luckily, smart statisticians have developed error metrics to judge the quality of a model and enable us to compare regresssions against other regressions with different parameters. These metrics are short and useful summaries of the quality of our data. This article will dive into four common regression metrics and discuss their use cases.
幸运的是,聪明的统计学家已经开发出误差度量标准来判断模型的质量,并使我们能够将回归与其他具有不同参数的回归进行比较。 这些指标是我们数据质量的简短有用的总结。 本文将深入探讨四个常见的回归指标并讨论它们的用例。
There are many types of regression, but this article will focus exclusively on metrics related to the linear regression. The linear regression is the most commonly used model in research and business and is the simplest to understand, so it makes sense to start developing your intuition on how they are assessed. The intuition behind many of the metrics we’ll cover here extend to other types of models and their respective metrics.
回归类型很多,但是本文将只关注与线性回归相关的指标。 线性回归是研究和商业中最常用的模型,最容易理解,因此有必要开始就如何评估它们建立直觉。 我们将在此处介绍的许多指标背后的直觉延伸到其他类型的模型及其各自的指标。
If you’d like a quick refresher on the linear regression, you can consult this fantastic blog post or the Linear Regression Wiki page.
如果您想快速回顾线性回归,可以查阅此精彩的博客文章或“线性回归Wiki”页面 。
线性回归入门 (A primer on linear regression)
In the context of regression, models refer to mathematical equations used to describe the relationship between two variables. In general, these models deal with prediction and estimation of values of interest in our data called outputs. Models will look at other aspects of the data called inputs that we believe to affect the outputs, and use them to generate estimated outputs. These inputs and outputs have many names that you may have heard before. Inputs are can also be called independent variables or predictors, while outputs are also known as responses or dependent variables. Simply speaking, models are just functions where the outputs are some function of the inputs.
在回归方面,模型是指用于描述两个变量之间关系的数学方程式。 通常,这些模型用于处理我们的数据中称为输出的感兴趣值的预测和估计。 模型将研究称为输入的数据的其他方面,我们认为这些方面会影响输出,并使用它们来生成估计的输出。 这些输入和输出具有您之前可能听说过的许多名称。 输入也可以称为自变量或预测变量,而输出也称为响应或因变量。 简而言之,模型只是输出是输入的某些功能的函数。
The linear part of linear regression refers to the fact that a linear regression model is described mathematically in the form:
线性回归的线性部分是指以数学形式描述线性回归模型的事实:
If that looks too mathematical, take solace in that linear thinking is particularly intuitive. If you’ve ever heard of “practice makes perfect,” then you know that more practice means better skills; there is some linear relationship between practice and perfection.
如果这看起来太数学了,那么请放心,线性思维特别直观。 如果您曾经听说过“实践使完美”,那么您就会知道,更多的练习意味着更好的技能。 实践与完美之间存在线性关系。
The regression part of linear regression does not refer to some return to a lesser state. Regression here simply refers to the act of estimating the relationship between our inputs and outputs. In particular, regression deals with the modelling of continuous values (think: numbers) as opposed to discrete states (think: categories).
线性回归的回归部分并不表示某种程度的回归。 这里的回归简单地是指估计我们的投入和产出之间关系的行为。 尤其是,回归处理的是连续值 (思考:数字)与离散状态(思考:类别)的建模。
Taken together, a linear regression creates a model that assumes a linear relationship between the inputs and outputs. The higher the inputs are, the higher (or lower, if the relationship was negative) the outputs are.
总之,线性回归创建一个模型,该模型假设输入和输出之间存在线性关系。 输入越高,输出越高(如果关系为负,则较低)。
What adjusts how strong the relationship is and what the direction of this relationship is between the inputs and outputs are our coefficients. The first coefficient without an input is called the intercept, and it adjusts what the model predicts when all your inputs are 0.
调整该关系的牢固程度以及输入和输出之间此关系的方向的是我们的系数 。 没有输入的第一个系数称为拦截(intercept) ,它会在所有输入均为0时调整模型预测的值。
We will not delve into how these coefficients are calculated, but know that there exists a method to calculate the optimal coefficients, given which inputs we want to use to predict the output. Given the coefficients, if we plug in values for the inputs, the linear regression will give us an estimate for what the output should be.
我们不会深入研究这些系数的计算方式,但是知道存在一种计算最佳系数的方法,因为我们要使用哪些输入来预测输出。 给定系数,如果我们插入输入值,则线性回归将为我们提供输出的估计值 。
As we’ll see, these outputs won’t always be perfect. Unless our data is a perfectly straight line, our model will not precisely hit all of our data points. One of the reasons for this is the ϵ (named “epsilon”) term. This term represents error that comes from sources out of our control, causing the data to deviate slightly from their true position.
我们将看到,这些输出并不总是完美的。 除非我们的数据是一条完美的直线,否则我们的模型将不会精确地影响我们的所有数据点。 原因之一是ϵ(称为“ε”)术语。 该术语表示来自我们无法控制的源的错误,导致数据略有偏离其实际位置。
Our error metrics will be able to judge the differences between prediction and actual values, but we cannot know how much the error has contributed to the discrepancy. While we cannot ever completely eliminate epsilon, it is useful to retain a term for it in a linear model.
我们的误差指标将能够判断预测值与实际值之间的差异,但我们不知道误差对差异的影响程度。 尽管我们无法完全消除ε,但将其保留在线性模型中很有用。
将模型预测与现实进行比较 (Comparing model predictions against reality)
Since our model will produce an output given any input or set of inputs, we can then check these estimated outputs against the actual values that we tried to predict. We call the difference between the actual value and the model’s estimate a residual. We can calculate the residual for every point in our data set, and each of these residuals will be of use in assessment. These residuals will play a significant role in judging the usefulness of a model.
由于我们的模型将在给定任何输入或一组输入的情况下产生输出,因此我们可以将这些估计的输出与我们尝试预测的实际值进行比较。 我们称实际值与模型估计值之差为残差 。 我们可以计算数据集中每个点的残差,并且这些残差中的每一个都将在评估中使用。 这些残差将在判断模型的实用性方面发挥重要作用。
If our collection of residuals are small, it implies that the model that produced them does a good job at predicting our output of interest. Conversely, if these residuals are generally large, it implies that model is a poor estimator.
如果残差的收集量很小,则意味着产生残差的模型在预测我们感兴趣的输出方面做得很好。 相反,如果这些残差通常很大,则表明该模型是一个差的估计量。
We technically can inspect all of the residuals to judge the model’s accuracy, but unsurprisingly, this does not scale if we have thousands or millions of data points. Thus, statisticians have developed summary measurements that take our collection of residuals and condense them into a single value that represents the predictive ability of our model.
从技术上讲,我们可以检查所有残差以判断模型的准确性,但是不足为奇的是,如果我们有成千上万个数据点,那么这不会缩放。 因此,统计人员开发了汇总度量,这些度量将我们的残差集合收集并将其压缩为一个代表我们模型的预测能力的值。
There are many of these summary statistics, each with their own advantages and pitfalls. For each, we’ll discuss what each statistic represents, their intution and typical use case. We’ll cover:
这些摘要统计数据很多,每个统计数据都有其自身的优势和陷阱。 对于每个统计数据,我们将讨论每个统计数据代表什么,其直觉和典型用例。 我们将介绍:
- Mean Absolute Error
- Mean Square Error
- Mean Absolute Percentage Error
- Mean Percentage Error
- 平均绝对误差
- 均方误差
- 平均绝对百分比误差
- 平均百分比误差
Note: Even though you see the word error here, it does not refer to the epsilon term from above! The error described in these metrics refer to the residuals!
注意:即使您在此处看到错误一词,也不会从上方引用epsilon术语! 这些指标中描述的错误是指残差 !
扎根于真实数据 (Staying rooted in real data)
In discussing these error metrics, it is easy to get bogged down by the various acronyms and equations used to describe them. To keep ourselves grounded, we’ll use a model that I’ve created using the Video Game Sales Data Set from Kaggle.
在讨论这些错误度量时,很容易被用于描述它们的各种首字母缩略词和方程式所困扰。 为了使自己保持扎根,我们将使用我使用Kaggle的视频游戏销售数据集创建的模型。
The specifics of the model I’ve created are shown below.
我创建的模型的详细信息如下所示。
My regression model takes in two inputs (critic score and user score), so it is a multiple variable linear regression. The model took in my data and found that 0.039 and -0.099 were the best coefficients for the inputs. For my model, I chose my intercept to be zero since I’d like to imagine there’d be zero sales for scores of zero. Thus, the intercept term is crossed out. Finally, the error term is crossed out because we do not know its true value in practice. I have shown it because it depicts a more detailed description of what information is encoded in the linear regression equation.
我的回归模型接受两个输入(评论评分和用户评分),因此它是一个多变量线性回归。 该模型吸收了我的数据,发现0.039和-0.099是输入的最佳系数。 对于我的模型,我选择截距为零,因为我想想象得分为零时销售量为零。 因此,截取项被删除。 最后,错误项被删除了,因为我们在实践中不知道其真正价值。 之所以显示它,是因为它描述了线性回归方程中编码的信息的更详细描述。
模型背后的原理 (Rationale behind the model)
Let’s say that I’m a game developer who just created a new game, and I want to know how much money I will make. I don’t want to wait, so I developed a model that predicts total global sales (my output) based on an expert critic’s judgment of the game and general player judgment (my inputs). If both critics and players love the game, then I should make more money… right? When I actually get the critic and user reviews for my game, I can predict how much glorious money I’ll make.
假设我是一个游戏开发人员,刚创建了一个新游戏,我想知道我将赚多少钱。 我不想等待,因此我开发了一个模型,该模型可根据专家评论家对游戏的判断和一般玩家的判断(我的投入)来预测全球总销售额(我的产出)。 如果评论家和玩家都喜欢这款游戏,那我应该赚更多钱……对吗? 当我真正得到游戏的评论家和用户评论时,我可以预测自己能赚到多少光彩。
Currently, I don’t know if my model is accurate or not, so I need to calculate my error metrics to check if I should perhaps include more inputs or if my model is even any good!
目前,我不知道我的模型是否正确,因此我需要计算我的错误指标,以检查是否应该添加更多输入或者我的模型是否还不错!
平均绝对误差 (Mean absolute error)
The mean absolute error (MAE) is the simplest regression error metric to understand. We’ll calculate the residual for every data point, taking only the absolute value of each so that negative and positive residuals do not cancel out. We then take the average of all these residuals. Effectively, MAE describes the typical magnitude of the residuals. If you’re unfamiliar with the mean, you can refer back to this article on descriptive statistics. The formal equation is shown below:
平均绝对误差 (MAE)是最容易理解的回归误差指标。 我们将为每个数据点计算残差,只取每个残差的绝对值,以使负残差和正残差不会被抵消。 然后,我们取所有这些残差的平均值。 有效地,MAE描述了残差的典型大小。 如果您不熟悉平均值,可以参考这篇有关描述性统计的文章 。 形式方程如下所示:
The picture below is a graphical description of the MAE. The green line represents our model’s predictions, and the blue points represent our data.
下图是MAE的图形描述。 绿线代表模型的预测,蓝点代表我们的数据。
The MAE is also the most intuitive of the metrics since we’re just looking at the absolute difference between the data and the model’s predictions. Because we use the absolute value of the residual, the MAE does not indicate underperformance or overperformance of the model (whether or not the model under or overshoots actual data). Each residual contributes proportionally to the total amount of error, meaning that larger errors will contribute linearly to the overall error.
MAE也是指标中最直观的指标,因为我们只是查看数据与模型预测之间的绝对差异。 因为我们使用残差的绝对值,所以MAE不会指示模型的性能不足或性能过高 (模型是否低于或高于实际数据)。 每个残差与总误差成正比,这意味着较大的误差将对总误差产生线性影响。
Like we’ve said above, a small MAE suggests the model is great at prediction, while a large MAE suggests that your model may have trouble in certain areas. A MAE of 0 means that your model is a perfect predictor of the ouputs (but this will almost never happen).
就像我们上面说的,小的MAE表示该模型在预测方面很出色,而较大的MAE则表明您的模型在某些领域可能会遇到问题。 MAE为0意味着您的模型是输出的完美预测器(但是几乎永远不会发生)。
While the MAE is easily interpretable, using the absolute value of the residual often is not as desirable as squaring this difference. Depending on how you want your model to treat outliers, or extreme values, in your data, you may want to bring more attention to these outliers or downplay them. The issue of outliers can play a major role in which error metric you use.
尽管MAE易于解释,但使用残差的绝对值通常不如平方差大。 根据您希望模型如何处理数据中的离群值或极值,您可能需要引起更多关注或关注这些离群值。 离群值的问题可能在您使用的错误指标中起主要作用。
根据我们的模型计算MAE (Calculating MAE against our model)
Calculating MAE is relatively straightforward in Python. In the code below, sales contains a list of all the sales numbers, and X contains a list of tuples of size 2. Each tuple contains the critic score and user score corresponding to the sale in the same index. The lm contains a LinearRegression object from scikit-learn, which I used to create the model itself. This object also contains the coefficients. The predict method takes in inputs and gives the actual prediction based off those inputs.
在Python中,计算MAE相对简单。 在下面的代码中, sales包含所有销售数字的列表, X包含大小为2的元组的列表。每个元组均包含与同一索引中的销售相对应的评论者分数和用户分数。 lm包含来自scikit-learn的LinearRegression对象,我用来创建模型本身。 该对象还包含系数。 predict方法接受输入,并根据这些输入给出实际的预测。
# Perform the intial fitting to get the LinearRegression object from sklearn import linear_model lm = linear_model.LinearRegression() lm.fit(X, sales)mae_sum = 0 for sale, x in zip(sales, X):prediction = lm.predict(x)mae_sum += abs(sale - prediction) mae = mae_sum / len(sales)print(mae) >>> [ 0.7602603 ]# Perform the intial fitting to get the LinearRegression object from sklearn import linear_model lm = linear_model.LinearRegression() lm.fit(X, sales)mae_sum = 0 for sale, x in zip(sales, X):prediction = lm.predict(x)mae_sum += abs(sale - prediction) mae = mae_sum / len(sales)print(mae) >>> [ 0.7602603 ]
Our model’s MAE is 0.760, which is fairly small given that our data’s sales range from 0.01 to about 83 (in millions).
我们模型的MAE为0.760,考虑到我们数据的销售范围从0.01到大约83(百万),这是很小的。
均方误差 (Mean square error)
The mean square error (MSE) is just like the MAE, but squares the difference before summing them all instead of using the absolute value. We can see this difference in the equation below.
均方误差 (MSE)类似于MAE,但在对所有差求和之前将其平方,而不是使用绝对值。 我们可以在下面的公式中看到这种差异。
平方项的后果 (Consequences of the Square Term)
Because we are squaring the difference, the MSE will almost always be bigger than the MAE. For this reason, we cannot directly compare the MAE to the MSE. We can only compare our model’s error metrics to those of a competing model.
因为我们在缩小差异,所以MSE几乎总是大于MAE。 因此,我们无法直接比较MAE和MSE。 我们只能将模型的错误指标与竞争模型的错误指标进行比较。
The effect of the square term in the MSE equation is most apparent with the presence of outliers in our data. While each residual in MAE contributes proportionally to the total error, the error grows quadratically in MSE. This ultimately means that outliers in our data will contribute to much higher total error in the MSE than they would the MAE. Similarly, our model will be penalized more for making predictions that differ greatly from the corresponding actual value. This is to say that large differences between actual and predicted are punished more in MSE than in MAE. The following picture graphically demonstrates what an indivdual residual in the MSE might look like.
当我们的数据中存在异常值时,MSE方程中平方项的影响最为明显。 尽管MAE中的每个残差均与总误差成比例 ,但误差在MSE中呈二次方增长。 最终,这意味着与MAE相比,我们数据中的异常值将对MSE造成更大的总误差。 同样,我们的模型将因作出与相应实际值相差很大的预测而受到更多的惩罚。 这就是说,MSE中实际和预测之间的巨大差异受到的惩罚要比MAE中的惩罚更大。 下图以图形方式展示了MSE中的单个残差可能是什么样子。
Outliers will produce these exponentially larger differences, and it is our job to judge how we should approach them.
离群值将产生这些指数上更大的差异,因此我们的工作是判断如何应对它们。
离群值问题 (The problem of outliers)
Outliers in our data are a constant source of discussion for the data scientists that try to create models. Do we include the outliers in our model creation or do we ignore them? The answer to this question is dependent on the field of study, the data set on hand and the consequences of having errors in the first place.
对于试图创建模型的数据科学家来说,我们数据中的异常值是经常讨论的内容。 我们是在模型创建中包含异常值还是忽略它们? 该问题的答案取决于研究领域,手头的数据集以及首先出现错误的后果。
For example, I know that some video games achieve a superstar status and thus have disproportionately higher earnings. Therefore, it would be foolish of me to ignore these outlier games because they represent a real phenomenon within the data set. I would want to use the MSE to ensure that my model takes these outliers into account more. If I wanted to downplay their significance, I would use the MAE since the outlier residuals won’t contribute as much to the total error as MSE.
例如,我知道有些视频游戏获得了超级明星的地位,因此获得了不成比例的更高收益。 因此,忽略这些离群值的游戏对我来说是愚蠢的,因为它们代表了数据集中的真实现象。 我想使用MSE来确保我的模型将这些离群值更多地考虑在内。 如果我想淡化它们的重要性,我将使用MAE,因为离群残差对总误差的贡献不如MSE。
Ultimately, the choice between is MSE and MAE is application-specific and depends on how you want to treat large errors. Both are still viable error metrics, but will describe different nuances about the prediction errors of your model.
最终,MSE和MAE之间的选择是特定于应用程序的,并取决于您要如何处理大错误。 两者仍然是可行的误差指标,但将描述有关模型预测误差的细微差别。
关于MSE及其近亲的说明 (A note on MSE and a close relative)
Another error metric you may encounter is the root mean squared error (RMSE). As the name suggests, it is the square root of the MSE. Because the MSE is squared, its units do not match that of the original output. Researchers will often use RMSE to convert the error metric back into similar units, making interpretation easier.
您可能会遇到的另一个误差度量是均方根误差 (RMSE)。 顾名思义,它是MSE的平方根。 由于MSE是平方的,因此其单位与原始输出的单位不匹配。 研究人员将经常使用RMSE将误差度量转换回相似的单位,从而使解释更加容易。
Since the MSE and RMSE both square the residual, they are similarly affected by outliers. The RMSE is analogous to the standard deviation (MSE to variance) and is a measure of how large your residuals are spread out.
由于MSE和RMSE都使残差平方,因此它们同样受到异常值的影响。 RMSE类似于标准偏差(MSE与方差),是衡量残差分布多大的度量。
Both MAE and MSE can range from 0 to positive infinity, so as both of these measures get higher, it becomes harder to interpret how well your model is performing. Another way we can summarize our collection of residuals is by using percentages so that each prediction is scaled against the value it’s supposed to estimate.
MAE和MSE的范围都可以从0到正无穷大,因此,随着这两个指标的提高,解释模型的性能变得越来越困难。 我们可以总结残差集合的另一种方法是使用百分比,以便使每个预测都相对应估计的值进行缩放。
根据我们的模型计算MSE (Calculating MSE against our model)
Like MAE, we’ll calculate the MSE for our model. Thankfully, the calculation is just as simple as MAE.
与MAE一样,我们将为模型计算MSE。 幸运的是,计算就像MAE一样简单。
With the MSE, we would expect it to be much larger than MAE due to the influence of outliers. We find that this is the case: the MSE is an order of magnitude higher than the MAE. The corresponding RMSE would be about 1.88, indicating that our model misses actual sale values by about $1.8M.
对于MSE,由于离群值的影响,我们预计它会比MAE大得多。 我们发现情况是这样的:MSE比MAE高一个数量级。 相应的RMSE大约为1.88,这表明我们的模型比实际销售价值少了约180万美元。
平均绝对百分比误差 (Mean absolute percentage error)
The mean absolute percentage error (MAPE) is the percentage equivalent of MAE. The equation looks just like that of MAE, but with adjustments to convert everything into percentages.
平均绝对百分比误差 (MAPE)是MAE的百分比等值。 该方程式看起来就像MAE的方程式一样,但是需要进行调整以将所有内容转换为百分比。
Just as MAE is the average magnitude of error produced by your model, the MAPE is how far the model’s predictions are off from their corresponding outputs on average. Like MAE, MAPE also has a clear interpretation since percentages are easier for people to conceptualize. Both MAPE and MAE are robust to the effects of outliers thanks to the use of absolute value.
就像MAE是模型产生的平均误差幅度一样,MAPE也就是模型的预测平均偏离其相应输出的程度。 像MAE一样,MAPE也具有清晰的解释,因为人们更容易将百分比概念化。 由于使用了绝对值,MAPE和MAE都对异常值的影响具有鲁棒性。
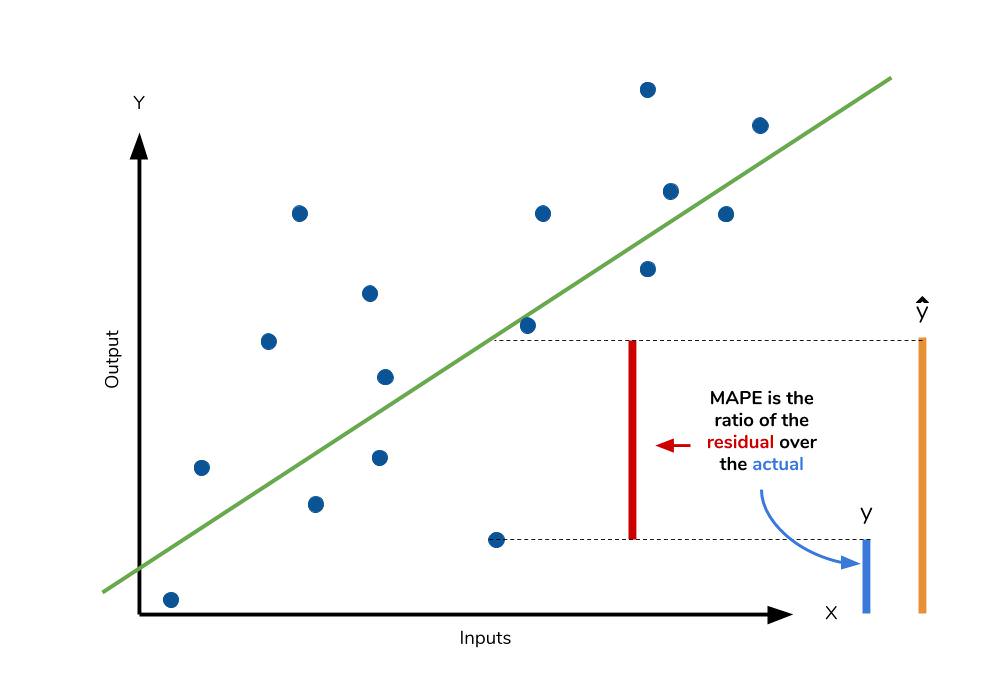
However for all of its advantages, we are more limited in using MAPE than we are MAE. Many of MAPE’s weaknesses actually stem from use division operation. Now that we have to scale everything by the actual value, MAPE is undefined for data points where the value is 0. Similarly, the MAPE can grow unexpectedly large if the actual values are exceptionally small themselves. Finally, the MAPE is biased towards predictions that are systematically less than the actual values themselves. That is to say, MAPE will be lower when the prediction is lower than the actual compared to a prediction that is higher by the same amount. The quick calculation below demonstrates this point.
但是,由于其所有优点,与使用MAE相比,使用MAPE的局限性更大。 MAPE的许多弱点实际上源于使用部门的操作。 现在我们必须按实际值缩放所有内容,对于值为0的数据点,未定义MAPE。类似地,如果实际值本身太小,则MAPE可能会意外地变大。 最后,MAPE偏向于系统地小于实际值本身的预测。 也就是说,当预测比实际低时,MAPE会比与预测高出相同量的预测相比更低。 下面的快速计算说明了这一点。
We have a measure similar to MAPE in the form of the mean percentage error. While the absolute value in MAPE eliminates any negative values, the mean percentage error incorporates both positive and negative errors into its calculation.
我们有一个类似于MAPE的度量,其平均百分比误差形式。 尽管MAPE中的绝对值消除了任何负值,但平均百分比误差将正负误差都纳入了计算。
根据我们的模型计算MAPE (Calculating MAPE against our model)
mape_sum = 0 for sale, x in zip(sales, X):prediction = lm.predict(x)mape_sum += (abs((sale - prediction))/sale) mape = mape_sum/len(sales)print(mape) >>> [ 5.68377867 ]mape_sum = 0 for sale, x in zip(sales, X):prediction = lm.predict(x)mape_sum += (abs((sale - prediction))/sale) mape = mape_sum/len(sales)print(mape) >>> [ 5.68377867 ]
We know for sure that there are no data points for which there are zero sales, so we are safe to use MAPE. Remember that we must interpret it in terms of percentage points. MAPE states that our model’s predictions are, on average, 5.6% off from actual value.
我们确定没有任何数据点的销售为零,因此我们可以放心使用MAPE。 请记住,我们必须以百分比来解释它。 MAPE指出,我们模型的预测平均比实际值低5.6%。
平均百分比误差 (Mean percentage error)
The mean percentage error (MPE) equation is exactly like that of MAPE. The only difference is that it lacks the absolute value operation.
平均百分比误差(MPE)公式与MAPE完全相同。 唯一的区别是它缺少绝对值运算。
Even though the MPE lacks the absolute value operation, it is actually its absence that makes MPE useful. Since positive and negative errors will cancel out, we cannot make any statements about how well the model predictions perform overall. However, if there are more negative or positive errors, this bias will show up in the MPE. Unlike MAE and MAPE, MPE is useful to us because it allows us to see if our model systematically underestimates (more negative error) or overestimates (positive error).
即使MPE缺少绝对值运算,实际上正是MPE的缺失使MPE有用。 由于正误差和负误差将抵消,因此我们无法对模型预测的整体效果做出任何陈述。 但是,如果存在更多的负误差或正误差,则该偏差将在MPE中显示。 与MAE和MAPE不同,MPE对我们很有用,因为它使我们可以查看模型是系统地低估了 (更多的负误差)还是高估了 (正的误差)。
If you’re going to use a relative measure of error like MAPE or MPE rather than an absolute measure of error like MAE or MSE, you’ll most likely use MAPE. MAPE has the advantage of being easily interpretable, but you must be wary of data that will work against the calculation (i.e. zeroes). You can’t use MPE in the same way as MAPE, but it can tell you about systematic errors that your model makes.
如果要使用MAPE或MPE之类的相对误差度量,而不是MAE或MSE之类的绝对误差度量,则很有可能会使用MAPE。 MAPE的优点是易于解释,但您必须警惕会影响计算的数据(即零)。 您不能以与MAPE相同的方式使用MPE,但是它可以告诉您模型造成的系统性错误。
根据我们的模型计算MPE (Calculating MPE against our model)
All the other error metrics have suggested to us that, in general, the model did a fair job at predicting sales based off of critic and user score. However, the MPE indicates to us that it actually systematically underestimates the sales. Knowing this aspect about our model is helpful to us since it allows us to look back at the data and reiterate on which inputs to include that may improve our metrics.
所有其他错误度量标准都向我们表明,总体而言,该模型在根据评论家和用户得分来预测销售额方面做得很好。 但是,MPE向我们表明,它实际上系统地低估了销售额。 了解模型的这一方面对我们很有帮助,因为它使我们可以回顾数据并重申要包含哪些输入可以改善我们的指标。
Overall, I would say that my assumptions in predicting sales was a good start. The error metrics revealed trends that would have been unclear or unseen otherwise.
总的来说,我会说我对销售的预测是一个好的开始。 错误度量标准揭示了趋势,否则趋势可能会不清楚或看不到。
结论 (Conclusion)
We’ve covered a lot of ground with the four summary statistics, but remembering them all correctly can be confusing. The table below will give a quick summary of the acronyms and their basic characteristics.
我们用这四个摘要统计数据覆盖了很多基础知识,但是正确地记住它们可能会造成混淆。 下表将简要概述首字母缩写词及其基本特征。
| Acroynm | 丙烯醛 | Full Name | 全名 | Residual Operation? | 剩余操作? | Robust To Outliers? | 对异常值的鲁棒性? |
|---|---|---|---|---|---|---|---|
| MAE | MAE | Mean Absolute Error | 平均绝对误差 | Absolute Value | 绝对值 | Yes | 是 |
| MSE | 微软 | Mean Squared Error | 均方误差 | Square | 广场 | No | 没有 |
| RMSE | RMSE | Root Mean Squared Error | 均方根误差 | Square | 广场 | No | 没有 |
| MAPE | 玛普 | Mean Absolute Percentage Error | 平均绝对百分比误差 | Absolute Value | 绝对值 | Yes | 是 |
| MPE | MPE | Mean Percentage Error | 平均百分比误差 | N/A | 不适用 | Yes | 是 |
All of the above measures deal directly with the residuals produced by our model. For each of them, we use the magnitude of the metric to decide if the model is performing well. Small error metric values point to good predictive abillity, while large values suggest otherwise. That being said, it’s important to consider the nature of your data set in choosing which metric to present. Outliers may change your choice in metric, depending on if you’d like to give them more significance to the total error. Some fields may just be more prone to outliers, while others are may not see them so much.
以上所有措施都直接处理了我们模型产生的残差。 对于每个变量,我们使用度量的大小来确定模型是否运行良好。 较小的误差度量值表示良好的预测能力,而较大的值则相反。 话虽如此,在选择要显示的指标时,请务必考虑数据集的性质。 离群值可能会改变您对度量的选择,具体取决于您是否希望它们对总误差具有更大的重要性。 有些字段可能更容易出现异常值,而另一些字段可能看不到那么多。
In any field though, having a good idea of what metrics are available to you is always important. We’ve covered a few of the most common error metrics used, but there are others that also see use. The metrics we covered use the mean of the residuals, but the median residual also sees use. As you learn other types of models for your data, remember that intution we developed behind our metrics and apply them as needed.
但是,在任何领域,对您可以使用哪些度量标准都有一个很好的认识总是很重要的。 我们已经介绍了一些最常用的错误指标,但也有其他一些有用的指标。 我们涵盖的指标使用残差的平均值,但是中位数残差也可以使用。 当您学习数据的其他类型的模型时,请记住,我们是根据指标建立的直觉,并根据需要应用它们。
更多资源 (Further Resources)
If you’d like to explore the linear regression more, Dataquest offers an excellent course on its use and application! We used scikit-learn to apply the error metrics in this article, so you can read the docs to get a better look at how to use them!
如果您想进一步探索线性回归,Dataquest将提供有关其使用和应用的绝妙课程! 我们在本文中使用scikit-learn来应用错误度量,因此您可以阅读文档以更好地了解如何使用它们!
- Dataquest’s course on Linear Regression
- Scikit-learn and regression error metrics
- Scikit-learn’s documentation on the LinearRegression object
- An example use of the LinearRegression object
- Dataquest的线性回归课程
- Scikit学习和回归错误指标
- Scikit-learn关于LinearRegression对象的文档
- LinearRegression对象的使用示例
翻译自: https://www.pybloggers.com/2018/09/understanding-regression-error-metrics/
项目评价指标 误差回归
项目评价指标 误差回归_了解回归误差指标相关推荐
- 优化 回归_使用回归优化产品价格
优化 回归 应用数据科学 (Applied data science) Price and quantity are two fundamental measures that determine t ...
- orange实现逻辑回归_逻辑回归算法的原理及实现(LR)
Logistic回归虽然名字叫"回归",但却是一种分类学习方法.使用场景大概有两个:第一用来预测,第二寻找因变量的影响因素.逻辑回归(Logistic Regression, LR ...
- 逻辑斯蒂回归 逻辑回归_逻辑回归简介
逻辑斯蒂回归 逻辑回归 Logistic regression is a classification algorithm, which is pretty popular in some commu ...
- spark java 逻辑回归_逻辑回归分类技术分享,使用Java和Spark区分垃圾邮件
原标题:逻辑回归分类技术分享,使用Java和Spark区分垃圾邮件 由于最近的工作原因,小鸟很久没给大家分享技术了.今天小鸟就给大家介绍一种比较火的机器学习算法,逻辑回归分类算法. 回归是一种监督式学 ...
- orange实现逻辑回归_逻辑回归模型
引入:广义线性模型 上节讲到了一个简单的线性回归模型: 在实际的模型中,我们可以假设线性模型的预测值逼近 而非Y,即: 若 为单调可微函数,则: 上式即被称为广义线性模型 简介 逻辑回归模型可以看做是 ...
- 逻辑斯蒂回归_逻辑回归 - 3 逻辑回归模型
1 逻辑斯蒂回归模型 二项逻辑斯蒂回归模型是一种分类模型,由条件概率分布 表示,形式为参数化的逻辑斯蒂分布,这里随机变量 取值为实数,随机变量 取值为1或-1. 对于给定的输入实例 ,按照上面式可以求 ...
- python逻辑回归_逻辑回归:使用Python的简化方法
逻辑回归的目标是什么? 在逻辑回归中,我们希望根据一个或多个自变量(X)对因变量(Y)进行建模.这是一种分类方法.此算法用于分类的因变量.Y使用一个函数建模,该函数为X的所有值提供0到1之间的输出.在 ...
- python支持向量机回归_支持向量机回归的Scikitlearn网格搜索
我正在学习交叉验证网格搜索,并遇到了这个youtube playlist,教程也作为ipython笔记本上传到了github.我试图在同时搜索多个参数部分重新创建代码,但我使用的不是knn,而是支持向 ...
- lasso回归_线性回归amp;lasso回归amp;岭回归介绍与对比
1. 回顾最小二乘法 详细的解释在以下这个链接 https://www.matongxue.com/madocs/818 简而言之,最小二乘法展现了平方误差值最小的时候,就是最好的拟合回归线. 2. ...
- 预测回归_回归分析预测技术简介
回归分析的基本概念是用一群变量预测另一个变量的方法.通俗点来讲,就是根据几件事情的相关程度来预测另一件事情发生的概率.回归分析的目的是找到一个联系输入变量和输出变量的最优模型. 回归方法有许多种,可通 ...
最新文章
- SRP:The Single-Responsibility Principle
- Python3 系列之 编程规范篇
- mysql 4 基础教程_MySQL基础教程(四):MySQL 管理
- 知乎上不够伪善的内容
- JS实现购物车全选、不选、反选的功能(十七)
- GL中如何让画的点为圆形
- continue 的理解
- Thinkphp5 接口中直接返回数组提示variable type error: array
- 计算机读法综艺中文翻译英语,汉语综艺节目英译字幕组现状初探
- sketch插件 android,用这个免费的 Sketch 插件,帮你完美还原安卓界面!
- VS code react插件快捷键
- 环洋市场咨询:全球OLED收入预计2028年达到502.4亿美元
- 极兔快递电子面单打印API接口-极兔快递
- C6能比C8快多少(Altera的FPGA速度等级)
- python头像转卡通_Python实现将照片变成卡通图片的方法【基于opencv】
- Photoshop 系列:照片调色记录
- 胡昌泽day5_循环语句
- Ubuntu 18.04安装Docker Dashboard
- JS显示团购剩下时间的代码整理
- 》技术应用:大数据产品体系