power bi指标呈现_在Power BI中使用关键绩效指标
power bi指标呈现
In this article, we will learn Key Performance Indicators usage in Power BI and solve a business case problem through Power BI.
在本文中,我们将学习Power BI中的关键绩效指标用法,并通过Power BI解决业务案例问题。
Key Performance Indicators also known as KPI are very efficient indicators that compare any organization target and real performance. Through the KPIs, organizations can evaluate their success at reaching the target. In fact, the main idea of KPI is very simple that is “If you don’t measure it, you can’t manage it”. According to this idea, KPI are crucial metrics for organizations, at the same time we need to track KPI for effective management capability. Such as, if you manage a sales team you have to track monthly sales growth. This KPI measures the sales revenue according to the sales target or compares with the same prior month. With help of these monthly sales Key Performance Indicators, you can get an idea about your sales trend so that you can decide the product prices or campaigns.
关键绩效指标(也称为KPI)是非常有效的指标,用于比较任何组织目标和实际绩效。 通过KPI,组织可以评估其在达到目标方面的成功。 实际上,KPI的主要思想很简单,即“ 如果不进行度量,就无法管理 ”。 根据此想法,KPI是组织的关键指标,与此同时,我们需要跟踪KPI以实现有效的管理能力。 例如,如果您管理销售团队,则必须跟踪每月的销售增长。 该KPI根据销售目标衡量销售收入或与上个月相同。 借助这些月度销售关键绩效指标,您可以了解您的销售趋势,从而可以确定产品价格或广告系列。
On the other hand, business intelligence solutions play key-role for organizations to make decisions about business so we need to virtualize KPIs in business intelligence reports. If we place KPIs in our BI reports or dashboards that offer to track KPIs regularly and assists to take proper decision.
另一方面,商业智能解决方案对于组织做出业务决策具有关键作用,因此我们需要虚拟化商业智能报告中的KPI。 如果我们将KPI放在我们的BI报告或仪表板中,以定期跟踪KPI并有助于做出正确的决定。
After this main description of Key Performance Indicators and getting through the importance of interaction with business intelligence solutions, we can start to talk about how to use KPIs in Power BI. In this article, we will create the demonstration over a production case scenario.
在对关键绩效指标进行了主要描述并了解了与商业智能解决方案进行交互的重要性之后,我们可以开始讨论如何在Power BI中使用KPI。 在本文中,我们将在生产案例场景中创建演示。
Business Case: Assume that you are report writer of a production company and there is a production line which is the vital part of the factory. This production line oil pressure value has to be 80 and this value indicates the optimum performance of the production line. Also, this value is collected one an hour and store into Azure SQL. Production engineers’ wants to track this production line oil pressure in their mobile phones and they also want to observe the last value of selected month and weekly Key Performance Indicators of this production line oil pressure values. After a little meeting with production engineers, you deal a draft design which looks like the below image.
业务案例:假设您是一家生产公司的报告撰稿人,并且有一条生产线是工厂的重要组成部分。 该生产线的油压值必须为80,并且该值表示该生产线的最佳性能。 此外,每小时收集一次此值,并将其存储到Azure SQL中。 生产工程师希望在手机中跟踪该生产线的油压,他们还希望观察该生产线的油压值的所选月份和每周关键性能指标的最后一个值。 与生产工程师会面后,您将获得如下图所示的设计草案。
Demonstration: At first, we need to generate synthetic data in the Azure SQL. The table structure is very simple, it stores oil pressure values and measurement of date. At first, we will create the oil pressure log table through the following T-SQL script.
演示:首先,我们需要在Azure SQL中生成综合数据。 该表的结构非常简单,它存储了油压值和日期的测量值。 首先,我们将通过以下T-SQL脚本创建机油压力日志表。
CREATE TABLE OilpressureLog
(Id Int IDENTITY(1,1) PRIMARY KEY,
ValOilPre INT ,
Dt DATETIME)
And then populate it with test data using a tool like ApexSQL Generate
After this test data preparation step, we will launch the Power BI and connect to Azure SQL database.
在完成此测试数据准备步骤之后,我们将启动Power BI并连接到Azure SQL数据库。
- Click Get Data and then select More… option 单击获取数据,然后选择更多…选项
Click Azure tab and then select Azure SQL database
单击“ Azure”选项卡,然后选择“ Azure SQL数据库”
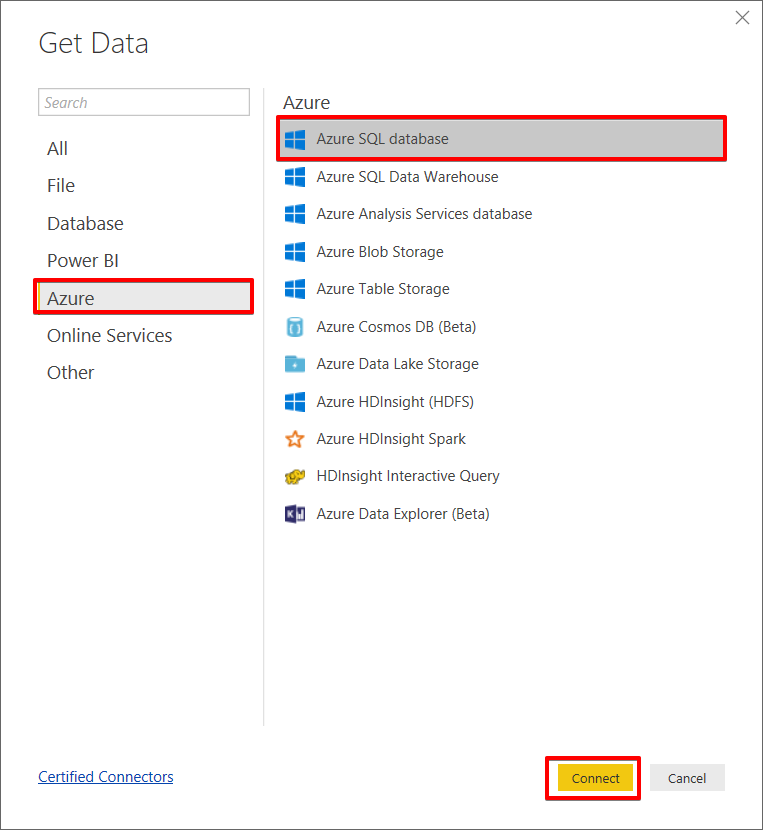
- Click Connect 点击连接
- Set the connection credentials of Azure SQL database 设置Azure SQL数据库的连接凭据
Click OK
点击确定

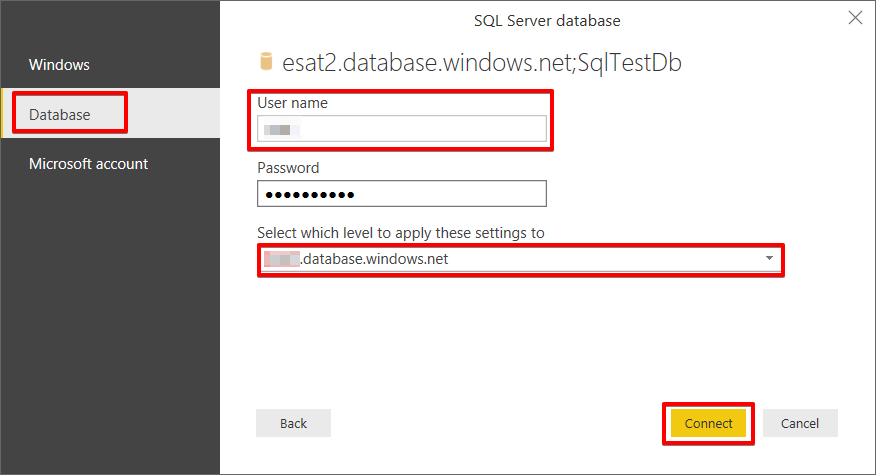
- Select the Database tab and then set the connection credentials of the database 选择数据库选项卡,然后设置数据库的连接凭据
Click Connect
点击连接
After all these steps, Power BI will launch Navigator screen. In this screen, we will choose the OilpressureLog table in order to retrieve data.
完成所有这些步骤后,Power BI将启动“导航器”屏幕。 在此屏幕中,我们将选择 油压日志 表以检索数据。
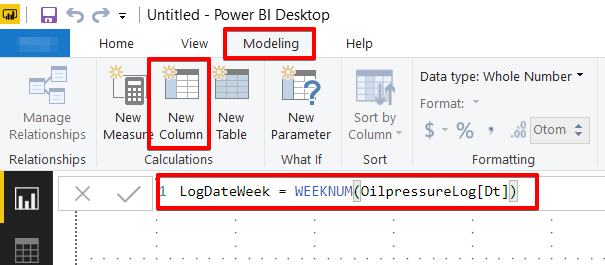
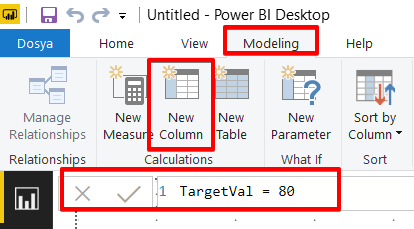
According to our design draft, we will add slicers and this slicer help us to filter month number of year but in our dataset we don’t have any column which indicates this column. At the same time, we need to week of year column to calculate weekly oil pressure Key Performance Indicators. So, we will create two new columns which help to figure out the week of year and month. Select the Modeling tab and add a new column. Write the following DAX (Data Analysis Expressions) expression and this expression will calculate the week of the year.
根据我们的设计草案,我们将添加切片器,并且此切片器将帮助我们过滤年份的月份数,但是在我们的数据集中,没有任何列指示此列。 同时,我们需要在“年度周”列中计算每周油压关键绩效指标。 因此,我们将创建两个新列,以帮助确定年份和月份的星期。 选择“建模”选项卡并添加新列。 编写以下DAX(数据分析表达式)表达式,该表达式将计算一年中的星期。
LogDateWeek = WEEKNUM(OilpressureLog[Dt])
LogDateWeek = WEEKNUM(OilpressureLog [Dt])
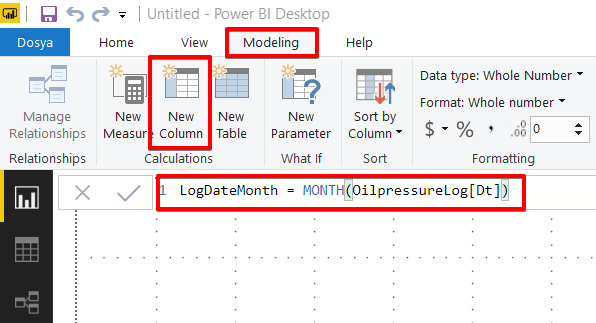
We will repeat the previous step but will only change the DAX expression to calculate month number of year.
我们将重复上一步,但是只会更改DAX表达式以计算年份的月份数。
And then, we will add the target value of oil pressure column. This value is constant therefore we don t need to calculate any think about this value.
然后,我们将添加油压柱的目标值。 该值是恒定的,因此我们无需计算任何对此值的考虑。
Now, we will add the month filter slicer visual.
现在,我们将添加月份过滤器切片器视觉效果。
- Drag and drop slicer visual to Power BI design panel 将切片器视觉效果拖放到Power BI设计面板
Drag and drop LogDateMonth column to Field
将LogDateMonth列拖放到Field
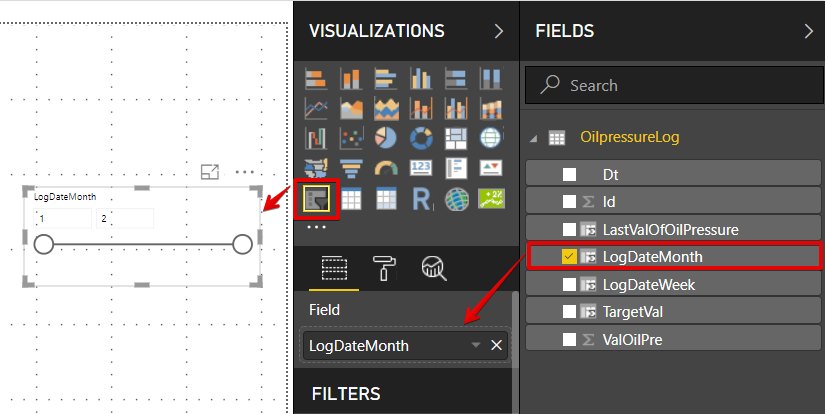
- Hover over the mouse in the right corner of the slicer and then click the small down arrow and then chose the list option 将鼠标悬停在切片器右上角的鼠标上,然后单击小的向下箭头,然后选择列表选项
Now we will add our custom Key Performance Indicators visual from the marketplace.
现在,我们将从市场上添加自定义的关键绩效指标。
- Click Import from marketplace 单击从市场导入
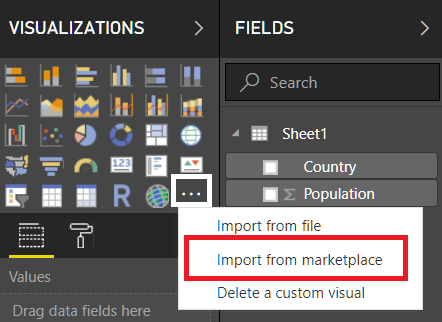
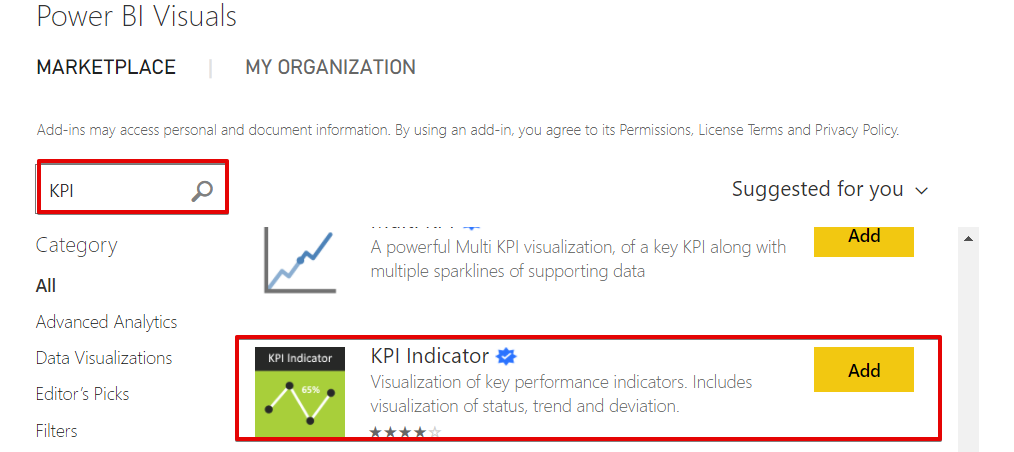
Add custom KPI Indicator from Power BI Visuals marketplace
从Power BI Visuals市场添加自定义KPI指标
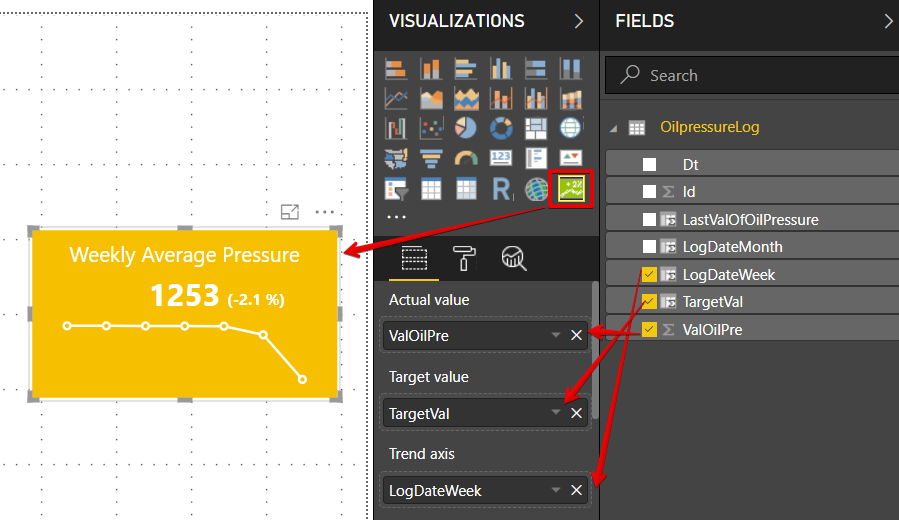
- Drag and drop KPI Indicators visual to design panel 将KPI指标可视化拖放到设计面板
- Set Actual value field to ValOilPre 将实际值字段设置为ValOilPre
- Set Target value field to TargetVal 将目标值字段设置为TargetVal
Set Trend axis field to LogDateWeek
将趋势轴字段设置为LogDateWeek
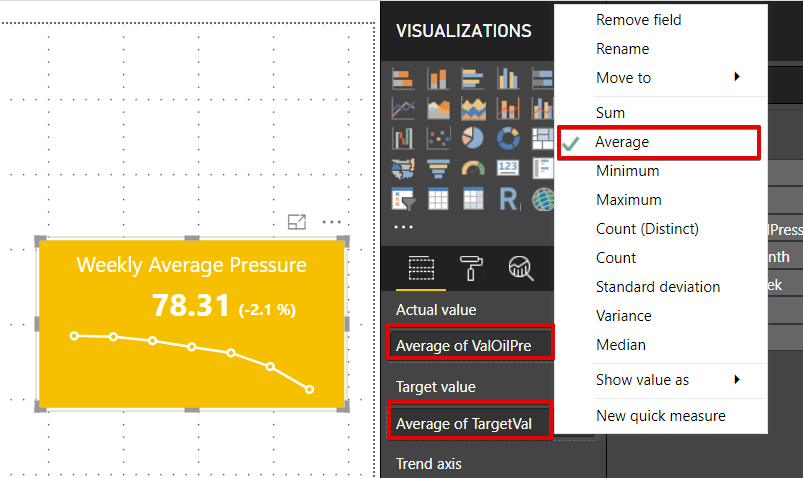
Change the ValOilPre and TargetVal calculation to Average
将ValOilPre和TargetVal计算更改为平均值
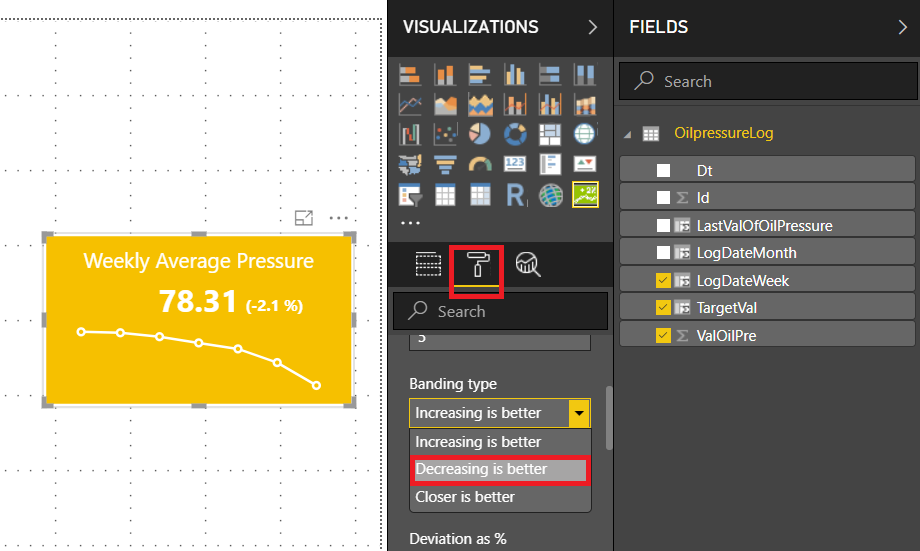
Change the Key Performance Indicators visual Banding Type to closer be better because optimum oil pressure value must be 80 according to our report documentation
根据我们的报告文档,将最佳性能指标的最佳油压值必须为80,将关键性能指标的可视带型更改为更接近更好
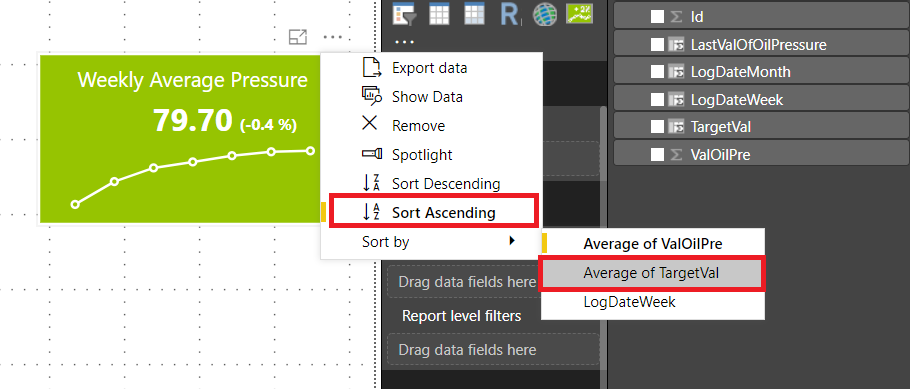
Click the right three point (…) in the right corner of the KPI visual and change the sort of data
单击KPI可视图右上角的右三个点(…),并更改数据的排序
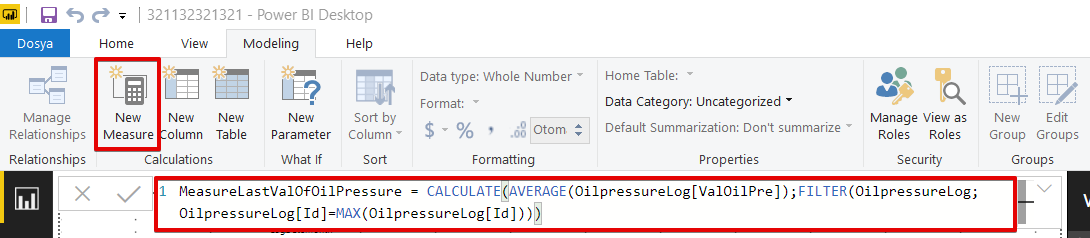
The last need of this Power BI report is the last value of the oil pressure in the selected dataset. In this calculation, we will use the following DAX expression. With help of this DAX, we will figure out the last value of oil pressure. Select the Modelling tab and then we will add LastValOfOilPressure measure.
此Power BI报告的最后一个需求是所选数据集中的机油压力的最后一个值。 在此计算中,我们将使用以下DAX表达式。 借助此DAX,我们将找出油压的最后一个值。 选择建模选项卡,然后我们将添加LastValOfOilPressure度量。
MeasureLastValOfOilPressure = CALCULATE(AVERAGE(OilpressureLog[ValOilPre]);FILTER(OilpressureLog;OilpressureLog[Id]=MAX(OilpressureLog[Id])))
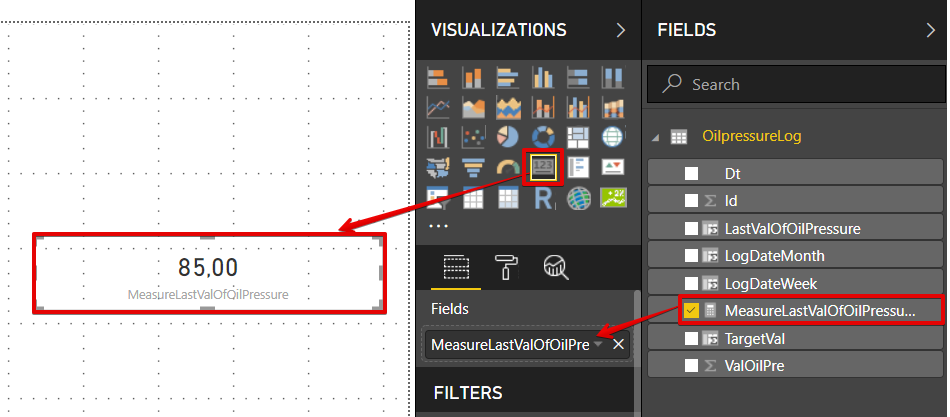
Drag and drop card visual and then set Fields to MeasureLastValOfOilPressure
拖放卡片视觉,然后将字段设置为MeasureLastValOfOilPressure
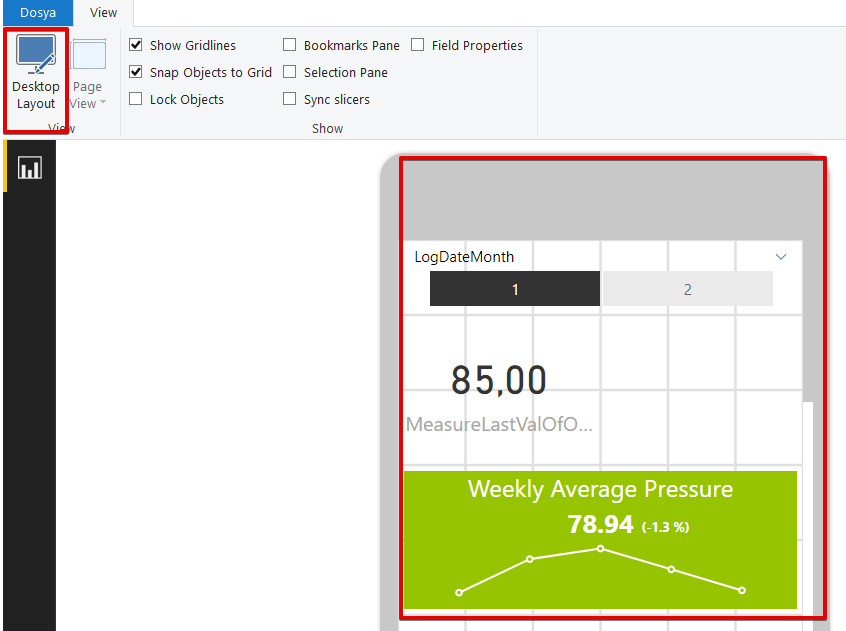
Eventually, all visuals are ready for phone design. We will select the View tab and then select Phone Layout.
最终,所有视觉效果都可以用于手机设计。 我们将选择“视图”选项卡,然后选择“电话布局”。
We will design all visuals which are like the below image and then return to desktop layout.
我们将设计所有如下图所示的视觉效果,然后返回桌面布局。
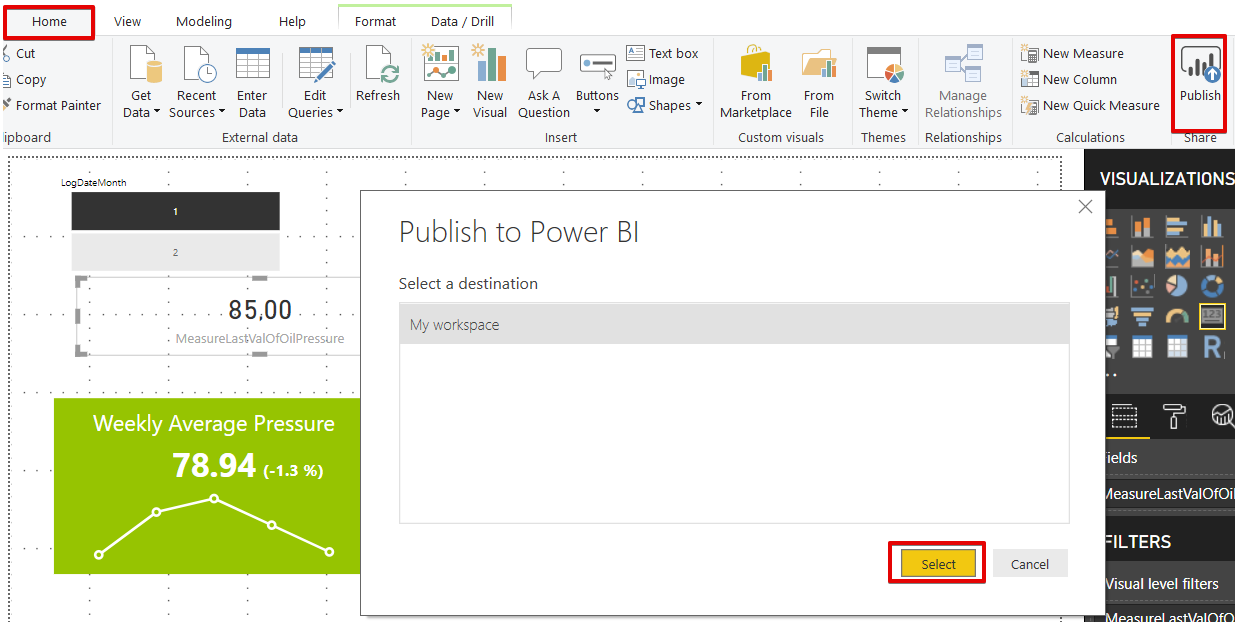
Finally, we will publish our report to Power BI portal.
最后,我们将报告发布到Power BI门户。
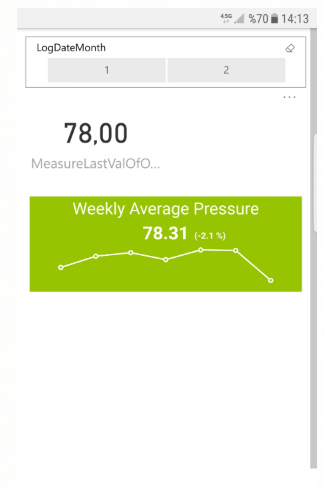
When we download mobile app of Power BI and connect to the Power BI web portal, the report Phone design will look like the below image.
当我们下载Power BI的移动应用程序并连接到Power BI Web门户时,“电话设计”报告将如下图所示。
Summary
摘要
In this article, we mentioned about Key Performance Indicators and how to handle a business case with help of Power BI. Actually the organization more sophisticated than this one but we can find several alternative visual in Power BI Visual Market Place so that we can handle this problem very easily. In addition, we can increase our flexibility through Power BI mobile support.
在本文中,我们提到了关键绩效指标以及如何在Power BI的帮助下处理业务案例。 实际上,该组织比这家组织更复杂,但是我们可以在Power BI Visual Market Place中找到几种替代的视觉,以便我们可以非常轻松地处理此问题。 此外,我们可以通过Power BI移动支持来提高灵活性。
翻译自: https://www.sqlshack.com/use-of-key-performance-indicators-in-power-bi/
power bi指标呈现
power bi指标呈现_在Power BI中使用关键绩效指标相关推荐
- 如何设计KPI指标——关键绩效指标
KPI:关键绩效指标,今年来企业一直关注这个问题,甚至有些公司,比如电信行业员工整天都围绕着KPI指标,什么是KPI呢?关键绩效指标即以定量的指标衡量经营活动的量化结果,一般由客观计算公式得出,并侧重 ...
- SSRS 2012 仪表 -- 关键绩效指标
开车的过程就是驾驶不断收集收集信息以作出正确决策的过程,为了能够让驾驶清楚地理解数值所代表的意义,因此开车时所需要的所有数字,包括速度.里程数.邮箱状况等都被浓缩在驾驶仪表中.在企业报表中,主管们也通 ...
- 关键绩效指标KPI项目
一.术语介绍 --------------------------------------------------------------1.KPI: Key Performance Indicato ...
- 细数各种关键绩效指标KPI
IT服务从传统的注重硬件运行和软件监控转向使用关键绩效指标(KPI)为业务的重点.IT行业的KPI是一个抽象的目标,如用户体验或工作效率. IT服务的KPI指标与常见的监测指标之间的差异是企业领导的参 ...
- ×××S 2012 仪表 -- 关键绩效指标
×××S 2012 仪表 -- 关键绩效指标 开车的过程就是驾驶不断收集收集信息以作出正确决策的过程,为了能够让驾驶清楚地理解数值所代表的意义,因此开车时所需要的所有数字,包括速度.里程数.邮箱状况等 ...
- YOOV人事管理|KPI是什么?把握这5大原则制定有效关键绩效指标
KPI是很多企业用在绩效设定以及绩效考核的一种方式,但是许多主管或是企业,在使用KPI作为关键绩效指标的时候,常常会遇到后续无法检核,或是员工有反弹的困难,YOOV人事管理认为只要把握好5原则,就能把 ...
- ***S 2012 仪表 -- 关键绩效指标
***S 2012 仪表 -- 关键绩效指标 开车的过程就是驾驶不断收集收集信息以作出正确决策的过程,为了能够让驾驶清楚地理解数值所代表的意义,因此开车时所需要的所有数字,包括速度.里程数.邮箱状况等 ...
- 多目标优化中常用的绩效指标(Performance Indicator)(最全概括)
1.Generational Distance (GD) GD绩效指标测量的是得到的解与已知的最优解之间的距离 我们假设得到的解集为A={a1,a2,-,a|A|} ,Pareto前沿为 Z={z1, ...
- 创业公司必看的12个关键绩效指标
对于创始人来说,掌握自家公司的关键绩效指标(即Key Performance Indicator,以下简称KPI)十分必要.因为合理构建起来的KPI体系,能够让公司的管理团队和潜在的投资者准确把握公司 ...
最新文章
- 不同时间段的欢迎语言
- Java多线程(3)--线程的生命周期
- TCP/IP 三次握手
- 蔚来汽车发布声明:“蔚来EC6爆炸”为谣言
- C++ 简单实现unorderset和unordermap
- crt安装mysql教程_Centos系统安装MySQL详细图文教程
- 【渝粤题库】陕西师范大学164105 物流管理学 作业(高起专)
- PHP中面向对象分析设计的经验总结
- Tableau Desktop安装说明
- 奔图打印机驱动linux安装方法,奔图3100打印机驱动
- 拳王公社:虚拟资源项目赚钱方法?前2种最常见,第3种鲜为人知
- 存储,对比私有云和公有云的不同
- 深度学习图像-半自动和自动标注工具
- 魅族mx4 android5.0,第一手更新 魅族MX4Pro安卓5.0抢先体验
- 【运动控制】运动控制卡与PLC的区别
- Python3安装bz2
- Invitation Cards
- 【node】升级 Node 版本教程
- 【区间dp】括号序列再战猪猪侠
- 学习正则前的预备 charCodeAt
热门文章
- c++rpg黑框游戏_c++实现简单RPG对战游戏的代码
- tail怎么写中文_为什么不能用中文进行编程,而英文却可以?程序员的分析很透彻...
- 一、SecureCRT 8.0 客户端连接服务器
- 18、OpenCV Python 简单实现一个图片生成(类似抖音生成字母人像)
- android:id=@android:id/tabhost 、android:id=@+id/llRoot 、android:id=@id/llRoot 之间的区别...
- springMVC get 提交乱码
- Mac. IntelliJ IDEA maven+springmvc添加包时小插曲
- 【博客项目】—用户删除功能(十二)
- synchronized 异常_面试官,别挂电话,Synchronized,我还能说上半小时
- 我们这些中年人,多处在管理层面