分布式日志平台--ELKStack实践
在运维系统中,经常遇到如下情况:
①开发人员不能登录线上服务器查看详细日志
②各个系统都有日志,日志数据分散难以查找
③日志数据量大,查询速度慢,或者数据不够实时
④一个调用会涉及多个系统,难以在这些系统的日志中快速定位数据
我们可以采用目前比较流行的ELKStack来满足以上需求。
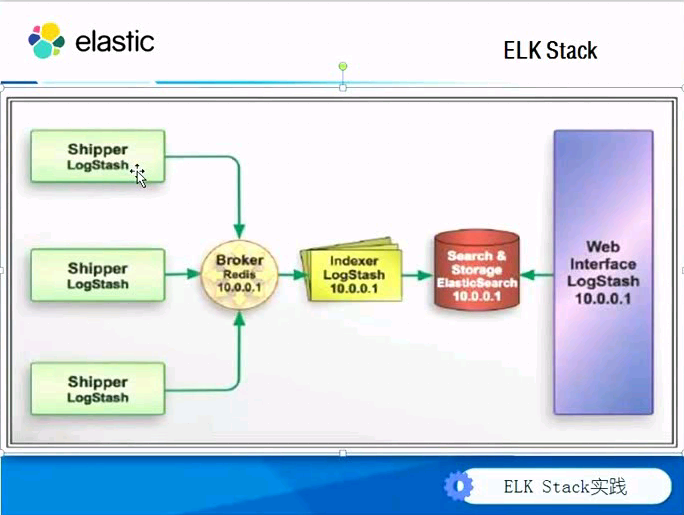
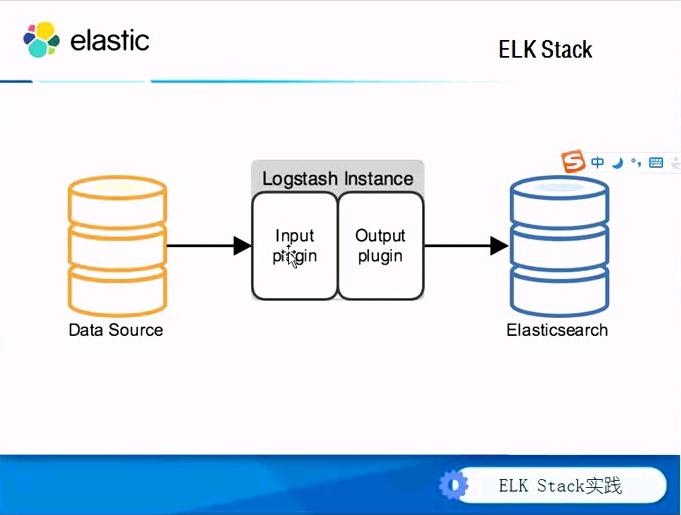
ELK Stack组成部分:

原理流程图如下:
系统环境:
[root@node01 ~]# cat /etc/redhat-release CentOS release 6.4 (Final)[root@node01 ~]# uname -aLinux node01 2.6.32-358.el6.x86_64 #1 SMP Fri Feb 22 00:31:26 UTC 2013 x86_64 x86_64 x86_64 GNU/Linux[root@node01 ~]#
| IP地址 | 运行程序 | 角色 | 备注 |
| 10.0.0.41 | elasticsearch | node01 | |
| 10.0.0.42 | elasticsearch | node02 | |
| 10.0.0.43 | elasticsearch | node03 | |
| 10.0.0.44 | redis kibana | kibana | |
| 10.0.0.9 | nginx logstash | web01 | |
| 10.0.0.10 | logstash | logstash |
实战操作:
①下载安装包安装Java环境以及配置环境变量:
[root@node01 tools]# ll
total 289196
-rw-r--r-- 1 root root 28487351 Mar 24 11:29 elasticsearch-1.7.5.tar.gz
-rw-r--r-- 1 root root 173271626 Mar 24 11:19 jdk-8u45-linux-x64.tar.gz
-rw-r--r-- 1 root root 18560531 Mar 24 11:00 kibana-4.1.6-linux-x64.tar.gz
-rw-r--r-- 1 root root 74433726 Mar 24 11:06 logstash-2.1.3.tar.gz
-rw-r--r-- 1 root root 1375200 Mar 24 11:03 redis-3.0.7.tar.gz
[root@node01 tools]#
安装jdk(在本次实验中所有服务器上做同样的操作安装jdk,这里以node01为例):
[root@node01 tools]# tar xf jdk-8u45-linux-x64.tar.gz
[root@node01 tools]# ll
[root@node01 tools]# mv jdk1.8.0_45 /usr/java/
[root@node01 tools]# vim /etc/profile
export JAVA_HOME=/usr/java/jdk1.8.0_45
export PATH=$JAVA_HOME/bin:$PATH
export CLASSPATH=.:$JAVA_HOME/lib/dt.jar:$JAVA_HOME/lib/tools.jar
[root@node01 ~]#
[root@node01 ~]# source /etc/profile
[root@node01 ~]# java -version
java version "1.8.0_45"
Java(TM) SE Runtime Environment (build 1.8.0_45-b14)
Java HotSpot(TM) 64-Bit Server VM (build 25.45-b02, mixed mode)
[root@node01 ~]#
②安装配置elasticsearch(node01、node02、node03上做同样操作)
[root@node01 tools]# tar xf elasticsearch-1.7.5.tar.gz
[root@node01 tools]# mv elasticsearch-1.7.5 /usr/local/elasticsearch
[root@node01 tools]#
[root@node01 tools]# cd /usr/local/elasticsearch/
[root@node01 elasticsearch]# ll
total 40
drwxr-xr-x 2 root root 4096 Mar 24 11:34 bin
drwxr-xr-x 2 root root 4096 Mar 24 11:34 config
drwxr-xr-x 3 root root 4096 Mar 24 11:34 lib
-rw-rw-r-- 1 root root 11358 Feb 2 17:24 LICENSE.txt
-rw-rw-r-- 1 root root 150 Feb 2 17:24 NOTICE.txt
-rw-rw-r-- 1 root root 8700 Feb 2 17:24 README.textile
[root@node01 elasticsearch]#
[root@node01 elasticsearch]# cd config/
[root@node01 config]# ll
total 20
-rw-rw-r-- 1 root root 13476 Feb 2 17:24 elasticsearch.yml
-rw-rw-r-- 1 root root 2054 Feb 2 17:24 logging.yml
[root@node01 config]#
修改配置文件如下:
[root@node01 config]#
[root@node01 config]# grep -vE '^#|^$' elasticsearch.yml
cluster.name: elasticsearch
node.name: "node01"
node.master: true
node.data: true
index.number_of_shards: 5
index.number_of_replicas: 1
path.conf: /usr/local/elasticsearch/config
path.data: /usr/local/elasticsearch/data
path.work: /usr/local/elasticsearch/work
path.logs: /usr/local/elasticsearch/logs
path.plugins: /usr/local/elasticsearch/plugins
bootstrap.mlockall: true
[root@node01 config]#
创建对应的目录:
[root@node01 elasticsearch]# mkdir -p /usr/local/elasticsearch/{data,work,logs,plugins}
[root@node01 elasticsearch]# ll
total 56
drwxr-xr-x 2 root root 4096 Mar 24 11:34 bin
drwxr-xr-x 2 root root 4096 Mar 24 12:52 config
drwxr-xr-x 3 root root 4096 Mar 24 12:51 data
drwxr-xr-x 3 root root 4096 Mar 24 11:34 lib
-rw-rw-r-- 1 root root 11358 Feb 2 17:24 LICENSE.txt
drwxr-xr-x 2 root root 4096 Mar 24 13:00 logs
-rw-rw-r-- 1 root root 150 Feb 2 17:24 NOTICE.txt
drwxr-xr-x 2 root root 4096 Mar 24 13:01 plugins
-rw-rw-r-- 1 root root 8700 Feb 2 17:24 README.textile
drwxr-xr-x 2 root root 4096 Mar 24 13:00 work
[root@node01 elasticsearch]#
③启动elasticsearch服务
[root@node01 elasticsearch]# pwd
/usr/local/elasticsearch
[root@node01 elasticsearch]# ll
total 44
drwxr-xr-x 2 root root 4096 Mar 24 11:34 bin
drwxr-xr-x 2 root root 4096 Mar 24 12:52 config
drwxr-xr-x 3 root root 4096 Mar 24 12:51 data
drwxr-xr-x 3 root root 4096 Mar 24 11:34 lib
-rw-rw-r-- 1 root root 11358 Feb 2 17:24 LICENSE.txt
-rw-rw-r-- 1 root root 150 Feb 2 17:24 NOTICE.txt
-rw-rw-r-- 1 root root 8700 Feb 2 17:24 README.textile
[root@node01 elasticsearch]# /usr/local/elasticsearch/bin/elasticsearch
[root@node01 elasticsearch]
如果要elasticsearch在后台运行则只需要添加-d,即:
[root@node01 elasticsearch]# /usr/local/elasticsearch/bin/elasticsearch -d
启动之后查看端口状态:
[root@node01 elasticsearch]# netstat -lpnut|grep java
tcp 0 0 :::9300 :::* LISTEN 26868/java
tcp 0 0 :::9200 :::* LISTEN 26868/java
udp 0 0 :::54328 :::* LISTEN 26868/java
[root@node01 elasticsearch]#
访问查看状态信息:
[root@node01 elasticsearch]# curl http://10.0.0.41:9200
{
"status" : 200,
"name" : "node01",
"cluster_name" : "elasticsearch",
"version" : {
"number" : "1.7.5",
"build_hash" : "00f95f4ffca6de89d68b7ccaf80d148f1f70e4d4",
"build_timestamp" : "2016-02-02T09:55:30Z",
"build_snapshot" : false,
"lucene_version" : "4.10.4"
},
"tagline" : "You Know, for Search"
}
[root@node01 elasticsearch]#
④管理elasticsearch服务的脚本(该部分可选)
[root@node01 elasticsearch]# git clone https://github.com/elastic/elasticsearch-servicewrapper
Initialized empty Git repository in /usr/local/elasticsearch/elasticsearch-servicewrapper/.git/
remote: Counting objects: 184, done.
remote: Total 184 (delta 0), reused 0 (delta 0), pack-reused 184
Receiving objects: 100% (184/184), 4.55 MiB | 46 KiB/s, done.
Resolving deltas: 100% (53/53), done.
[root@node01 elasticsearch]#
[root@node01 elasticsearch]# mv elasticsearch-servicewrapper/service/ /usr/local/elasticsearch/bin/
[root@node01 elasticsearch]# /usr/local/elasticsearch/bin/service/elasticsearch
Usage: /usr/local/elasticsearch/bin/service/elasticsearch [ console | start | stop | restart | condrestart | status | install | remove | dump ]
Commands:
console Launch in the current console.
start Start in the background as a daemon process.
stop Stop if running as a daemon or in another console.
restart Stop if running and then start.
condrestart Restart only if already running.
status Query the current status.
install Install to start automatically when system boots.
remove Uninstall.
dump Request a Java thread dump if running.
[root@node01 elasticsearch]#
根据提示,这里我们将其安装到系统启动项中:
[root@node01 elasticsearch]# /usr/local/elasticsearch/bin/service/elasticsearch install
Detected RHEL or Fedora:
Installing the Elasticsearch daemon..
[root@node01 elasticsearch]# chkconfig --list|grep elas
elasticsearch 0:off 1:off 2:on 3:on 4:on 5:on 6:off
[root@node01 elasticsearch]#
通过service命令来启动elasticsearch服务
[root@node01 logs]# service elasticsearch start
Starting Elasticsearch...
Waiting for Elasticsearch......
running: PID:28084
[root@node01 logs]#
如果启动报错,即输入如下内容:
[root@node01 service]# service elasticsearch start
Starting Elasticsearch...
Waiting for Elasticsearch......................
WARNING: Elasticsearch may have failed to start.
通过启动日志排查问题:
[root@node01 logs]# pwd
/usr/local/elasticsearch/logs
[root@node01 logs]# ll
total 4
-rw-r--r-- 1 root root 3909 Mar 24 13:32 service.log
[root@node01 logs]# cat service.log
The configured wrapper.java.command could not be found, attempting to launch anyway: java
Launching a JVM...
VM...
jvm 3 | VM...
wrapper |
wrapper | ------------------------------------------------------------------------
wrapper | Advice:
wrapper | Usually when the Wrapper fails to start the JVM process, it is because
wrapper | of a problem with the value of the configured Java command. Currently:
wrapper | wrapper.java.command=java
wrapper | Please make sure that the PATH or any other referenced environment
wrapper | variables are correctly defined for the current environment.
wrapper | ------------------------------------------------------------------------
wrapper |
wrapper | The configured wrapper.java.command could not be found, attempting to launch anyway: java
wrapper | Launching a JVM...
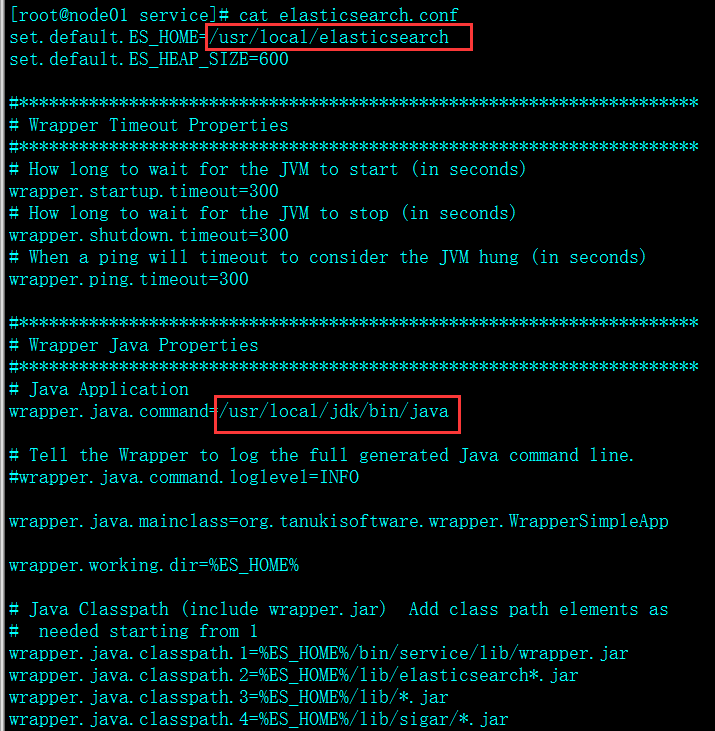
根据上述提示,根据实际配置环境将对应参数修改为红色部分,然后重启
[root@node01 service]# pwd
[root@node01 service]#
[root@node01 service]# ll elasticsearch.conf
-rw-r--r-- 1 root root 4768 Mar 24 13:32 elasticsearch.conf
[root@node01 service]#
[root@node01 logs]# service elasticsearch start
Starting Elasticsearch...
Waiting for Elasticsearch......
running: PID:28084
[root@node01 logs]#
检查启动状态:
[root@node01 service]# netstat -lnput
Active Internet connections (only servers)
Proto Recv-Q Send-Q Local Address Foreign Address State PID/Program name
tcp 0 0 0.0.0.0:22 0.0.0.0:* LISTEN 968/sshd
tcp 0 0 127.0.0.1:32000 0.0.0.0:* LISTEN 28086/java
tcp 0 0 :::9300 :::* LISTEN 28086/java
tcp 0 0 :::22 :::* LISTEN 968/sshd
tcp 0 0 :::9200 :::* LISTEN 28086/java
udp 0 0 :::54328 :::* 28086/java
[root@node01 service]# curl http://10.0.0.41:9200
{
"status" : 200,
"name" : "node01",
"cluster_name" : "elasticsearch",
"version" : {
"number" : "1.7.5",
"build_hash" : "00f95f4ffca6de89d68b7ccaf80d148f1f70e4d4",
"build_timestamp" : "2016-02-02T09:55:30Z",
"build_snapshot" : false,
"lucene_version" : "4.10.4"
},
"tagline" : "You Know, for Search"
}
[root@node01 service]#
⑤JAVA API
node client
Transport client
⑥RESTful API
⑦javascript,.NET,PHP,Perl,Python,Ruby
查询例子:
[root@node01 service]# curl -XGET 'http://10.0.0.41:9200/_count?pretty' -d {"query":{"match_all":{}}}
{
"count" : 0,
"_shards" : {
"total" : 0,
"successful" : 0,
"failed" : 0
}
}
[root@node01 service]#
插件能额外扩展elasticsearch功能,提供各类功能等等。有三种类型的插件:
1. java插件
只包含JAR文件,必须在集群中每个节点上安装而且需要重启才能使插件生效。
2. 网站插件
这类插件包含静态web内容,如js、css、html等等,可以直接从elasticsearch服务,如head插件。只需在一个节点上安装,不需要重启服务。可以通过下面的URL访问,如:http://node-ip:9200/_plugin/plugin_name
3. 混合插件
顾名思义,就是包含上面两种的插件。
安装elasticsearch插件Marvel:
[root@node01 service]# /usr/local/elasticsearch/bin/plugin -i elasticsearch/marvel/latest
-> Installing elasticsearch/marvel/latest...
Trying http://download.elasticsearch.org/elasticsearch/marvel/marvel-latest.zip...
Downloading ....................................................................................................................................................................................................................................................................................................................................................DONE
Installed elasticsearch/marvel/latest into /usr/local/elasticsearch/plugins/marvel
[root@node01 service]#
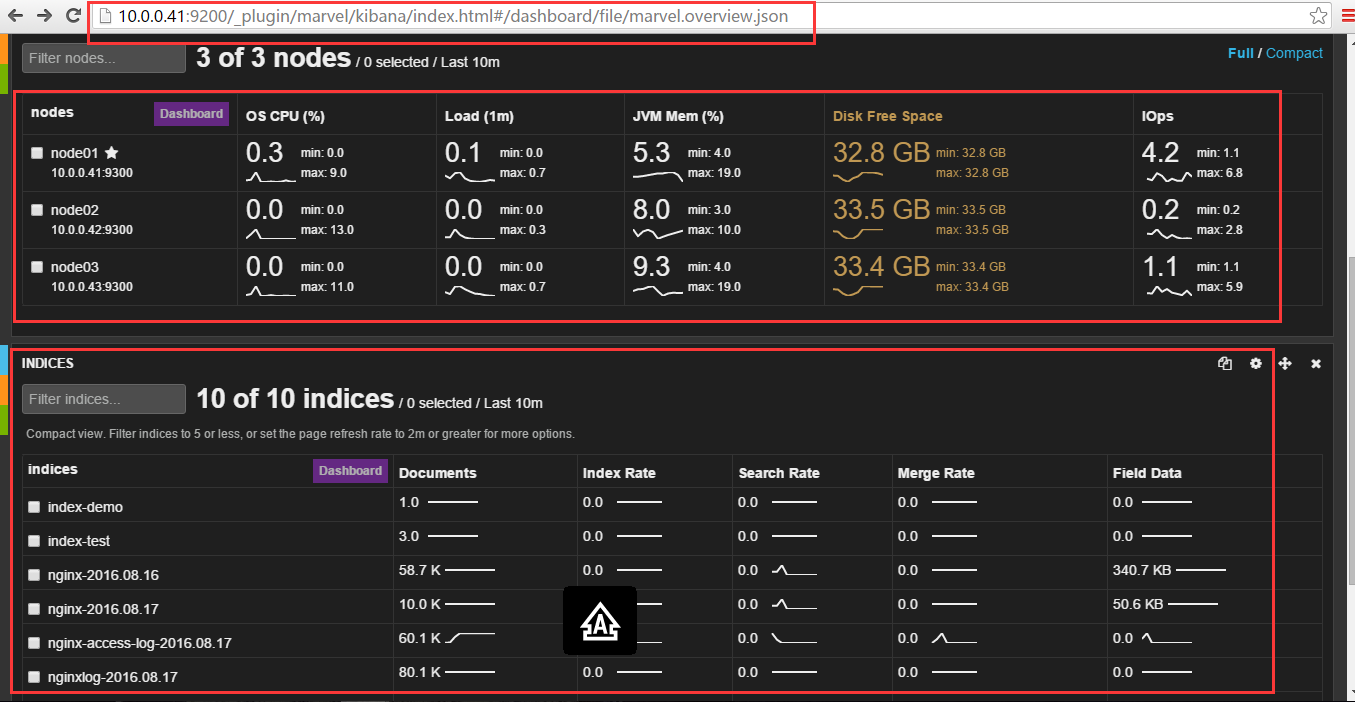
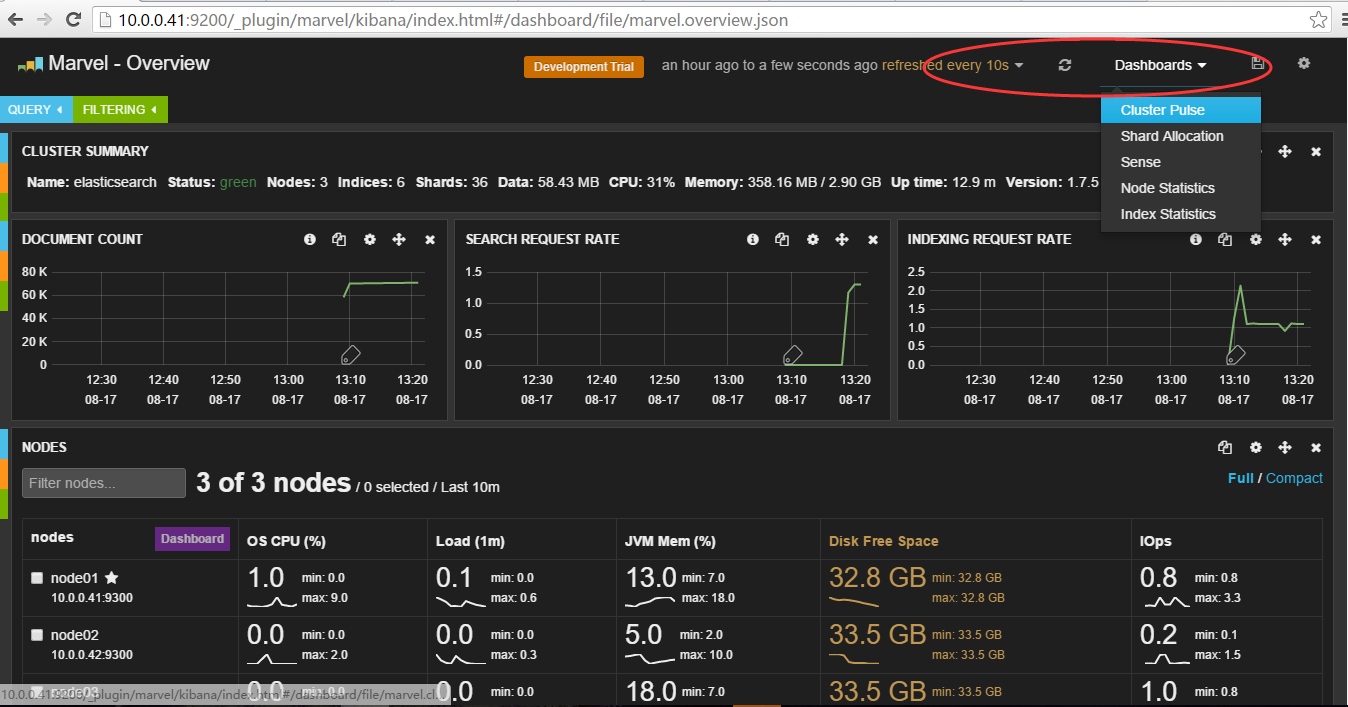
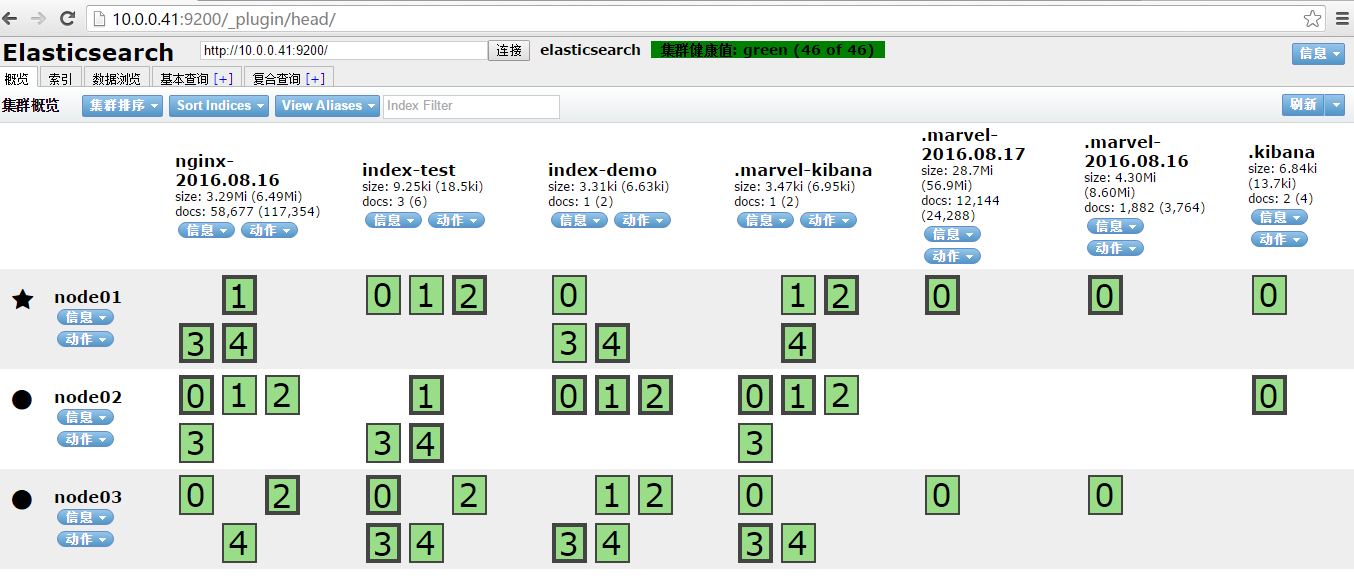
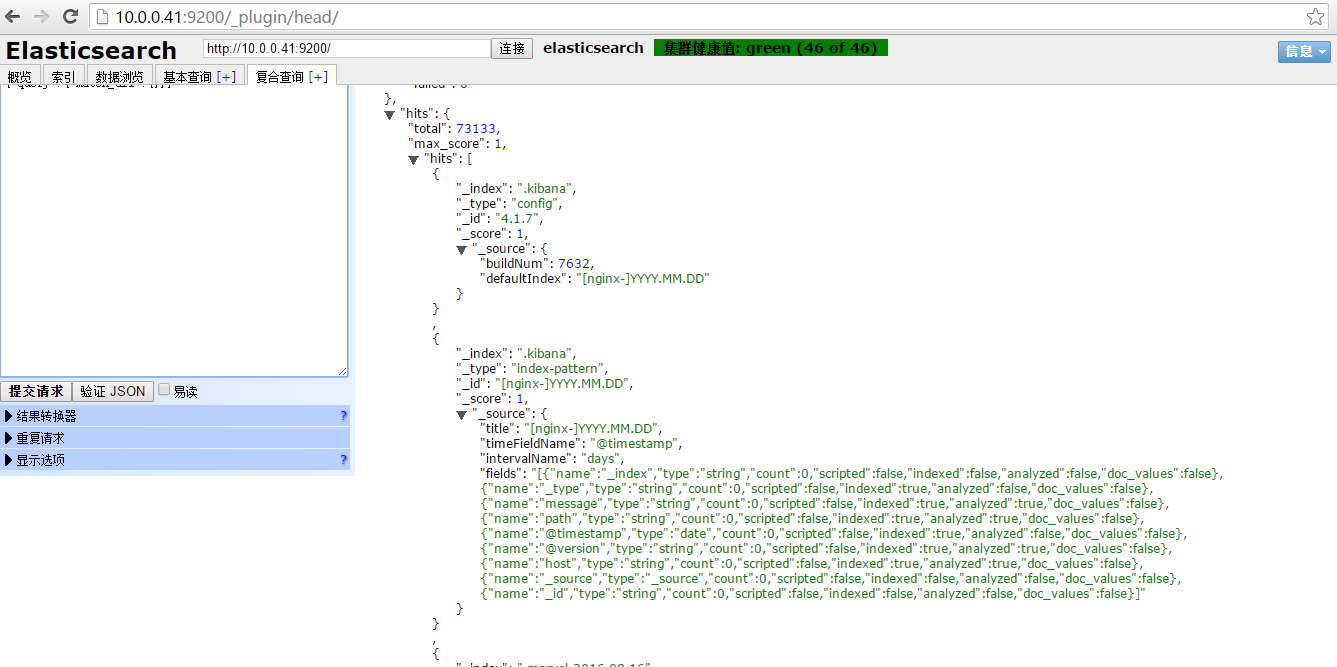
安装完成之后通过浏览器访问查看集群状况:
http://10.0.0.41:9200/_plugin/marvel/kibana/index.html#/dashboard/file/marvel.overview.json
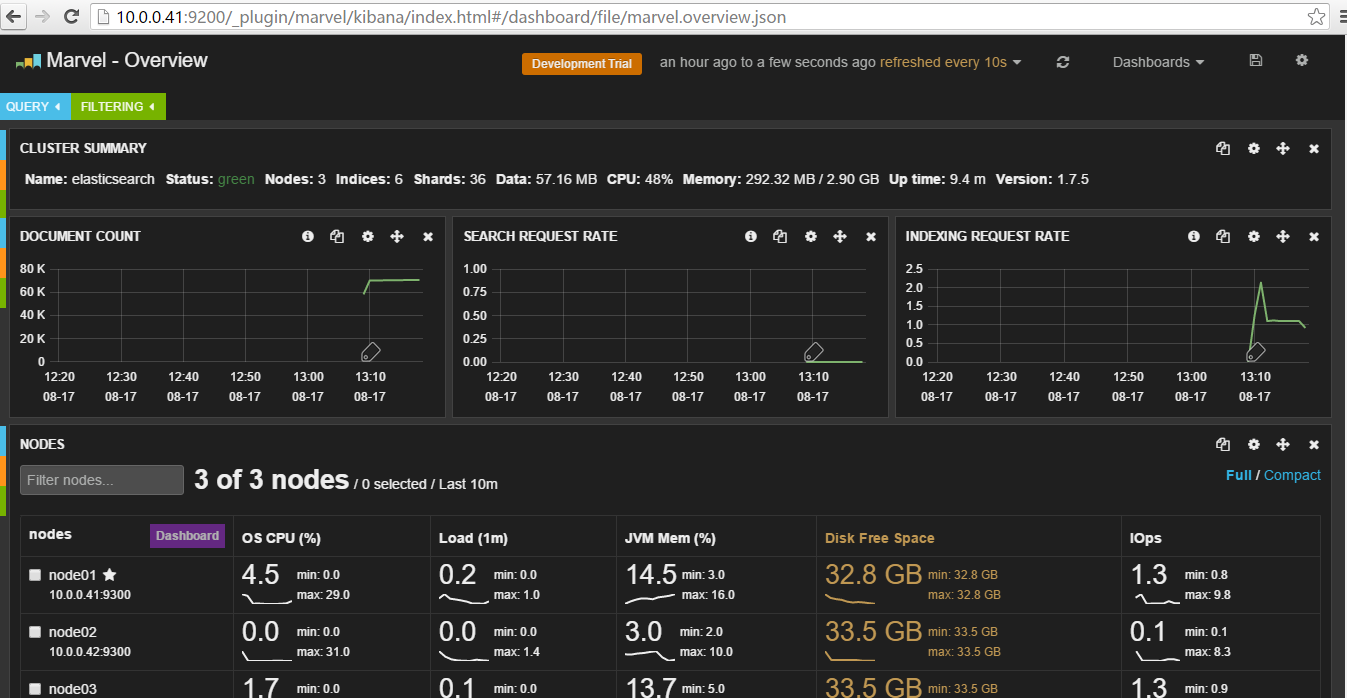
下面是集群节点和索引状况:
选择Dashboards菜单:
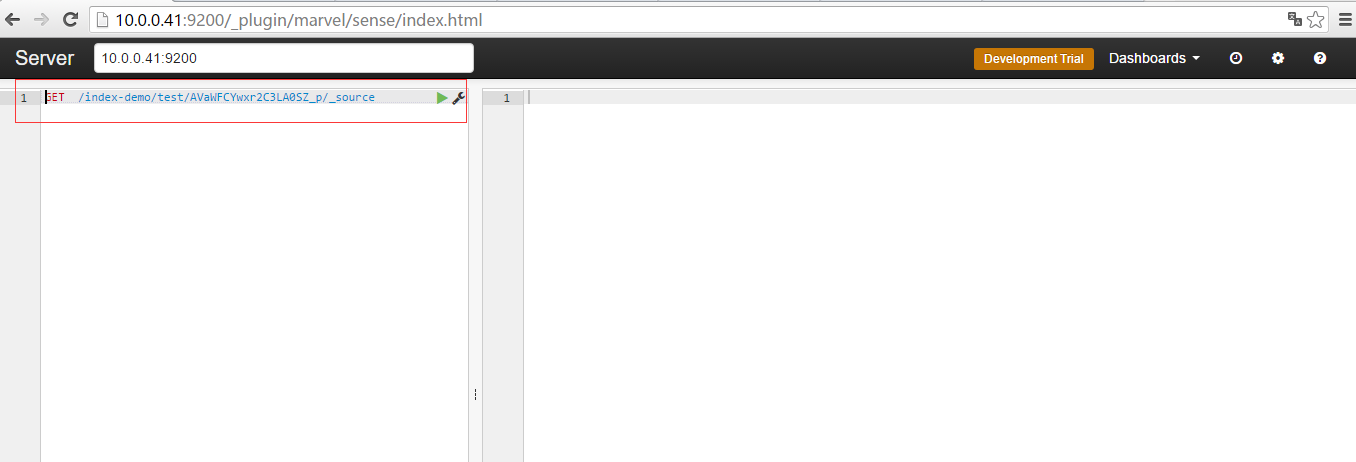
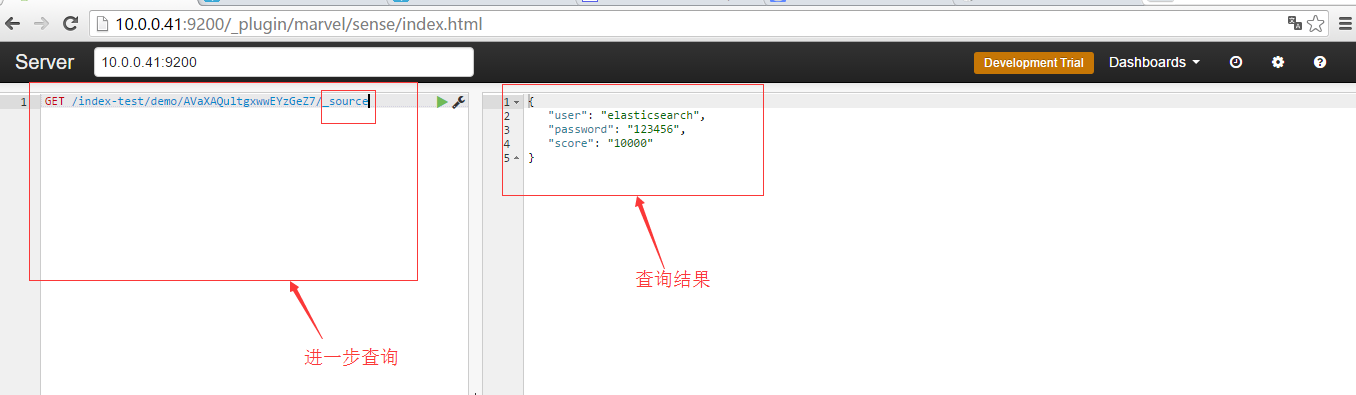
点击sense进入如下界面:
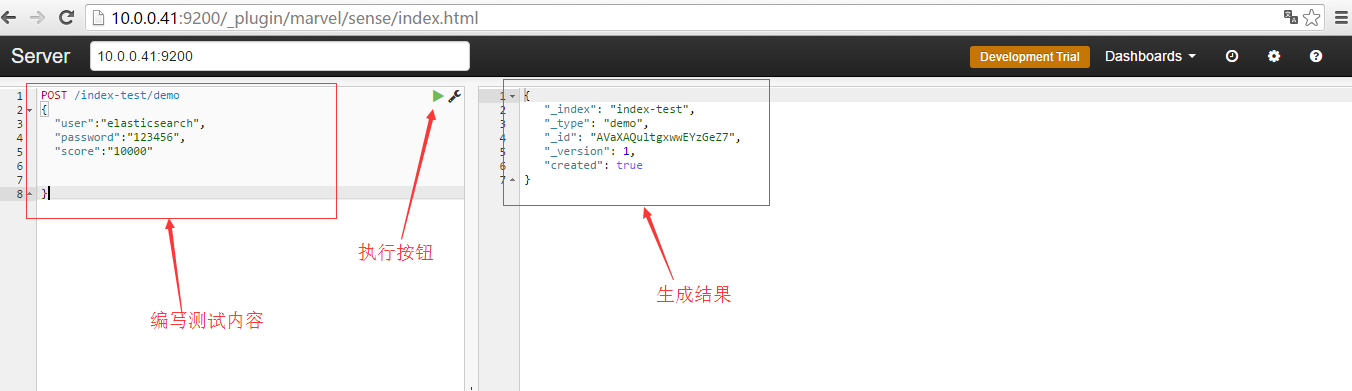
编写测试内容:
 记录右边生成的id,然后在左边通过id进行查询
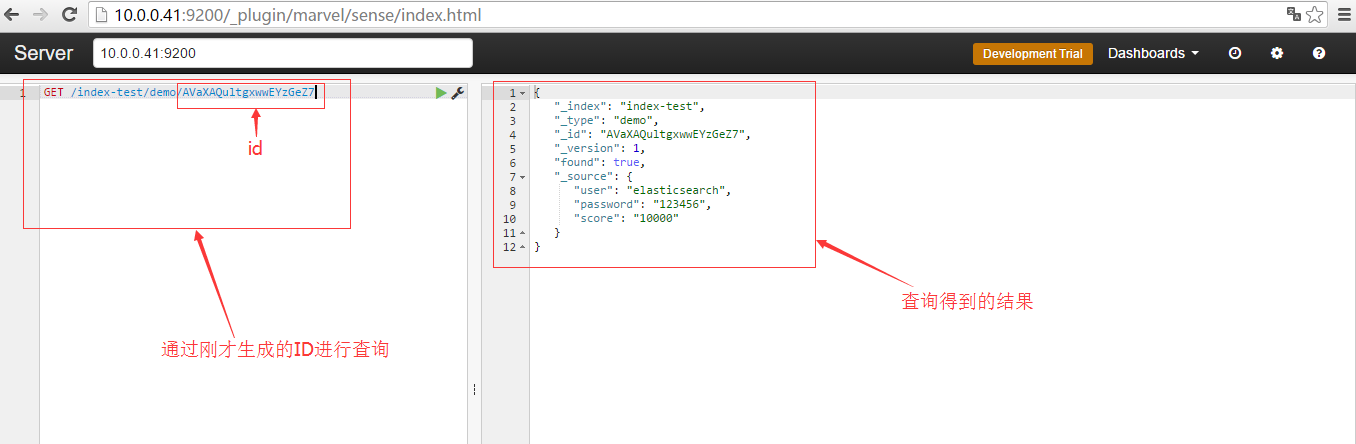
如果要进一步查询,则可以做如下操作:
⑧集群管理插件安装
[root@node01 service]# /usr/local/elasticsearch/bin/plugin -i elasticsearch/marvel/latest
-> Installing elasticsearch/marvel/latest...
Trying http://download.elasticsearch.org/elasticsearch/marvel/marvel-latest.zip...
Downloading ....................................................................................................................................................................................................................................................................................................................................................DONE
Installed elasticsearch/marvel/latest into /usr/local/elasticsearch/plugins/marvel
[root@node01 service]# /usr/local/elasticsearch/bin/plugin -i mobz/elasticsearch-head
-> Installing mobz/elasticsearch-head...
Trying https://github.com/mobz/elasticsearch-head/archive/master.zip...
Downloading ...................................................................................................................................................................................................................................................................................DONE
Installed mobz/elasticsearch-head into /usr/local/elasticsearch/plugins/head
[root@node01 service]#
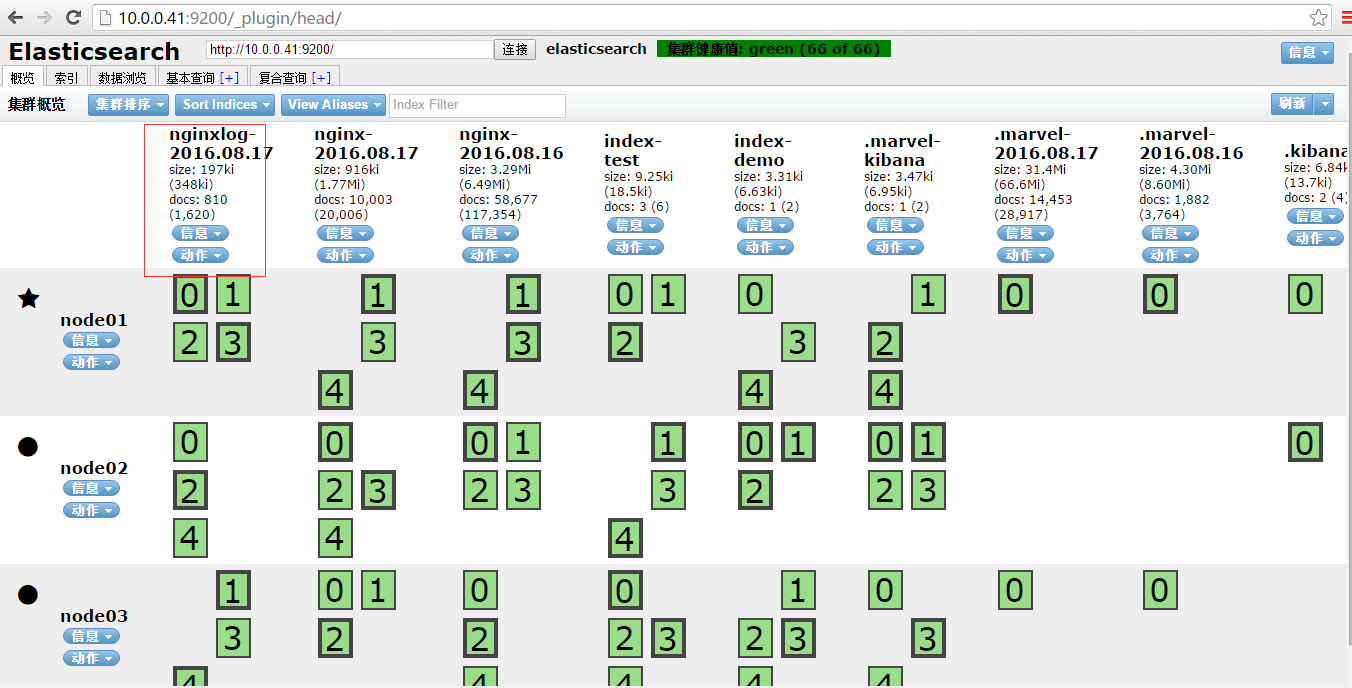
安装完成后,通过浏览器访问:
http://10.0.0.41:9200/_plugin/head/
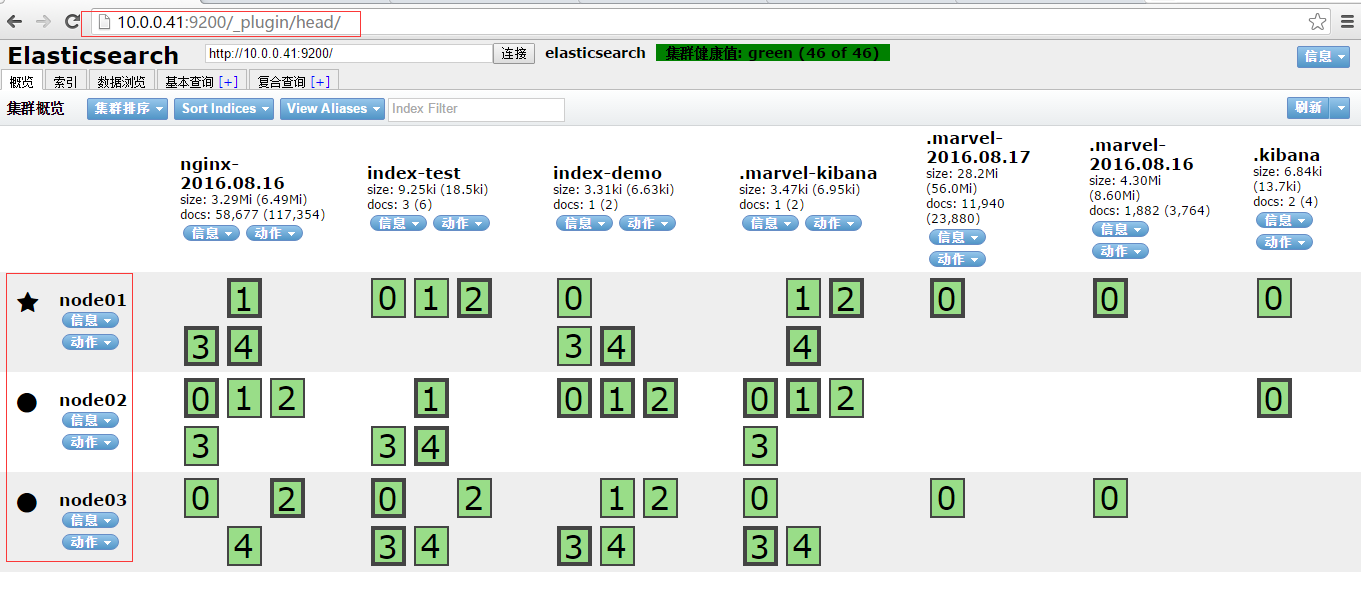
部署另外一个节点node02,需要在elasticsearch的配置文件中修改node.name: "node02"即可,其他与node01保持一致
[root@node02 tools]# cd
[root@node02 ~]# grep '^[a-z]' /usr/local/elasticsearch/config/elasticsearch.yml
cluster.name: elasticsearch
node.name: "node02"
node.master: true
node.data: true
index.number_of_shards: 5
index.number_of_replicas: 1
path.conf: /usr/local/elasticsearch/config
path.data: /usr/local/elasticsearch/data
path.work: /usr/local/elasticsearch/work
path.logs: /usr/local/elasticsearch/logs
path.plugins: /usr/local/elasticsearch/plugins
bootstrap.mlockall: true
[root@node02 ~]#
[root@node02 ~]# mkdir -p /usr/local/elasticsearch/{data,work,logs.plugins}
[root@node02 ~]# ll /usr/local/elasticsearch/
total 56
drwxr-xr-x 2 root root 4096 Mar 24 14:23 bin
drwxr-xr-x 2 root root 4096 Mar 24 14:23 config
drwxr-xr-x 2 root root 4096 Mar 24 14:31 data
drwxr-xr-x 4 root root 4096 Mar 24 14:27 elasticsearch-servicewrapper
drwxr-xr-x 3 root root 4096 Mar 24 14:23 lib
-rw-rw-r-- 1 root root 11358 Feb 2 17:24 LICENSE.txt
drwxr-xr-x 2 root root 4096 Mar 24 14:31 logs.plugins
-rw-rw-r-- 1 root root 150 Feb 2 17:24 NOTICE.txt
-rw-rw-r-- 1 root root 8700 Feb 2 17:24 README.textile
drwxr-xr-x 2 root root 4096 Mar 24 14:31 work
[root@node02 ~]#
安装管理elasticsearch的管理工具elasticsearch-servicewrapper
[root@node02 elasticsearch]# git clone https://github.com/elastic/elasticsearch-servicewrapper
Initialized empty Git repository in /usr/local/elasticsearch/elasticsearch-servicewrapper/.git/
remote: Counting objects: 184, done.
remote: Total 184 (delta 0), reused 0 (delta 0), pack-reused 184
Receiving objects: 100% (184/184), 4.55 MiB | 10 KiB/s, done.
Resolving deltas: 100% (53/53), done.
[[root@node02 elasticsearch]# ll
total 80
drwxr-xr-x 3 root root 4096 Mar 24 14:33 bin
drwxr-xr-x 2 root root 4096 Mar 24 14:23 config
drwxr-xr-x 2 root root 4096 Mar 24 14:31 data
drwxr-xr-x 3 root root 4096 Mar 24 14:33 elasticsearch-servicewrapper
drwxr-xr-x 3 root root 4096 Mar 24 14:23 lib
-rw-rw-r-- 1 root root 11358 Feb 2 17:24 LICENSE.txt
drwxr-xr-x 2 root root 4096 Mar 24 14:31 logs
-rw-rw-r-- 1 root root 150 Feb 2 17:24 NOTICE.txt
drwxr-xr-x 2 root root 4096 Mar 24 14:36 plugins
-rw-rw-r-- 1 root root 8700 Feb 2 17:24 README.textile
drwxr-xr-x 2 root root 4096 Mar 24 14:31 work
-rw-r--r-- 1 root root 18208 Mar 24 14:35 wrapper.log
[root@node02 elasticsearch]#
[root@node02 elasticsearch]# mv elasticsearch-servicewrapper/service /usr/local/elasticsearch/bin/
[root@node02 elasticsearch]# /usr/local/elasticsearch/bin/service/elasticsearch
Usage: /usr/local/elasticsearch/bin/service/elasticsearch [ console | start | stop | restart | condrestart | status | install | remove | dump ]
Commands:
console Launch in the current console.
start Start in the background as a daemon process.
stop Stop if running as a daemon or in another console.
restart Stop if running and then start.
condrestart Restart only if already running.
status Query the current status.
install Install to start automatically when system boots.
remove Uninstall.
dump Request a Java thread dump if running.
[root@node02 elasticsearch]# /usr/local/elasticsearch/bin/service/elasticsearch install
Detected RHEL or Fedora:
Installing the Elasticsearch daemon..
[root@node02 elasticsearch]# /etc/init.d/elasticsearch start
Starting Elasticsearch...
Waiting for Elasticsearch..........................
running: PID:26753
[root@node02 elasticsearch]#
[root@node02 service]# pwd
/usr/local/elasticsearch/bin/service
[root@node02 service]# vim elasticsearch.conf

提示:set.default.ES_HEAP_SIZE值设置小于服务器的物理内存,不能等于实际的内存,否则就会启动失败
接上操作,刷新 http://10.0.0.42:9200/_plugin/head/
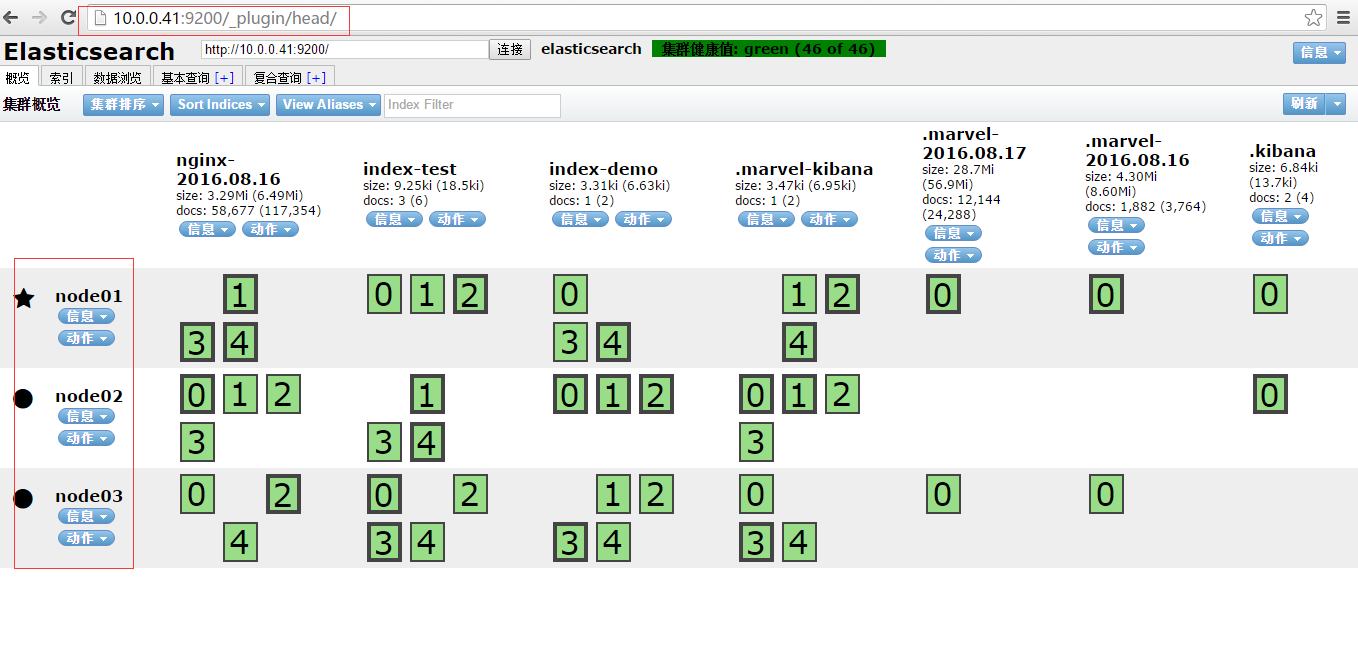
查看node01的信息:
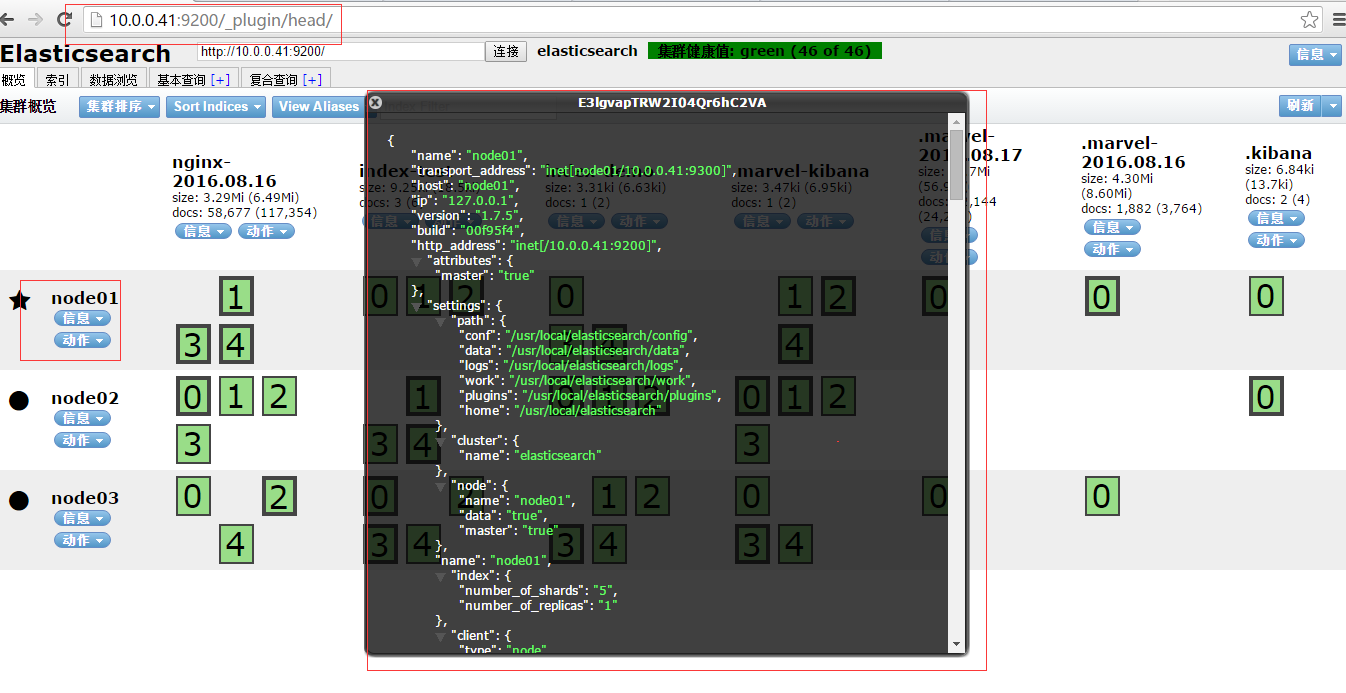
概览:
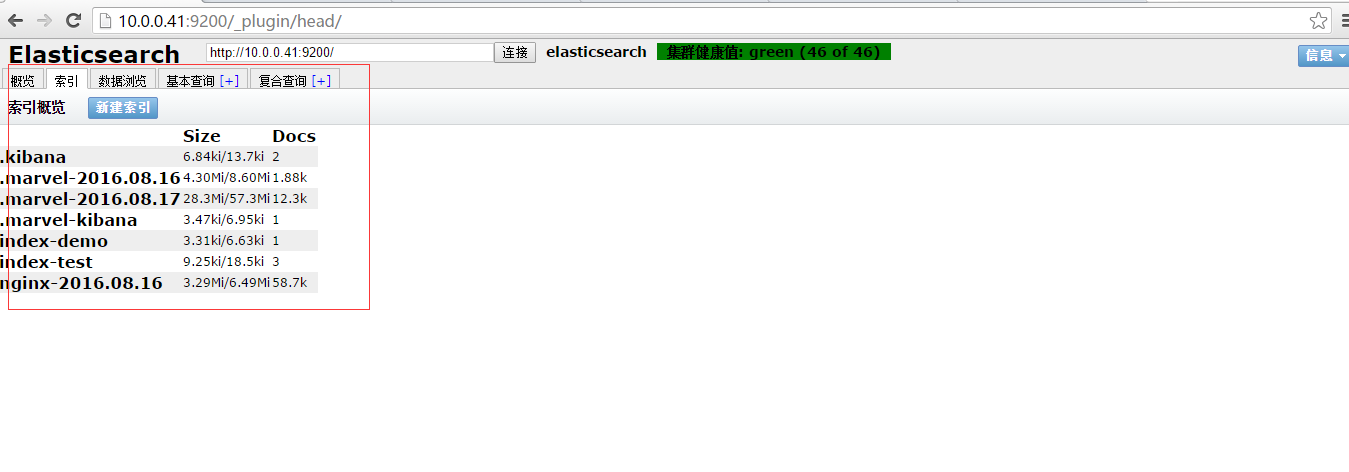
索引:
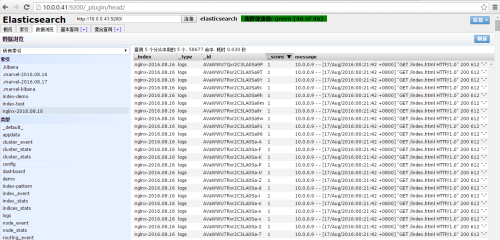
数据浏览:
基本信息:
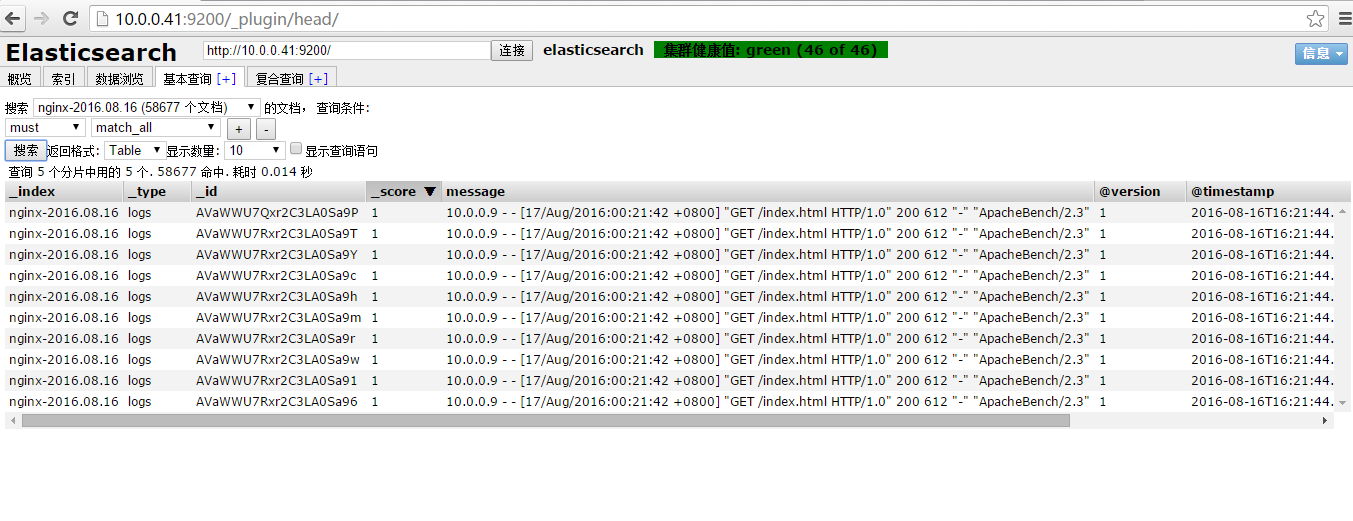
符合查询:
以上步骤在上述三个节点node01、node02、node03中分别执行
logstash快速入门
官方建议yum安装:
Download and install the public signing key:
rpm --import https://packages.elastic.co/GPG-KEY-elasticsearch
Add the following in your /etc/yum.repos.d/ directory in a file with a .repo suffix, for example logstash.repo
[logstash-2.2]
name=Logstash repository for 2.2.x packages
baseurl=http://packages.elastic.co/logstash/2.2/centos
gpgcheck=1
gpgkey=http://packages.elastic.co/GPG-KEY-elasticsearch
enabled=1
And your repository is ready for use. You can install it with:
yum install logstash
![]()
我这里采用源码解压安装: web01上部署nginx和logstash
[root@web01 tools]# tar xf logstash-2.1.3.tar.gz
[root@web01 tools]# mv logstash-2.1.3 /usr/local/logstash
[root@web01 tools]# cd /usr/local/logstash/
[root@web01 logstash]# ll
total 152
drwxr-xr-x 2 root root 4096 Mar 24 15:50 bin
-rw-rw-r-- 1 root root 100805 Feb 17 05:00 CHANGELOG.md
-rw-rw-r-- 1 root root 2249 Feb 17 05:00 CONTRIBUTORS
-rw-rw-r-- 1 root root 3771 Feb 17 05:05 Gemfile
-rw-rw-r-- 1 root root 21970 Feb 17 05:00 Gemfile.jruby-1.9.lock
drwxr-xr-x 4 root root 4096 Mar 24 15:50 lib
-rw-rw-r-- 1 root root 589 Feb 17 05:00 LICENSE
-rw-rw-r-- 1 root root 149 Feb 17 05:00 NOTICE.TXT
drwxr-xr-x 4 root root 4096 Mar 24 15:50 vendor
[root@web01 logstash]#
logstash配置文件格式:
input { stdin { } }
output {
elasticsearch { hosts => ["localhost:9200"] }
stdout { codec => rubydebug }
}
配置文件结构:
# This is a comment. You should use comments to describe
# parts of your configuration.
input {
...
}
filter {
...
}
output {
...
}
插件的结构:
input {
file {
path => "/var/log/messages"
type => "syslog"
}
file {
path => "/var/log/apache/access.log"
type => "apache"
}
}
插件的数据结构:
数组array
Example:
path => [ "/var/log/messages", "/var/log/*.log" ]
path => "/data/mysql/mysql.log"
布尔类型
Example:
ssl_enable => true
字节
Examples:
my_bytes => "1113" # 1113 bytes
my_bytes => "10MiB" # 10485760 bytes
my_bytes => "100kib" # 102400 bytes
my_bytes => "180 mb" # 180000000 bytes
codeC
Example:
codec => "json"
HASH
Example:
match => {
"field1" => "value1"
"field2" => "value2"
...
}
Number
Numbers must be valid numeric values (floating point or integer).
Example:
port => 33
Password
A password is a string with a single value that is not logged or printed.
Example:
my_password => "password"
Pathedit
A path is a string that represents a valid operating system path.
Example:
my_path => "/tmp/logstash"
String
A string must be a single character sequence. Note that string values are enclosed in quotes, either double or single. Literal quotes in the string need to be escaped with a backslash if they are of the same kind as the string delimiter, i.e. single quotes within a single-quoted string need to be escaped as well as double quotes within a double-quoted string.
Example:
name => "Hello world"
name => 'It\'s a beautiful day'
Comments
Comments are the same as in perl, ruby, and python. A comment starts with a # character, and does not need to be at the beginning of a line. For example:
# this is a comment
input { # comments can appear at the end of a line, too
# ...
}
logstash版本不同,插件也会不同,我这里用的logstash-2.1.3.tar.gz
https://www.elastic.co/guide/en/logstash/2.1/plugins-outputs-elasticsearch.html#plugins-outputs-elasticsearch-hosts
logstash的启动方式为:
/usr/local/logstash/bin/logstash -f /usr/local/logstash/logstash.conf &
使用方法如下:
[root@node01 ~]# /usr/local/logstash/bin/logstash -t
Error: Usage:
/bin/logstash agent [OPTIONS]
Options:
-f, --config CONFIG_PATH Load the logstash config from a specific file
or directory. If a directory is given, all
files in that directory will be concatenated
in lexicographical order and then parsed as a
single config file. You can also specify
wildcards (globs) and any matched files will
be loaded in the order described above.
-e CONFIG_STRING Use the given string as the configuration
data. Same syntax as the config file. If no
input is specified, then the following is
used as the default input:
"input { stdin { type => stdin } }"
and if no output is specified, then the
following is used as the default output:
"output { stdout { codec => rubydebug } }"
If you wish to use both defaults, please use
the empty string for the '-e' flag.
(default: "")
-w, --filterworkers COUNT Sets the number of filter workers to run.
(default: 0)
-l, --log FILE Write logstash internal logs to the given
file. Without this flag, logstash will emit
logs to standard output.
-v Increase verbosity of logstash internal logs.
Specifying once will show 'informational'
logs. Specifying twice will show 'debug'
logs. This flag is deprecated. You should use
--verbose or --debug instead.
--quiet Quieter logstash logging. This causes only
errors to be emitted.
--verbose More verbose logging. This causes 'info'
level logs to be emitted.
--debug Most verbose logging. This causes 'debug'
level logs to be emitted.
-V, --version Emit the version of logstash and its friends,
then exit.
-p, --pluginpath PATH A path of where to find plugins. This flag
can be given multiple times to include
multiple paths. Plugins are expected to be
in a specific directory hierarchy:
'PATH/logstash/TYPE/NAME.rb' where TYPE is
'inputs' 'filters', 'outputs' or 'codecs'
and NAME is the name of the plugin.
-t, --configtest Check configuration for valid syntax and then exit.
--[no-]allow-unsafe-shutdown Force logstash to exit during shutdown even
if there are still inflight events in memory.
By default, logstash will refuse to quit until all
received events have been pushed to the outputs.
(default: false)
-h, --help print help
07-logstash-file-redis-es
redis的安装和配置:
[root@kibana ~]#tar xf redis-3.0.7.tar.gz
[root@kibana ~]#cd redis-3.0.7
[root@kibana ~]#make MALLOC=jemalloc
[root@kibana ~]#make PREFIX=/application/redis-3.0.7 install
[root@kibana ~]#ln -s /application/redis-3.0.7 /application/redis
[root@kibana ~]#echo "export PATH=/application/redis/bin:$PATH" >>/etc/profile
[root@kibana ~]#source /etc/profile
[root@kibana ~]#mkdir -p /application/redis/conf
[root@kibana ~]#cp redis.conf /application/redis/conf/
[root@kibana ~]#vim /application/redis/conf/redis.conf
修改bind地址,为本机ip地址
[root@kibana ~]#redis-server /application/redis/conf/redis.conf &
切换到node01,登录node02的redis服务
[root@kibana ~]# redis-cli -h 10.0.0.44 -p 6379
10.0.0.11:6379> info
# Server
redis_version:3.0.7
redis_git_sha1:00000000
修改web01上logstash配置文件如下:
[root@web01 ~]# vim /usr/local/logstash/conf/logstash.conf
input {
file {
#type => "accesslog"
path => "/application/nginx/logs/access.log"
start_position => "beginning"
}
}
output {
redis {
data_type => "list"
key => "system-messages"
host => "10.0.0.44"
port => "6379"
db => "0"
}
}
[root@web01 ~]#
这里用nginx访问日志作为测试,定义输入文件为"/application/nginx/logs/access.log ",输出文件存储到redis里面,定义key为 "system-messages",host为10.0.0.44,端口6379,存储数据库库为db=0。
保证nginx是运行状态:
[root@web01 ~]# ps -ef|grep nginxroot 1109 1 0 12:59 ? 00:00:00 nginx: master process /application/nginx/sbin/nginxnobody 1113 1109 0 12:59 ? 00:00:00 nginx: worker process nobody 1114 1109 0 12:59 ? 00:00:00 nginx: worker process nobody 1115 1109 0 12:59 ? 00:00:00 nginx: worker process nobody 1116 1109 0 12:59 ? 00:00:00 nginx: worker process root 1572 1185 0 14:06 pts/0 00:00:00 grep nginx[root@web01 ~]# [root@web01 ~]# tail -f /application/nginx/logs/access.log 10.0.0.10 - - [17/Aug/2016:14:10:02 +0800] "GET /index.html HTTP/1.0" 200 612 "-" "ApacheBench/2.3"10.0.0.10 - - [17/Aug/2016:14:10:02 +0800] "GET /index.html HTTP/1.0" 200 612 "-" "ApacheBench/2.3"10.0.0.10 - - [17/Aug/2016:14:10:02 +0800] "GET /index.html HTTP/1.0" 200 612 "-" "ApacheBench/2.3"10.0.0.10 - - [17/Aug/2016:14:10:02 +0800] "GET /index.html HTTP/1.0" 200 612 "-" "ApacheBench/2.3"10.0.0.10 - - [17/Aug/2016:14:10:02 +0800] "GET /index.html HTTP/1.0" 200 612 "-" "ApacheBench/2.3"10.0.0.10 - - [17/Aug/2016:14:10:02 +0800] "GET /index.html HTTP/1.0" 200 612 "-" "ApacheBench/2.3"10.0.0.10 - - [17/Aug/2016:14:10:02 +0800] "GET /index.html HTTP/1.0" 200 612 "-" "ApacheBench/2.3"10.0.0.10 - - [17/Aug/2016:14:10:02 +0800] "GET /index.html HTTP/1.0" 200 612 "-" "ApacheBench/2.3"10.0.0.10 - - [17/Aug/2016:14:10:02 +0800] "GET /index.html HTTP/1.0" 200 612 "-" "ApacheBench/2.3"10.0.0.10 - - [17/Aug/2016:14:10:02 +0800] "GET /index.html HTTP/1.0" 200 612 "-" "ApacheBench/2.3"10.0.0.10 - - [17/Aug/2016:14:10:02 +0800] "GET /index.html HTTP/1.0" 200 612 "-" "ApacheBench/2.3"10.0.0.10 - - [17/Aug/2016:14:10:02 +0800] "GET /index.html HTTP/1.0" 200 612 "-" "ApacheBench/2.3"10.0.0.10 - - [17/Aug/2016:14:10:02 +0800] "GET /index.html HTTP/1.0" 200 612 "-" "ApacheBench/2.3"10.0.0.10 - - [17/Aug/2016:14:10:02 +0800] "GET /index.html HTTP/1.0" 200 612 "-" "ApacheBench/2.3"10.0.0.10 - - [17/Aug/2016:14:10:02 +0800] "GET /index.html HTTP/1.0" 200 612 "-" "ApacheBench/2.3"10.0.0.10 - - [17/Aug/2016:14:10:02 +0800] "GET /index.html HTTP/1.0" 200 612 "-" "ApacheBench/2.3"10.0.0.10 - - [17/Aug/2016:14:10:02 +0800] "GET /index.html HTTP/1.0" 200 612 "-" "ApacheBench/2.3"10.0.0.10 - - [17/Aug/2016:14:10:02 +0800] "GET /index.html HTTP/1.0" 200 612 "-" "ApacheBench/2.3"[root@web01 ~]#
登录redis,查看数据是否已经传入到redis上:
[root@kibana ~]# redis-cli
127.0.0.1:6379> keys *
1) "system-messages"
127.0.0.1:6379>
127.0.0.1:6379>
127.0.0.1:6379> keys *
1) "system-messages"
127.0.0.1:6379>
发现通过浏览器访问的日志已经存入到了redis中,这一步实现日志的转存,下一步实现日志的从redis中通过logstash转存到elasticsearch中
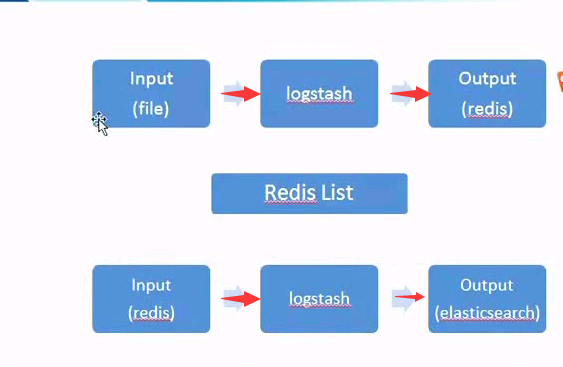
以上实现了数据从数据源(access.log)中转存到redis中,下一步实现从redis中转存到elasticsearch中
这里在logstash上开启一个logstash,并且编写配置文件/usr/local/logstash/logstash.conf
[root@logstash ~]# cd /usr/local/logstash
[root@logstash logstash]# pwd
/usr/local/logstash
[root@logstash logstash]#
[root@node02 conf]# ps -ef|grep logstash
root 43072 42030 0 15:46 pts/1 00:00:00 grep logstash
[root@node02 conf]# cat /usr/local/logstash/logstash.conf
input {
redis {
data_type => "list"
key => "system-messages"
host => "10.0.0.44"
port => "6379"
db => "0"
}
}
output {
elasticsearch {
hosts => "10.0.0.41"
#protocol => "http"
index => "redis-messages-%{+YYYY.MM.dd}"
}
}
[root@logstash conf]#
说明:定义数据写入文件为redis,对应的键和主机以及端口如下:
redis {
data_type => "list"
key => "system-messages"
host => "10.0.0.44"
port => "6379"
db => "0"
}
数据输出到 elasticsearch中,具体配置为:
elasticsearch {
hosts => "10.0.0.41"
index => "system-redis-messages-%{+YYYY.MM.dd}"
}
启动logstash进行日志收集
[root@logstash conf]# /usr/local/logstash/bin/logstash -f /usr/local/logstash/conf/logstash.conf &
[1] 43097
[root@node02 conf]#
[root@node02 conf]#
[root@node02 conf]#
[root@node02 conf]#
[root@node02 conf]#
[root@node02 conf]#
[root@node02 conf]# ps -ef|grep logstash
[root@logstash logstash]# ps -ef|grep logstash
root 1169 1141 7 13:11 pts/0 00:04:30 /usr/java/jdk1.8.0_73/bin/java -XX:+UseParNewGC -XX:+UseConcMarkSweepGC -Djava.awt.headless=true -XX:CMSInitiatingOccupancyFraction=75 -XX:+UseCMSInitiatingOccupancyOnly -XX:+HeapDumpOnOutOfMemoryError -Xmx1g -Xss2048k -Djffi.boot.library.path=/usr/local/logstash/vendor/jruby/lib/jni -XX:+UseParNewGC -XX:+UseConcMarkSweepGC -Djava.awt.headless=true -XX:CMSInitiatingOccupancyFraction=75 -XX:+UseCMSInitiatingOccupancyOnly -XX:+HeapDumpOnOutOfMemoryError -XX:HeapDumpPath=/usr/local/logstash/heapdump.hprof -Xbootclasspath/a:/usr/local/logstash/vendor/jruby/lib/jruby.jar -classpath : -Djruby.home=/usr/local/logstash/vendor/jruby -Djruby.lib=/usr/local/logstash/vendor/jruby/lib -Djruby.script=jruby -Djruby.shell=/bin/sh org.jruby.Main --1.9 /usr/local/logstash/lib/bootstrap/environment.rb logstash/runner.rb agent -f /usr/local/logstash/conf/logstash.conf
root 1339 1141 0 14:14 pts/0 00:00:00 grep logstash
[root@logstash logstash]#
再回过来查看redis的db中的数据是否已经转存过去(即存储到elasticserach中)
127.0.0.1:6379> LLEN system-messages
(integer) 0
127.0.0.1:6379>
127.0.0.1:6379>
127.0.0.1:6379> keys *
(empty list or set)
127.0.0.1:6379>
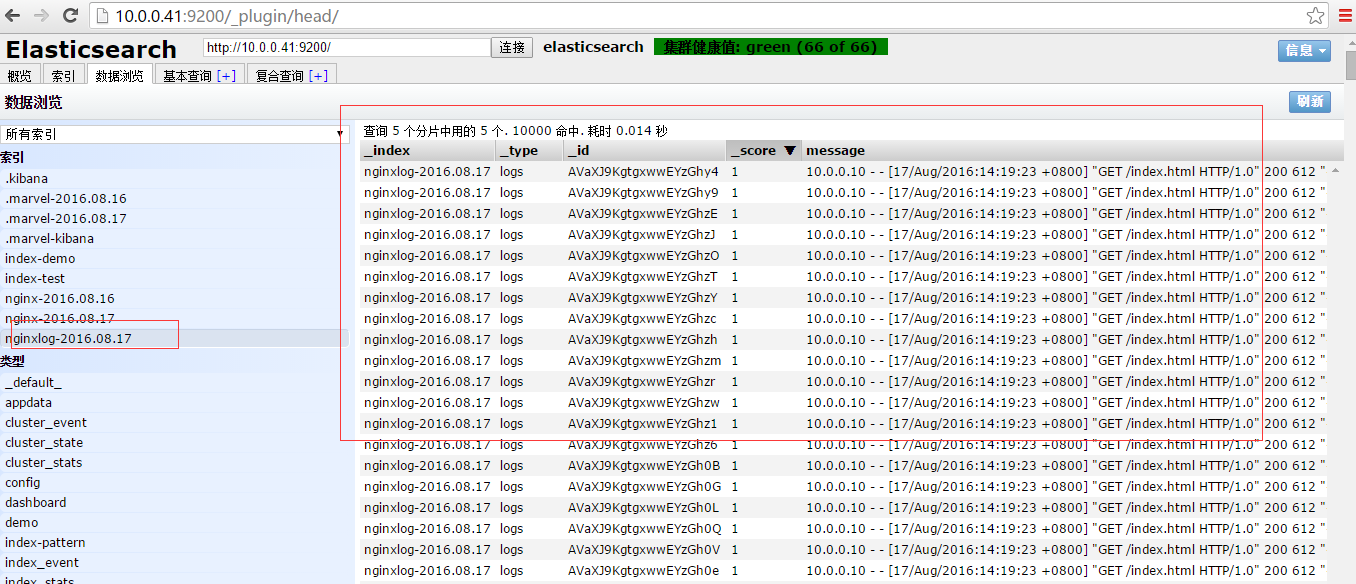
从上述输入可以知道数据应转存到elasticsearch中,下面我可以进行查看:
进一步查看日志信息:
logstash收集json格式的nginx日志,然后将日志转存到elasticsearch中
json格式分割nginx日志配置参数:
log_format logstash_json '{ "@timestamp": "$time_local", '
'"@fields": { '
'"remote_addr": "$remote_addr", '
'"remote_user": "$remote_user", '
'"body_bytes_sent": "$body_bytes_sent", '
'"request_time": "$request_time", '
'"status": "$status", '
'"request": "$request", '
'"request_method": "$request_method", '
'"http_referrer": "$http_referer", '
'"body_bytes_sent":"$body_bytes_sent", '
'"http_x_forwarded_for": "$http_x_forwarded_for", '
'"http_user_agent": "$http_user_agent" } }';
修改后的nginx配置文件为:
[root@web01 conf]# pwd
/application/nginx/conf
[root@web01 conf]# cat nginx.conf
worker_processes 4;
events {
worker_connections 1024;
}
http {
include mime.types;
default_type application/octet-stream;
log_format logstash_json '{ "@timestamp": "$time_local", '
'"@fields": { '
'"remote_addr": "$remote_addr", '
'"remote_user": "$remote_user", '
'"body_bytes_sent": "$body_bytes_sent", '
'"request_time": "$request_time", '
'"status": "$status", '
'"request": "$request", '
'"request_method": "$request_method", '
'"http_referrer": "$http_referer", '
'"body_bytes_sent":"$body_bytes_sent", '
'"http_x_forwarded_for": "$http_x_forwarded_for", '
'"http_user_agent": "$http_user_agent" } }';
sendfile on;
keepalive_timeout 65;
server {
listen 80;
server_name localhost;
access_log logs/access_json.log logstash_json;
location / {
root html;
index index.html index.htm;
}
error_page 500 502 503 504 /50x.html;
location = /50x.html {
root html;
}
}
}
[root@node01 conf]#
启动nginx:
[root@web01 nginx]# killall nginx
nginx: no process killed
[root@web01 nginx]#
[root@web01 nginx]# /application/nginx/sbin/nginx -t
nginx: the configuration file /application/nginx-1.6.0/conf/nginx.conf syntax is ok
nginx: configuration file /application/nginx-1.6.0/conf/nginx.conf test is successful
[root@web01 nginx]#
[root@web01 nginx]# cd -
/application/nginx/logs
[root@web01 logs]# ll
total 9976
-rw-r--r-- 1 root root 0 Aug 17 14:27 access_json.log
-rw-r--r--. 1 root root 10056370 Aug 17 14:26 access.log
-rw-r--r--. 1 root root 146445 Aug 17 00:15 error.log
-rw-r--r-- 1 root root 5 Aug 17 14:27 nginx.pid
[root@web01 logs]#
通过ab命令访问本地nginx服务:
[root@logstash conf]# ab -n 10000 -c 50 http://10.0.0.9/index.html
This is ApacheBench, Version 2.3 <$Revision: 655654 $>
Copyright 1996 Adam Twiss, Zeus Technology Ltd, http://www.zeustech.net/
Licensed to The Apache Software Foundation, http://www.apache.org/
Benchmarking 10.0.0.9 (be patient)
Completed 1000 requests
Completed 2000 requests
Completed 3000 requests
Completed 4000 requests
Completed 5000 requests
Completed 6000 requests
Completed 7000 requests
Completed 8000 requests
Completed 9000 requests
Completed 10000 requests
Finished 10000 requests
Server Software: nginx/1.6.2
Server Hostname: 10.0.0.9
Server Port: 80
Document Path: /index.html
Document Length: 612 bytes
Concurrency Level: 50
Time taken for tests: 2.277 seconds
Complete requests: 10000
Failed requests: 0
Write errors: 0
Total transferred: 8447596 bytes
HTML transferred: 6125508 bytes
Requests per second: 4391.57 [#/sec] (mean)
Time per request: 11.385 [ms] (mean)
Time per request: 0.228 [ms] (mean, across all concurrent requests)
Transfer rate: 3622.87 [Kbytes/sec] received
Connection Times (ms)
min mean[+/-sd] median max
Connect: 0 2 2.5 2 27
Processing: 2 9 4.9 9 50
Waiting: 1 8 5.1 8 49
Total: 3 11 4.8 11 54
Percentage of the requests served within a certain time (ms)
50% 11
66% 11
75% 12
80% 13
90% 15
95% 19
98% 26
99% 33
100% 54 (longest request)
[root@logstash conf]#
访问nginx产生的日志为:
[root@web01 logs]# head -n 10 access_json.log
{ "@timestamp": "17/Aug/2016:14:27:49 +0800", "@fields": { "remote_addr": "10.0.0.10", "remote_user": "-", "body_bytes_sent": "612", "request_time": "0.006", "status": "200", "request": "GET /index.html HTTP/1.0", "request_method": "GET", "http_referrer": "-", "body_bytes_sent":"612", "http_x_forwarded_for": "-", "http_user_agent": "ApacheBench/2.3" } }
{ "@timestamp": "17/Aug/2016:14:27:49 +0800", "@fields": { "remote_addr": "10.0.0.10", "remote_user": "-", "body_bytes_sent": "612", "request_time": "0.000", "status": "200", "request": "GET /index.html HTTP/1.0", "request_method": "GET", "http_referrer": "-", "body_bytes_sent":"612", "http_x_forwarded_for": "-", "http_user_agent": "ApacheBench/2.3" } }
{ "@timestamp": "17/Aug/2016:14:27:49 +0800", "@fields": { "remote_addr": "10.0.0.10", "remote_user": "-", "body_bytes_sent": "612", "request_time": "0.000", "status": "200", "request": "GET /index.html HTTP/1.0", "request_method": "GET", "http_referrer": "-", "body_bytes_sent":"612", "http_x_forwarded_for": "-", "http_user_agent": "ApacheBench/2.3" } }
{ "@timestamp": "17/Aug/2016:14:27:49 +0800", "@fields": { "remote_addr": "10.0.0.10", "remote_user": "-", "body_bytes_sent": "612", "request_time": "0.007", "status": "200", "request": "GET /index.html HTTP/1.0", "request_method": "GET", "http_referrer": "-", "body_bytes_sent":"612", "http_x_forwarded_for": "-", "http_user_agent": "ApacheBench/2.3" } }
{ "@timestamp": "17/Aug/2016:14:27:49 +0800", "@fields": { "remote_addr": "10.0.0.10", "remote_user": "-", "body_bytes_sent": "612", "request_time": "0.007", "status": "200", "request": "GET /index.html HTTP/1.0", "request_method": "GET", "http_referrer": "-", "body_bytes_sent":"612", "http_x_forwarded_for": "-", "http_user_agent": "ApacheBench/2.3" } }
{ "@timestamp": "17/Aug/2016:14:27:49 +0800", "@fields": { "remote_addr": "10.0.0.10", "remote_user": "-", "body_bytes_sent": "612", "request_time": "0.007", "status": "200", "request": "GET /index.html HTTP/1.0", "request_method": "GET", "http_referrer": "-", "body_bytes_sent":"612", "http_x_forwarded_for": "-", "http_user_agent": "ApacheBench/2.3" } }
{ "@timestamp": "17/Aug/2016:14:27:49 +0800", "@fields": { "remote_addr": "10.0.0.10", "remote_user": "-", "body_bytes_sent": "612", "request_time": "0.007", "status": "200", "request": "GET /index.html HTTP/1.0", "request_method": "GET", "http_referrer": "-", "body_bytes_sent":"612", "http_x_forwarded_for": "-", "http_user_agent": "ApacheBench/2.3" } }
{ "@timestamp": "17/Aug/2016:14:27:49 +0800", "@fields": { "remote_addr": "10.0.0.10", "remote_user": "-", "body_bytes_sent": "612", "request_time": "0.007", "status": "200", "request": "GET /index.html HTTP/1.0", "request_method": "GET", "http_referrer": "-", "body_bytes_sent":"612", "http_x_forwarded_for": "-", "http_user_agent": "ApacheBench/2.3" } }
{ "@timestamp": "17/Aug/2016:14:27:49 +0800", "@fields": { "remote_addr": "10.0.0.10", "remote_user": "-", "body_bytes_sent": "612", "request_time": "0.007", "status": "200", "request": "GET /index.html HTTP/1.0", "request_method": "GET", "http_referrer": "-", "body_bytes_sent":"612", "http_x_forwarded_for": "-", "http_user_agent": "ApacheBench/2.3" } }
{ "@timestamp": "17/Aug/2016:14:27:49 +0800", "@fields": { "remote_addr": "10.0.0.10", "remote_user": "-", "body_bytes_sent": "612", "request_time": "0.007", "status": "200", "request": "GET /index.html HTTP/1.0", "request_method": "GET", "http_referrer": "-", "body_bytes_sent":"612", "http_x_forwarded_for": "-", "http_user_agent": "ApacheBench/2.3" } }
[root@web01 logs]#
logstash的配置文件文件为:
[root@node01 logs]# vim /usr/local/logstash/conf/logstash.conf
input {
file {
#type => "accesslog"
path => "/application/nginx/logs/access_json.log"
start_position => "beginning"
}
}
output {
redis {
data_type => "list"
key => "system-messages"
host => "10.0.0.44"
port => "6379"
db => "0"
}
}
[root@node01 logs]#
重启logstash
[root@web01 logs]# /usr/local/logstash/bin/logstash -f /usr/local/logstash/conf/logstash.conf &
[1] 20328
[root@web01 logs]#
[root@web01 logs]#
[root@web01 logs]#
[root@web01 logs]#
[root@web01 logs]#ps -ef|grep logstash
root 1638 1185 99 14:32 pts/0 00:03:56 /usr/java/jdk1.8.0_73/bin/java -XX:+UseParNewGC -XX:+UseConcMarkSweepGC -Djava.awt.headless=true -XX:CMSInitiatingOccupancyFraction=75 -XX:+UseCMSInitiatingOccupancyOnly -XX:+HeapDumpOnOutOfMemoryError -Xmx1g -Xss2048k -Djffi.boot.library.path=/usr/local/logstash/vendor/jruby/lib/jni -XX:+UseParNewGC -XX:+UseConcMarkSweepGC -Djava.awt.headless=true -XX:CMSInitiatingOccupancyFraction=75 -XX:+UseCMSInitiatingOccupancyOnly -XX:+HeapDumpOnOutOfMemoryError -XX:HeapDumpPath=/usr/local/logstash/heapdump.hprof -Xbootclasspath/a:/usr/local/logstash/vendor/jruby/lib/jruby.jar -classpath : -Djruby.home=/usr/local/logstash/vendor/jruby -Djruby.lib=/usr/local/logstash/vendor/jruby/lib -Djruby.script=jruby -Djruby.shell=/bin/sh org.jruby.Main --1.9 /usr/local/logstash/lib/bootstrap/environment.rb logstash/runner.rb agent -f /usr/local/logstash/conf/logstash.conf
root 1678 1185 0 14:34 pts/0 00:00:00 grep logstash
[root@web01 ~]#
连接redis查看日志是否写入:
[root@kibana]# redis-cli -h 10.0.0.44 -p 6379
10.0.0.44:6379> select 2
OK
10.0.0.44:6379[2]> keys *
(empty list or set)
10.0.0.44:6379[2]>
通过ab命令访问nginx,
[root@node01 ~]# ab -n1000 -c 100 http://10.0.0.9/
This is ApacheBench, Version 2.3 <$Revision: 655654 $>
Copyright 1996 Adam Twiss, Zeus Technology Ltd, http://www.zeustech.net/
Licensed to The Apache Software Foundation, http://www.apache.org/
Benchmarking 10.0.0.10 (be patient)
Completed 100 requests
Completed 200 requests
Completed 300 requests
Completed 400 requests
Completed 500 requests
Completed 600 requests
Completed 700 requests
Completed 800 requests
Completed 900 requests
Completed 1000 requests
Finished 1000 requests
Server Software: nginx/1.6.2
Server Hostname: 10.0.0.9
Server Port: 80
Document Path: /
Document Length: 612 bytes
Concurrency Level: 100
Time taken for tests: 0.274 seconds
Complete requests: 1000
Failed requests: 0
Write errors: 0
Total transferred: 881136 bytes
HTML transferred: 638928 bytes
Requests per second: 3649.85 [#/sec] (mean)
Time per request: 27.398 [ms] (mean)
Time per request: 0.274 [ms] (mean, across all concurrent requests)
Transfer rate: 3140.64 [Kbytes/sec] received
Connection Times (ms)
min mean[+/-sd] median max
Connect: 0 8 4.3 9 15
Processing: 4 18 8.6 16 51
Waiting: 1 15 9.3 12 49
Total: 12 26 5.7 25 52
Percentage of the requests served within a certain time (ms)
50% 25
66% 27
75% 28
80% 29
90% 34
95% 38
98% 42
99% 42
100% 52 (longest request)
[root@node01 ~]#
再次检查redis是否写入数据:
[root@kibana]# redis-cli -h 10.0.0.44 -p 6379
10.0.0.44:6379> keys *
(empty list or set)
10.0.0.44:6379> keys *
1) "system-messages"
10.0.0.44:6379> keys *
1) "system-messages"
10.0.0.44:6379> keys *
1) "system-messages"
10.0.0.44:6379> keys *
1) "system-messages"
10.0.0.44:6379>
数据成功写入redis,接下来将redis数据写入elasticsearch中
在logstash主机上编写logstash配置文件
[root@logstash]#cd /usr/local/logstash/conf
[root@logstash conf]# cat logstash.conf
input {
redis {
data_type => "list"
key => "system-messages"
host => "10.0.0.44"
port => "6379"
db => "0"
}
}
output {
elasticsearch {
hosts => "10.0.0.41"
index => "nginx-access-log-%{+YYYY.MM.dd}"
}
}
[root@logstash conf]#
测试文件是否正确,然后重启logstash
[root@logstash conf]# /usr/local/logstash/bin/logstash -t -f /usr/local/logstash/conf/logstash.conf
Configuration OK
[root@logstash conf]#
[root@logstash conf]# /usr/local/logstash/bin/logstash -f /usr/local/logstash/conf/logstash.conf &
[1] 44494
[root@logstash conf]#
用ab进行测试访问:
[root@logstash ~]# ab -n 10000 -c100 http://10.0.0.41/
This is ApacheBench, Version 2.3 <$Revision: 655654 $>
Copyright 1996 Adam Twiss, Zeus Technology Ltd, http://www.zeustech.net/
Licensed to The Apache Software Foundation, http://www.apache.org/
Benchmarking 10.0.0.10 (be patient)
Completed 1000 requests
Completed 2000 requests
Completed 3000 requests
Completed 4000 requests
Completed 5000 requests
Completed 6000 requests
Completed 7000 requests
Completed 8000 requests
Completed 9000 requests
Completed 10000 requests
Finished 10000 requests
Server Software: nginx/1.6.2
Server Hostname: 10.0.0.10
Server Port: 80
Document Path: /
Document Length: 612 bytes
Concurrency Level: 100
Time taken for tests: 2.117 seconds
Complete requests: 10000
Failed requests: 0
Write errors: 0
Total transferred: 8510052 bytes
HTML transferred: 6170796 bytes
Requests per second: 4722.57 [#/sec] (mean)
Time per request: 21.175 [ms] (mean)
Time per request: 0.212 [ms] (mean, across all concurrent requests)
Transfer rate: 3924.74 [Kbytes/sec] received
Connection Times (ms)
min mean[+/-sd] median max
Connect: 0 4 3.7 3 25
Processing: 2 17 10.8 15 75
Waiting: 1 15 10.3 12 75
Total: 5 21 10.9 18 75
Percentage of the requests served within a certain time (ms)
50% 18
66% 24
75% 27
80% 29
90% 36
95% 44
98% 49
99% 57
100% 75 (longest request)
[root@node01 ~]#
redis查看数据写入
[root@kibana ~]# redis-cli -h 10.0.0.44 -p 6379
10.0.0.44:6379> keys *
(empty list or set)
10.0.0.44:6379> keys *
1) "system-messages"
10.0.0.44:6379> keys *
1) "system-messages"
10.0.0.44:6379> keys *
1) "system-messages"
10.0.0.44:6379> keys *
(empty list or set)
10.0.0.44:6379>
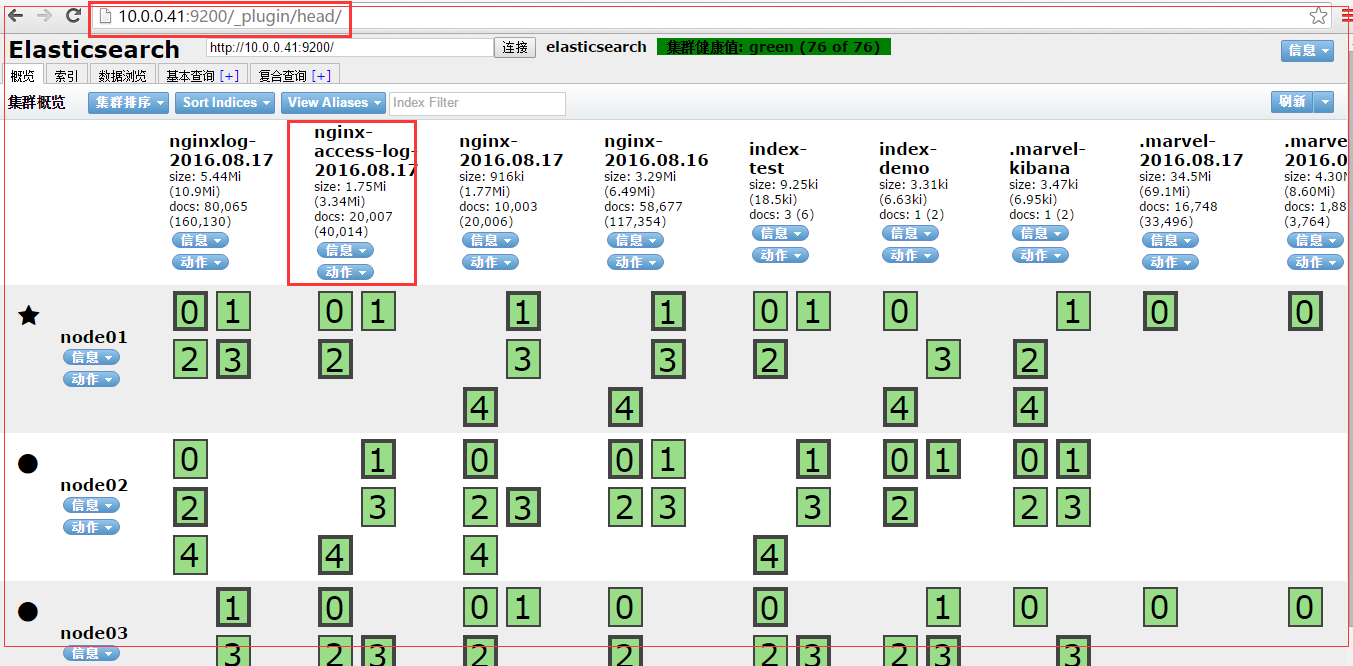
查看elasticsearch数据
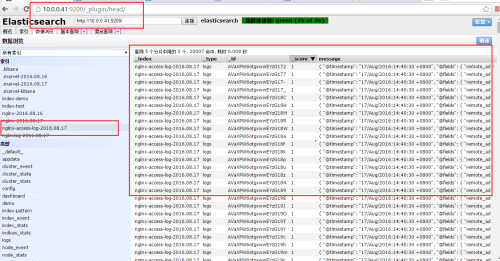
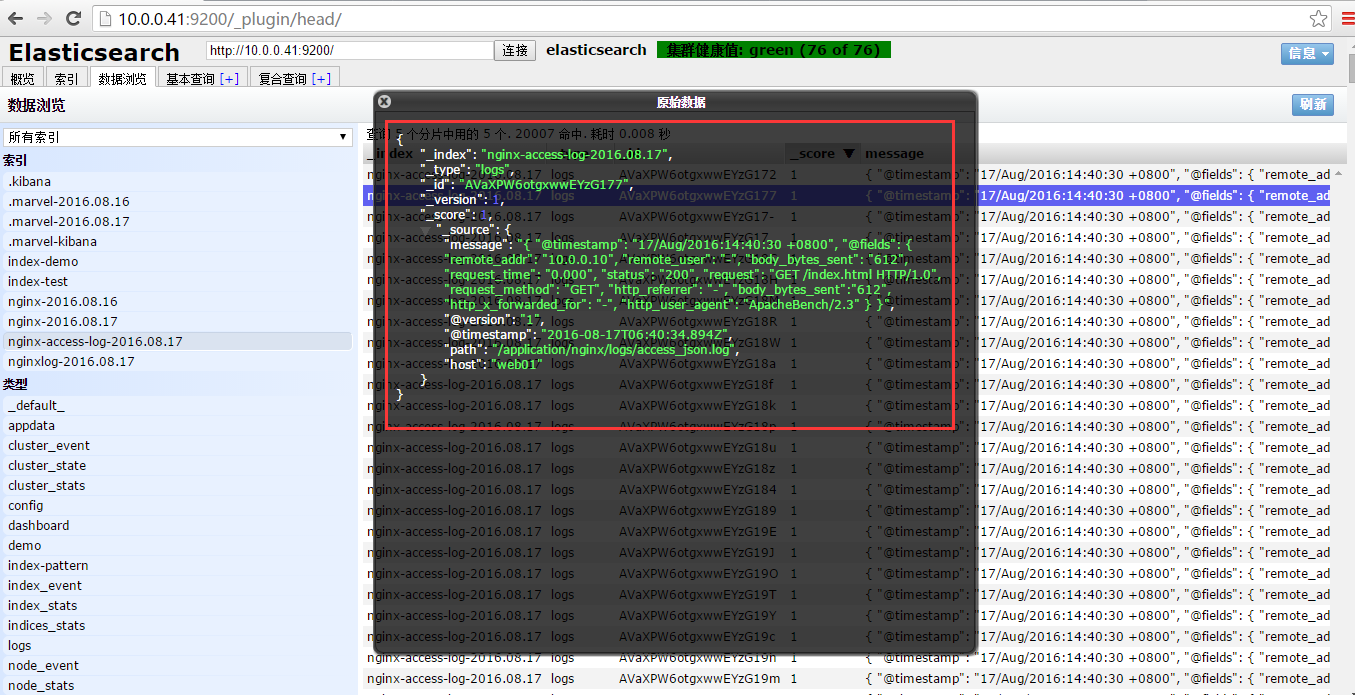
进一步查看数据
数据格式为键值形式,即json格式
运用kibana插件对elasticsearch+logstash+redis收集到的数据进行可视化展示
解压:
[root@kibana ~]#cd /opt/tools
[root@kibana tools]# tar xf kibana-4.1.6-linux-x64.tar.gz
[root@kibana tools]# mv kibana-4.1.6-linux-x64 /usr/local/kibana
[root@kibana tools]# cd /usr/local/kibana/
[root@kibana kibana]#
配置:
[root@kibana config]# pwd
/usr/local/kibana/config
[root@kibana config]# ll
total 4
-rw-r--r-- 1 logstash games 2933 Mar 10 03:29 kibana.yml
[root@kibana config]#
[root@kibana config]# vim kibana.yml
修改为:
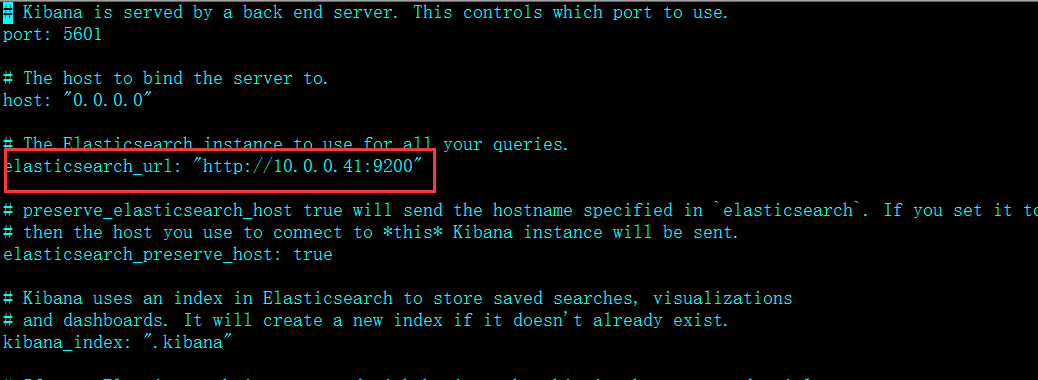
[root@kibana config]# cd ..
[root@kibana kibana]# pwd
/usr/local/kibana
[root@kibana kibana]# ll
total 28
drwxr-xr-x 2 logstash games 4096 Mar 28 23:24 bin
drwxr-xr-x 2 logstash games 4096 Mar 28 23:31 config
-rw-r--r-- 1 logstash games 563 Mar 10 03:29 LICENSE.txt
drwxr-xr-x 6 logstash games 4096 Mar 28 23:24 node
drwxr-xr-x 2 logstash games 4096 Mar 28 23:24 plugins
-rw-r--r-- 1 logstash games 2510 Mar 10 03:29 README.txt
drwxr-xr-x 9 logstash games 4096 Mar 10 03:29 src
[root@kibana kibana]# ./bin/kibana -h
Usage: kibana [options]
Kibana is an open source (Apache Licensed), browser based analytics and search dashboard for Elasticsearch.
Options:
-h, --help output usage information
-V, --version output the version number
-e, --elasticsearch <uri> Elasticsearch instance
-c, --config <path> Path to the config file
-p, --port <port> The port to bind to
-q, --quiet Turns off logging
-H, --host <host> The host to bind to
-l, --log-file <path> The file to log to
--plugins <path> Path to scan for plugins
[root@kibana kibana]#
将kibana放入后台运行
[root@kibana kibana]# nohup ./bin/kibana &
[1] 20765
[root@kibana kibana]# nohup: ignoring input and appending output to `nohup.out'
[root@kibana kibana]#
[root@kibana kibana]#
[root@kibana kibana]#
查看启动状态
[root@kibana kibana]# netstat -pnutl|grep 5601
tcp 0 0 0.0.0.0:5601 0.0.0.0:* LISTEN 20765/./bin/../node
[root@kibana kibana]#
[root@kibana kibana]#
[root@kibana kibana]# ps -ef|grep kibana
root 20765 20572 4 23:34 pts/6 00:00:02 ./bin/../node/bin/node ./bin/../src/bin/kibana.js
root 20780 20572 0 23:35 pts/6 00:00:00 grep kibana
[root@kibana kibana]#
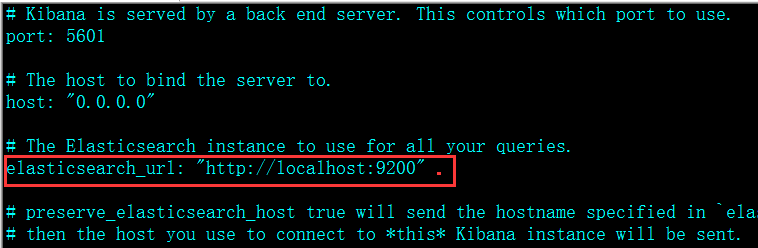
浏览器输入http://192.168.0.44:5601/
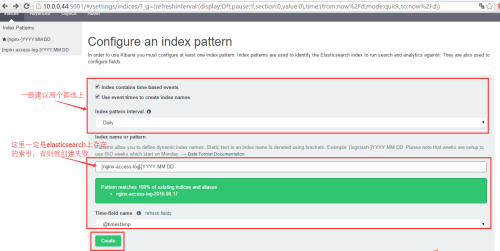
点击“create”创建nginx-access-log索引
切换到discover
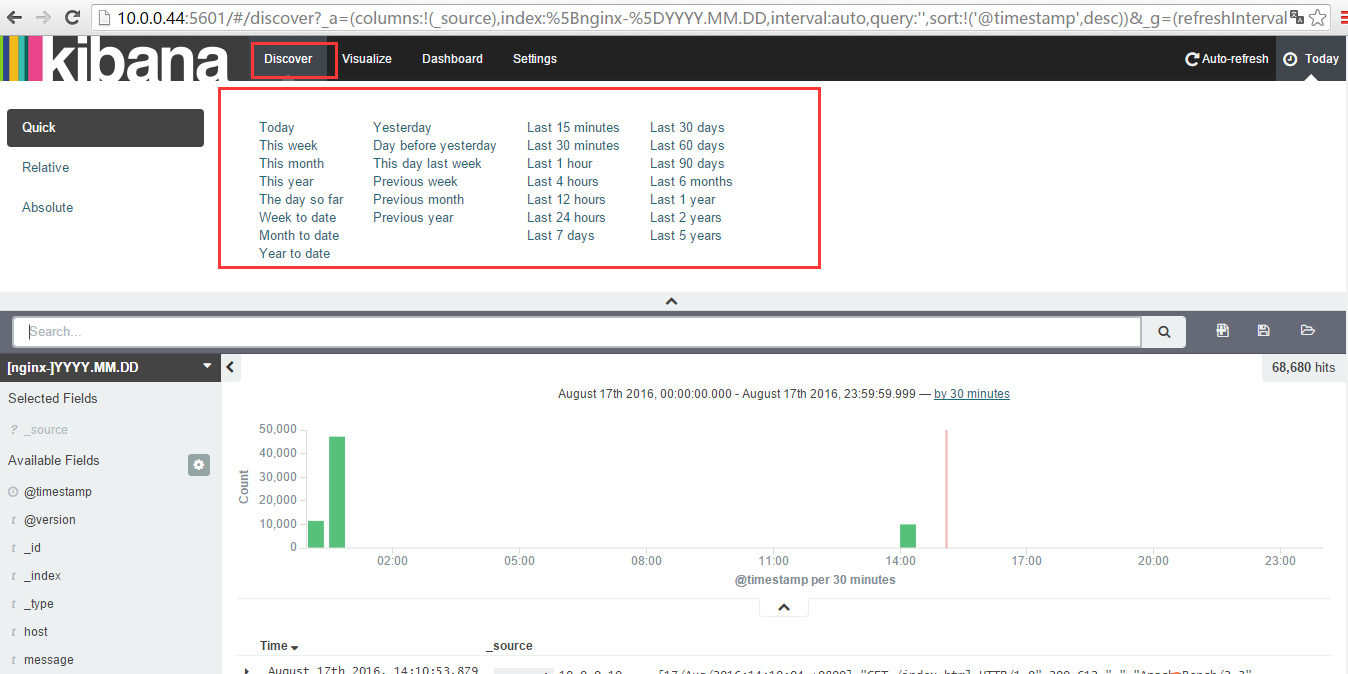
在这里可以选择"today、Laster minutes等时间",例如我们选择"Laster minutes";
点击“Laster minutes”
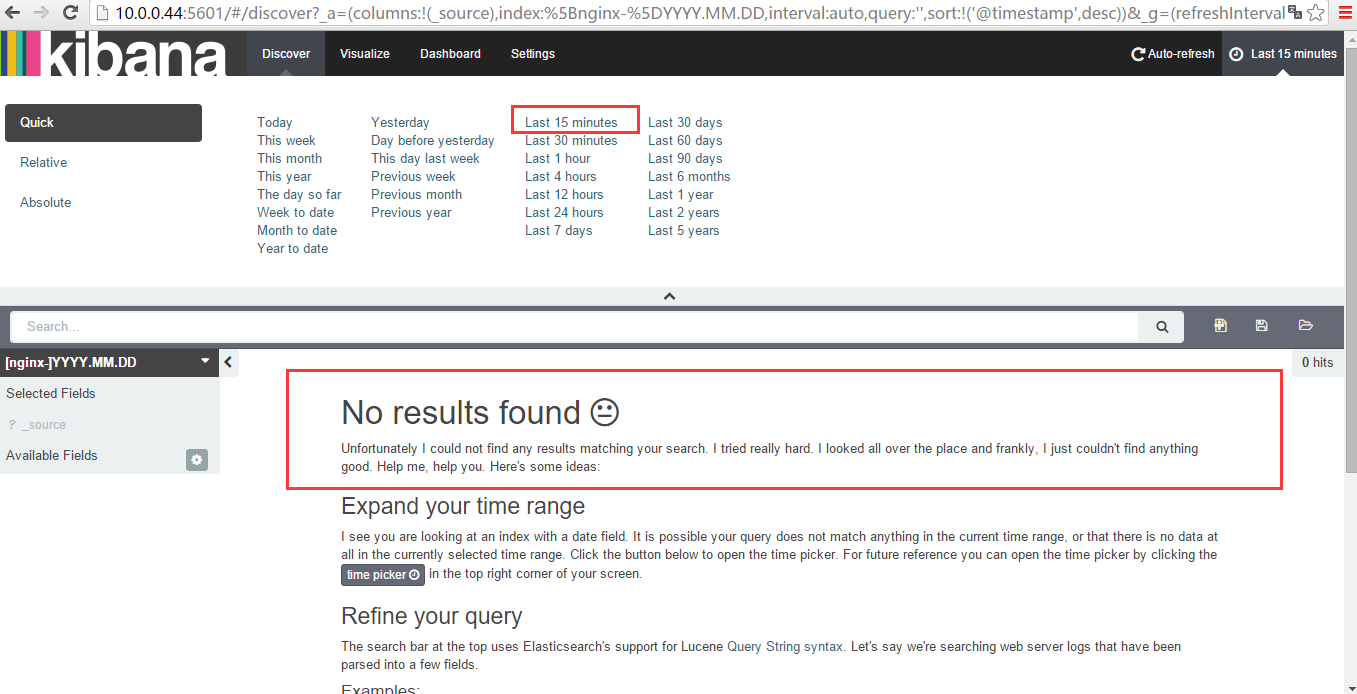 y因为我们创建的索引是在15分钟以内的,所以这里显示找不到结果,这里选择today,时间选长一点,再看
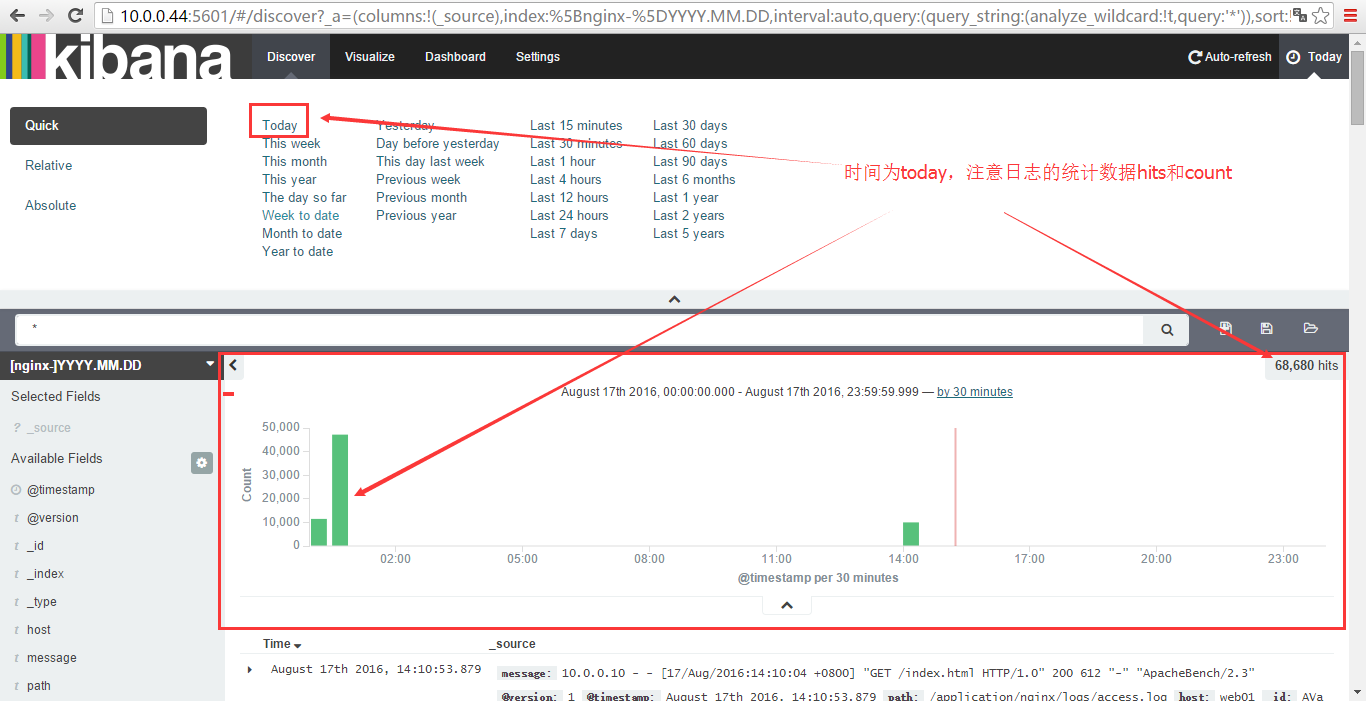
点击“today”
下面是根据需要列出以前实验的操作步骤,仅供参考
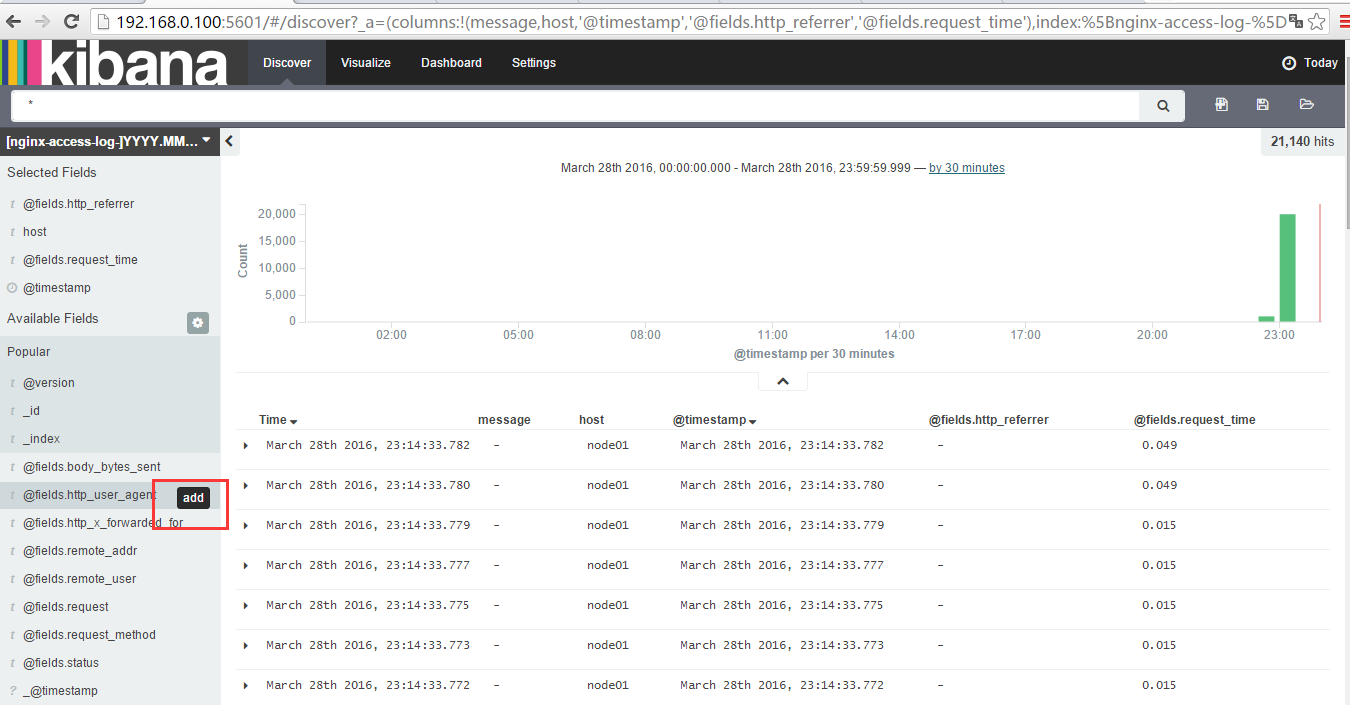
如果根据需求显示(默认是显示全部):这里用add来选择要显示的内容
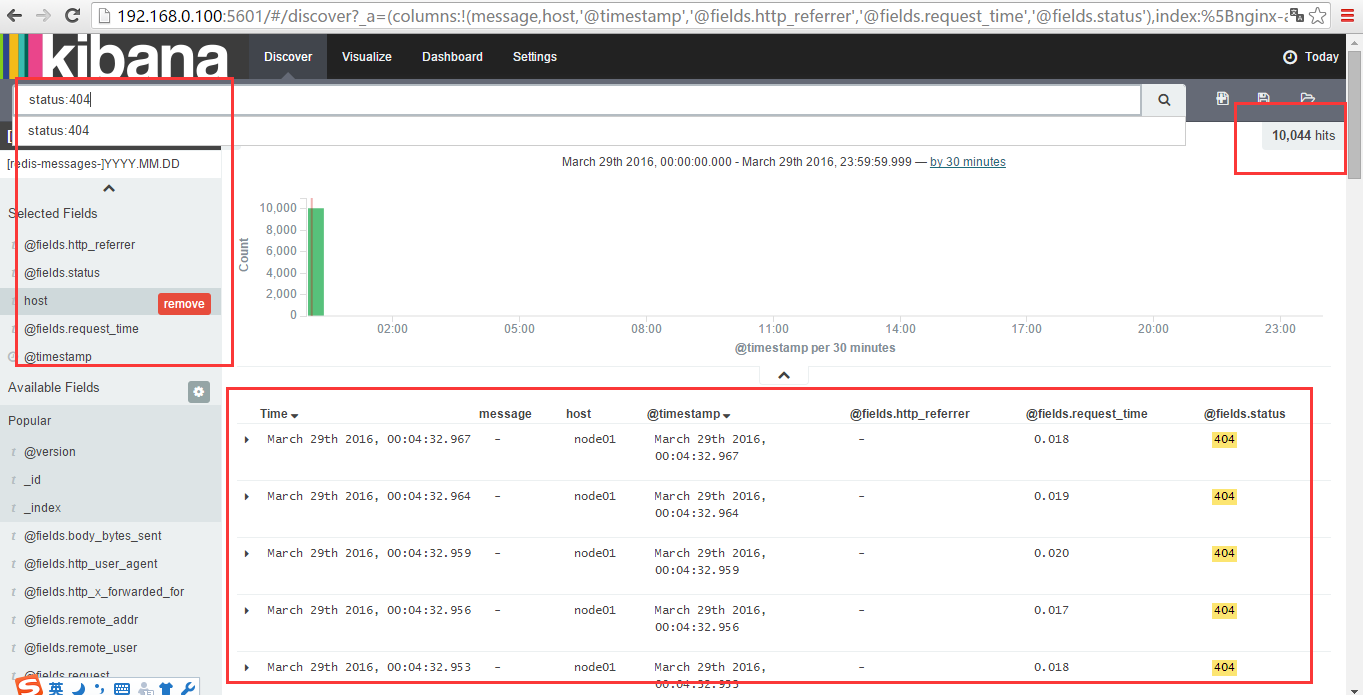
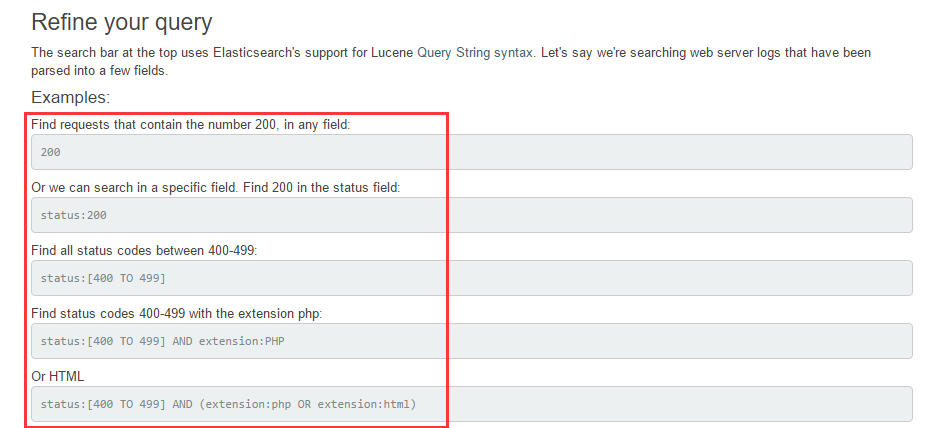
搜索功能,比如搜索状态为404的
搜索状态为200的
总结ELKStack工作流程
元数据(tomcat、Apache、PHP等服务器的日志文件log)-------->logstash将原始数据写入到redis中,然后通过logstash将redis中的数据写入到elasticsearch,最后通过kibana对elasticsearch数据进行分析整理,并展示出来

补充elasticsearch配置文件注释:
elasticsearch的config文件夹里面有两个配置文 件:elasticsearch.yml和logging.yml,第一个是es的基本配置文件,第二个是日志配置文件,
es也是使用log4j来记录日 志的,所以logging.yml里的设置按普通log4j配置文件来设置就行了。下面主要讲解下elasticsearch.yml这个文件中可配置的 东西。
cluster.name: elasticsearch
配置es的集群名称,默认是elasticsearch,es会自动发现在同一网段下的es,如果在同一网段下有多个集群,就可以用这个属性来区分不同的集群。
node.name: "Franz Kafka"
节点名,默认随机指定一个name列表中名字,该列表在es的jar包中config文件夹里name.txt文件中,其中有很多作者添加的有趣名字。
node.master: true
指定该节点是否有资格被选举成为node,默认是true,es是默认集群中的第一台机器为master,如果这台机挂了就会重新选举master。
node.data: true
指定该节点是否存储索引数据,默认为true。
index.number_of_shards: 5
设置默认索引分片个数,默认为5片。
index.number_of_replicas: 1
设置默认索引副本个数,默认为1个副本。
path.conf: /path/to/conf
设置配置文件的存储路径,默认是es根目录下的config文件夹。
path.data: /path/to/data
设置索引数据的存储路径,默认是es根目录下的data文件夹,可以设置多个存储路径,用逗号隔开,例:
path.data: /path/to/data1,/path/to/data2
path.work: /path/to/work
设置临时文件的存储路径,默认是es根目录下的work文件夹。
path.logs: /path/to/logs
设置日志文件的存储路径,默认是es根目录下的logs文件夹
path.plugins: /path/to/plugins
设置插件的存放路径,默认是es根目录下的plugins文件夹
bootstrap.mlockall: true
设置为true来锁住内存。因为当jvm开始swapping时es的效率 会降低,所以要保证它不swap,可以把ES_MIN_MEM和ES_MAX_MEM两个环境变量设置成同一个值,并且保证机器有足够的内存分配给es。 同时也要允许elasticsearch的进程可以锁住内存,linux下可以通过`ulimit -l unlimited`命令。
network.bind_host: 192.168.0.1
设置绑定的ip地址,可以是ipv4或ipv6的,默认为0.0.0.0。
network.publish_host: 192.168.0.1
设置其它节点和该节点交互的ip地址,如果不设置它会自动判断,值必须是个真实的ip地址。
network.host: 192.168.0.1
这个参数是用来同时设置bind_host和publish_host上面两个参数。
transport.tcp.port: 9300
设置节点间交互的tcp端口,默认是9300。
transport.tcp.compress: true
设置是否压缩tcp传输时的数据,默认为false,不压缩。
http.port: 9200
设置对外服务的http端口,默认为9200。
http.max_content_length: 100mb
设置内容的最大容量,默认100mb
http.enabled: false
是否使用http协议对外提供服务,默认为true,开启。
gateway.type: local
gateway的类型,默认为local即为本地文件系统,可以设置为本地文件系统,分布式文件系统,hadoop的HDFS,和amazon的s3服务器,其它文件系统的设置方法下次再详细说。
gateway.recover_after_nodes: 1
设置集群中N个节点启动时进行数据恢复,默认为1。
gateway.recover_after_time: 5m
设置初始化数据恢复进程的超时时间,默认是5分钟。
gateway.expected_nodes: 2
设置这个集群中节点的数量,默认为2,一旦这N个节点启动,就会立即进行数据恢复。
cluster.routing.allocation.node_initial_primaries_recoveries: 4
初始化数据恢复时,并发恢复线程的个数,默认为4。
cluster.routing.allocation.node_concurrent_recoveries: 2
添加删除节点或负载均衡时并发恢复线程的个数,默认为4。
indices.recovery.max_size_per_sec: 0
设置数据恢复时限制的带宽,如入100mb,默认为0,即无限制。
indices.recovery.concurrent_streams: 5
设置这个参数来限制从其它分片恢复数据时最大同时打开并发流的个数,默认为5。
discovery.zen.minimum_master_nodes: 1
设置这个参数来保证集群中的节点可以知道其它N个有master资格的节点。默认为1,对于大的集群来说,可以设置大一点的值(2-4)
discovery.zen.ping.timeout: 3s
设置集群中自动发现其它节点时ping连接超时时间,默认为3秒,对于比较差的网络环境可以高点的值来防止自动发现时出错。
discovery.zen.ping.multicast.enabled: false
设置是否打开多播发现节点,默认是true。
discovery.zen.ping.unicast.hosts: ["host1", "host2:port", "host3[portX-portY]"]
设置集群中master节点的初始列表,可以通过这些节点来自动发现新加入集群的节点。
下面是一些查询时的慢日志参数设置
index.search.slowlog.level: TRACE
index.search.slowlog.threshold.query.warn: 10s
index.search.slowlog.threshold.query.info: 5s
index.search.slowlog.threshold.query.debug: 2s
index.search.slowlog.threshold.query.trace: 500ms
index.search.slowlog.threshold.fetch.warn: 1s
index.search.slowlog.threshold.fetch.info: 800ms
index.search.slowlog.threshold.fetch.debug:500ms
index.search.slowlog.threshold.fetch.trace: 200ms
转载于:https://blog.51cto.com/ucode/1775157
分布式日志平台--ELKStack实践相关推荐
- 阿里PB级Kubernetes日志平台建设实践
阿里PB级Kubernetes日志平台建设实践 QCon是由InfoQ主办的综合性技术盛会,每年在伦敦.北京.纽约.圣保罗.上海.旧金山召开.有幸参加这次QCon10周年大会,作为分享嘉宾在刘宇老师的 ...
- 干货分享 | 阿里PB级Kubernetes日志平台建设实践
嘉宾 | 元乙 随着近两年的发展,Kubernetes 早已成为容器编排领域的标准,现在非常多的企业基于 Kubernetes 构建整个微服务的开发.运维平台,而日志是其中必不可少的核心功能.本文整理 ...
- 亿级 ELK 日志平台构建实践
本篇主要讲工作中的真实经历,我们怎么打造亿级日志平台,同时手把手教大家建立起这样一套亿级 ELK 系统.日志平台具体发展历程可以参考上篇 「从 ELK 到 EFK 演进」 废话不多说,老司机们座好了, ...
- ELK6.0部署:Elasticsearch+Logstash+Kibana搭建分布式日志平台
一.前言 1.ELK简介 ELK是Elasticsearch+Logstash+Kibana的简称 ElasticSearch是一个基于Lucene的分布式全文搜索引擎,提供 RESTful API进 ...
- 『分布式任务调度利器』掌握ScheduleMaster分布式任务调度平台的实践指南
- ELK 6下日志平台监控Nginx日志构建实践
整体架构 整体架构主要分为 4 个模块,分别提供不同的功能 Filebeat:轻量级数据收集引擎.基于原先 Logstash-fowarder 的源码改造出来.换句话说:Filebeat就是新版的 L ...
- 中国民生银行天眼日志平台架构演进的平凡之路
本文由 [AI前线]原创,原文链接:t.cn/RYgJ8hD AI 前线导读: "随着中国民生银行的 IT 业务系统的迅速发展,主机.设备.系统.应用软件数量不断增多,业务资源访问.操作量不 ...
- 基于Kafka+ELK搭建海量日志平台
早在传统的单体应用时代,查看日志大都通过SSH客户端登服务器去看,使用较多的命令就是 less 或者 tail.如果服务部署了好几台,就要分别登录到这几台机器上看,等到了分布式和微服务架构流行时代,一 ...
- hutool的定时任务不支持依赖注入怎么办_分布式任务调度平台xxljob的内部原理,及在转转的落地实践...
让世界因流转更美好 值此教师节来临之际,衷心祝愿所有的老师教师节快乐,身体健康,幸福平安,工作顺利,桃李满天下.您们辛苦了! 作者简介 · 杜云杰,架构师,转转架构部负责人,负责服务治理.MQ.云平台 ...
最新文章
- arc diff 指定版本号_Phabricator客户端安装
- 这年头连人用脑机接口信号都能无线传输了,瘫痪者可在家轻松上网看视频
- 阿里达摩院实习生立功!何恺明Mask R-CNN精度提升,一半输入数据量就行 | CVPR2020...
- Restful设计相关
- 【转贴】大型ORACLE数据库优化设计方案
- [转载]使用消息队列实现分布式事务-公认较为理想的分布式事务解决方案
- python mysql数据库的高级应用_Python之路第十二天,高级(5)-Python操作Mysql,SqlAlchemy...
- JAVA 面向对象的一些基础理解
- oracle sql between and 范围,oracle between and 边界有关问题
- 实用机器人设计(二)-传感器
- 恩智浦智能车一些常见的问题
- Ceph OSD简介
- 微软中国招聘职位描述(英文)
- Windows打开文件后提示,文件或目录损坏无法读取。
- Linux root密码重置
- 我的第一个html网页(完整代码)
- 2014 BUPT 新生排位赛07
- SpringBoot+Mybatis-Plus+Shiro整合的RBAC权限系统
- 微信聊天气泡设置方法!聊天气泡随意切换!瞬间个性十足!
- 【Android】更换头像的实现
热门文章
- html管道符需要转义么,为什么String.split需要管道分隔符进行转义?
- Spring5+CXF整合开发REST之一次坑旅
- php连贯操作,Thinkphp 3.2.3 sql的一些连贯操作方法
- linux内核驱动子系统,linux内核中的MFD子系统
- php eval 安全性,php – 使用eval解析表单输入的方程式的最安全的方法
- php oracle 8.1.7,Oracle 8.1.7在redhat 7.3的安装方法
- 计算机硬件技术基础 统计字符串strl中字符'a'的个数,汕头大学工学院830计算机基础综合历年考研真题202p.doc...
- MySQL获取月份最后一天
- MySQL中的调度器
- 页面背景图尺寸不随浏览器缩放而变化