aws rds监控慢sql_AWS RDS SQL Server –监视数据库实例
aws rds监控慢sql
In this article, we will review how to monitor AWS RDS SQL Server database instances and setup email notifications using event subscriptions and CloudWatch alarms.
在本文中,我们将回顾如何监视AWS RDS SQL Server数据库实例以及如何使用事件订阅和CloudWatch警报设置电子邮件通知。
Database monitoring is one of the important tasks of a database administrator to ensure availability and performance. AWS provides different tools to monitor the database instance. Below are some of the options.
数据库监视是数据库管理员确保可用性和性能的重要任务之一。 AWS提供了不同的工具来监视数据库实例。 以下是一些选项。
- Amazon RDS Events Amazon RDS活动
- Enhanced Monitoring 增强监控
- CloudWatch metrics CloudWatch指标
- CloudWatch Alarms CloudWatch警报
- Database log files 数据库日志文件
AWS RDS事件 (AWS RDS Events)
Whenever there is a backup, configuration change, snapshot, failover or maintenance, etc. on the database instance, an Amazon RDS event is created. These events can be subscribed to get an email notification. AWS RDS SQL Server uses SNS (simple notification service) to send a notification when an event occurs. These events are grouped into below categories.
只要在数据库实例上进行备份,配置更改,快照,故障转移或维护等,就会创建一个Amazon RDS事件。 可以订阅这些事件以获得电子邮件通知。 当事件发生时,AWS RDS SQL Server使用SNS(简单通知服务)发送通知。 这些事件分为以下几类。
- Availability 可用性
- Backup 后备
- Configuration change 配置变更
- Creation 创建
- Deletion 删除中
- Failover 故障转移
- Failure 失败
- Low storage 储存空间不足
- Maintenance 保养
- Notification 通知
- Read replica 读取副本
- Recovery 复苏
- Restoration 恢复
For example, when a backup is started on AWS RDS SQL Server database instance an event is created in the backup category with the description “A backup of database instance is started”.
例如,在AWS RDS SQL Server数据库实例上启动备份时,将在备份类别中创建一个事件,其描述为“数据库实例的备份已启动”。
When a new parameter group is associated with database instance by modifying the instance, an event occurs in the configuration change category with the description “A parameter group for this DB instance has changed.”
通过修改实例将新参数组与数据库实例相关联时,配置更改类别中将发生一个事件,其描述为“此数据库实例的参数组已更改。”
创建事件订阅: (Creating event subscriptions:)
To receive emails notification on the Amazon RDS events, we need to create event subscriptions.
要接收有关Amazon RDS事件的电子邮件通知,我们需要创建事件订阅。
Navigate to Amazon RDS Console, Click on Event Subscriptions and click on Create event subscription.
导航到Amazon RDS控制台,单击事件订阅 ,然后单击创建事件订阅。
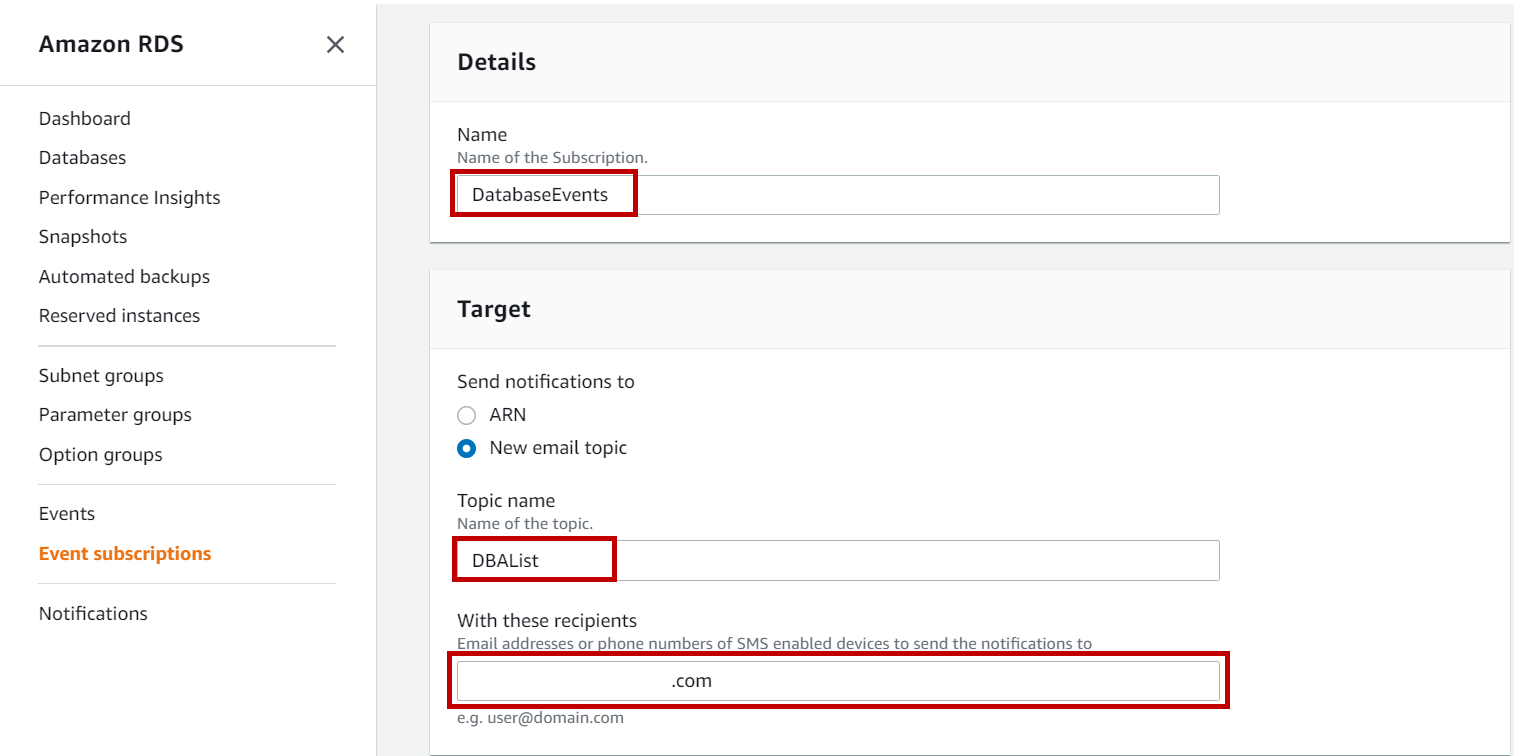
In Create event subscription page, Input the name of the subscription. Select the ARN if you already have one or create a new by selecting New email topic. Enter the topic name and the email address to send the notifications.
在“ 创建事件订阅”页面中,输入订阅的名称。 如果您已经拥有一个,请选择ARN或通过选择“ 新建电子邮件”主题来创建一个新的。 输入主题名称和电子邮件地址以发送通知。
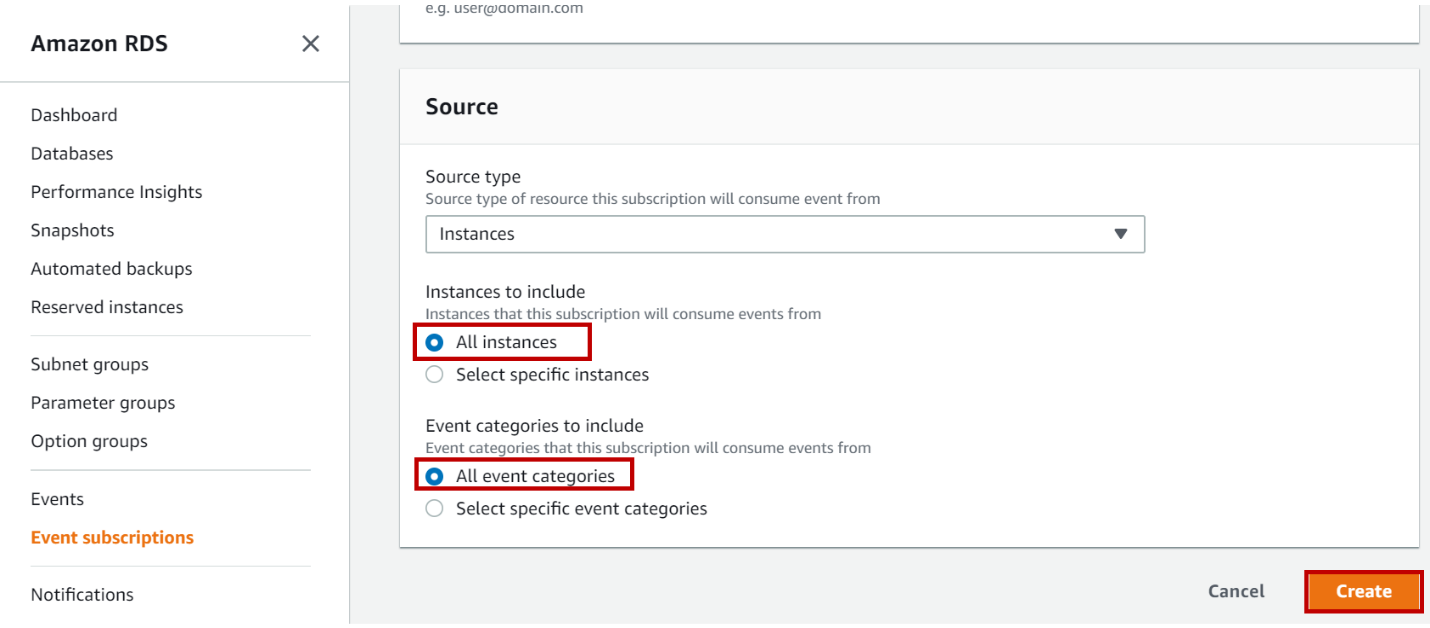
Now select the source type as instances. Select the database instances if you want to monitor specific instances else select All instances to monitor all instances in your AWS RDS SQL Server.
现在,选择源类型作为实例。 如果要监视特定实例,请选择数据库实例,否则选择所有实例以监视AWS RDS SQL Server中的所有实例。
In event categories, select the categories to include if you want to receive notifications for specific categories or select All event categories and click on Create.
在事件类别中,如果要接收特定类别的通知,请选择要包括的类别,或者选择“ 所有事件类别” ,然后单击“ 创建”。
Once you create a subscription, open your mailbox, you will receive an email with subject as “AWS Notification – Subscription Confirmation”. Click on Confirm subscription to receive email notifications whenever the event occurs.
创建订阅后,打开邮箱,您将收到一封主题为“ AWS通知-订阅确认”的电子邮件。 每当事件发生时,单击“ 确认订阅”即可接收电子邮件通知。
Once you click on Confirm Subscription, you will get a confirmation screen as below.
单击“ 确认订阅”后 ,将显示一个确认屏幕,如下所示。
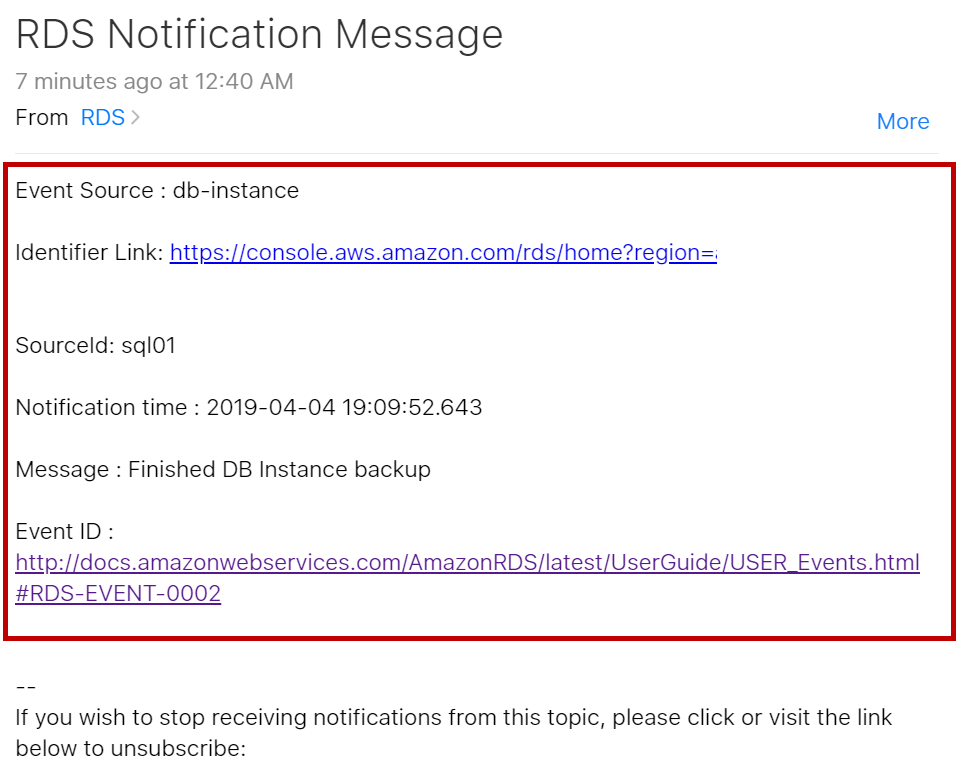
Now you will start receiving notifications when an event occurs as per categories and instances you selected while creating an event subscription. Below is sample email notification received for the backup complete event.
现在,当您在创建事件订阅时根据您选择的类别和实例发生事件时,您将开始接收通知。 以下是收到的有关备份完成事件的示例电子邮件通知。
Source id is the database instance on which event occurred. Identifier Link is the link to navigate to database instance details page directly.
源ID是发生事件的数据库实例。 标识符链接是直接导航到数据库实例详细信息页面的链接。
禁用事件订阅: (Disabling the event subscription:)
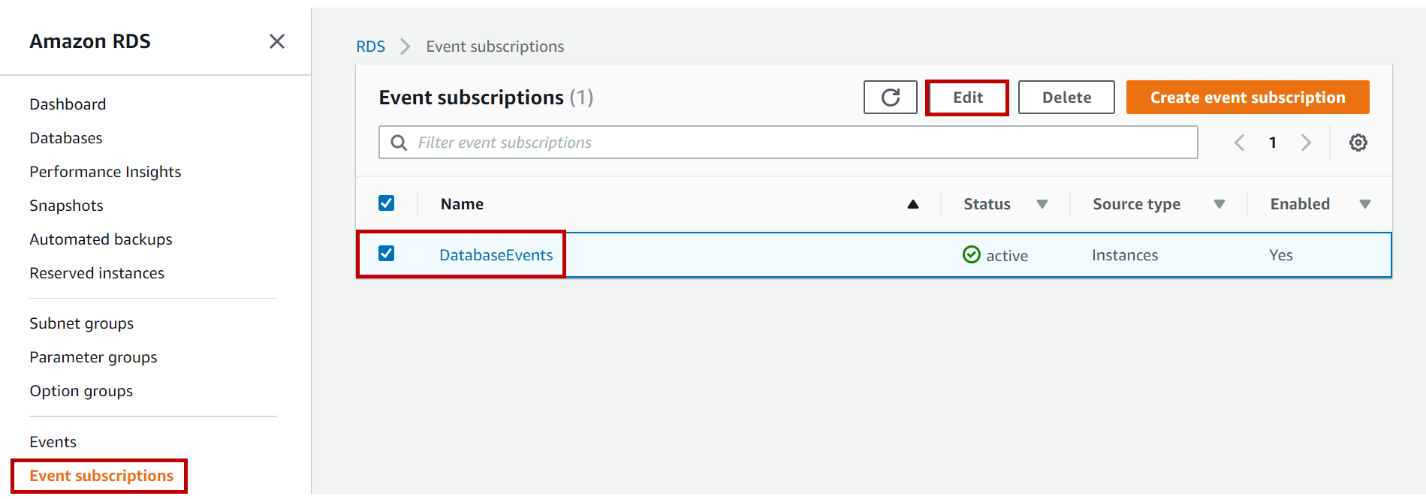
Click on Event Subscriptions. Select the subscription you want to disable and click on Edit.
单击事件订阅 。 选择要禁用的订阅,然后单击“ 编辑”。
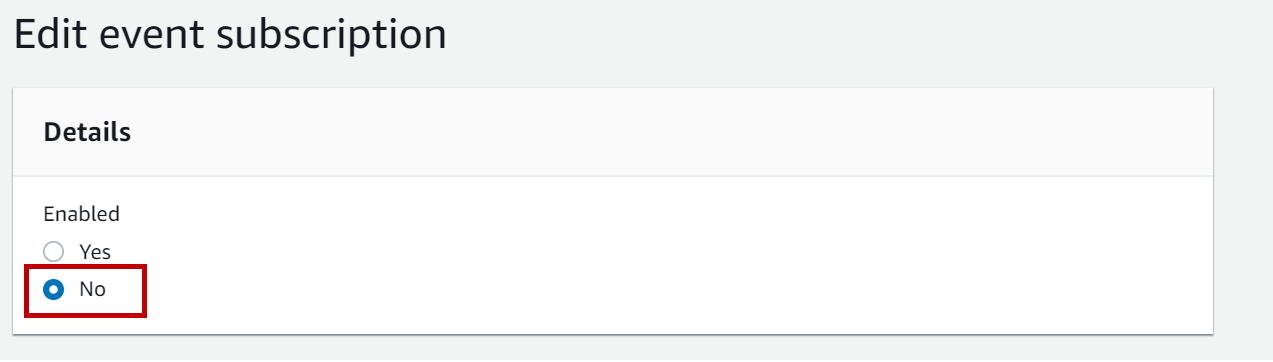
In Edit event subscription page, select No in Details -> Enabled option and click Edit at the bottom of the page.
在“ 编辑事件订阅”页面中,在“详细信息”->“启用”选项中选择“ 否” ,然后单击页面底部的“ 编辑 ”。
增强监控 (Enhanced Monitoring)
Enhanced monitoring will provide metrics in real time for the operating system where your AWS RDS SQL Server database instance run. Enhanced monitoring can be enabled while launching a new database instance. If the database instance is already launched and you want to enable enhanced monitoring, navigate the databases on AWS RDS SQL Server console and select the instance for which you want to enable enhanced monitoring and click on Modify. Select Enable enhanced monitoring, Monitoring role, and Granularity. Click on Continue and modify DB instance at the bottom of the page.
增强的监视功能将为运行您的AWS RDS SQL Server数据库实例的操作系统实时提供指标。 启动新的数据库实例时可以启用增强的监视。 如果数据库实例已经启动,并且您想要启用增强监控,请在AWS RDS SQL Server控制台上浏览数据库 ,然后选择要为其启用增强监控的实例,然后单击Modify。 选择启用增强的监视,监视角色, 和粒度。 单击继续,然后在页面底部修改数据库实例 。
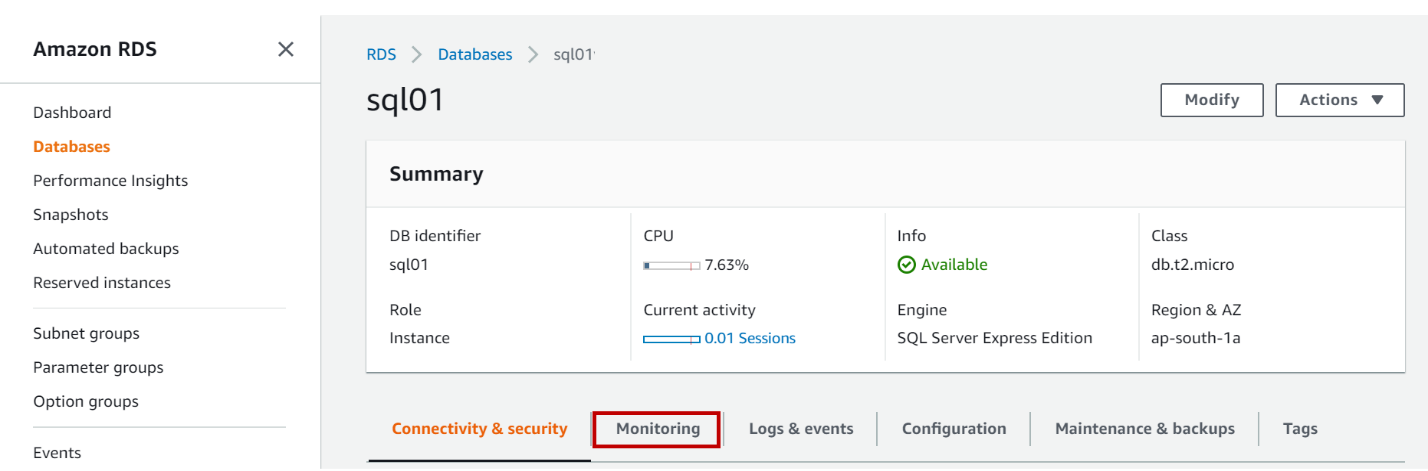
To view enhanced monitoring metrics, navigate to the databases on the AWS RDS SQL Server console, click on the database instance. In database instance details page click on Monitoring.
要查看增强的监控指标,请导航到AWS RDS SQL Server控制台上的数据库,然后单击数据库实例。 在数据库实例详细信息页面中,单击监视 。
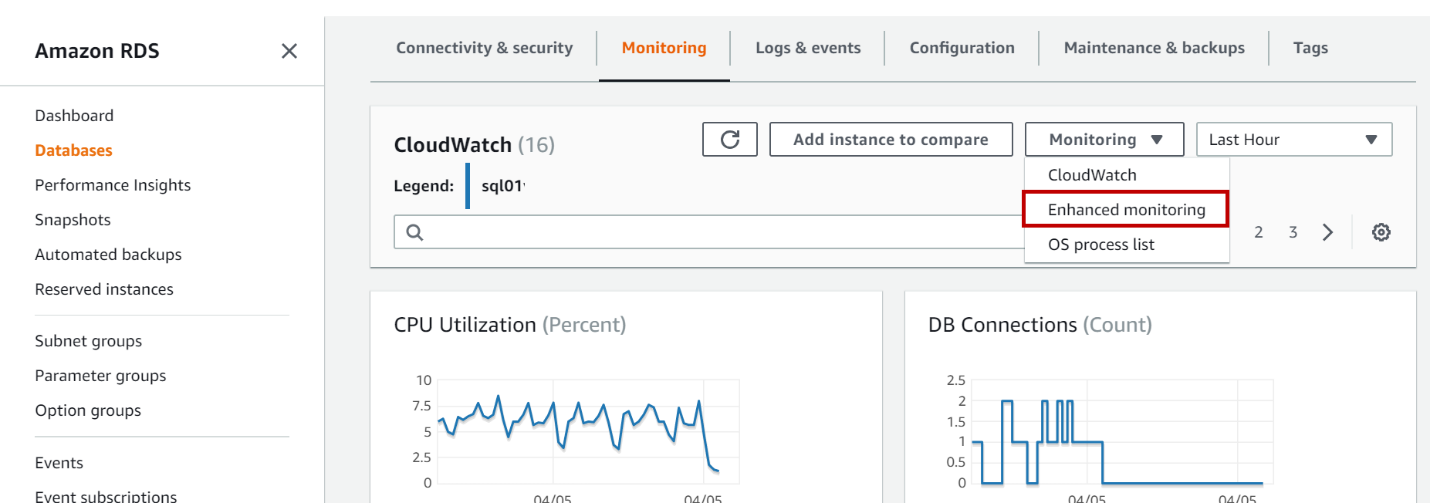
In the monitoring page, click on Monitoring drop down and select Enhanced monitoring.
在监视页面中,单击监视下拉菜单,然后选择增强监视 。
You can see the different graphs that show metrics related to Disk space, Memory and CPU. These graphs refresh the data based on Granularity you set while launching or modifying the database instance. Even though you set granularity to 1, the enhanced monitoring console refreshes every 5 seconds.
您可以看到不同的图,它们显示了与磁盘空间,内存和CPU相关的指标。 这些图根据您在启动或修改数据库实例时设置的粒度来刷新数据。 即使将粒度设置为1,增强的监视控制台也会每5秒刷新一次。
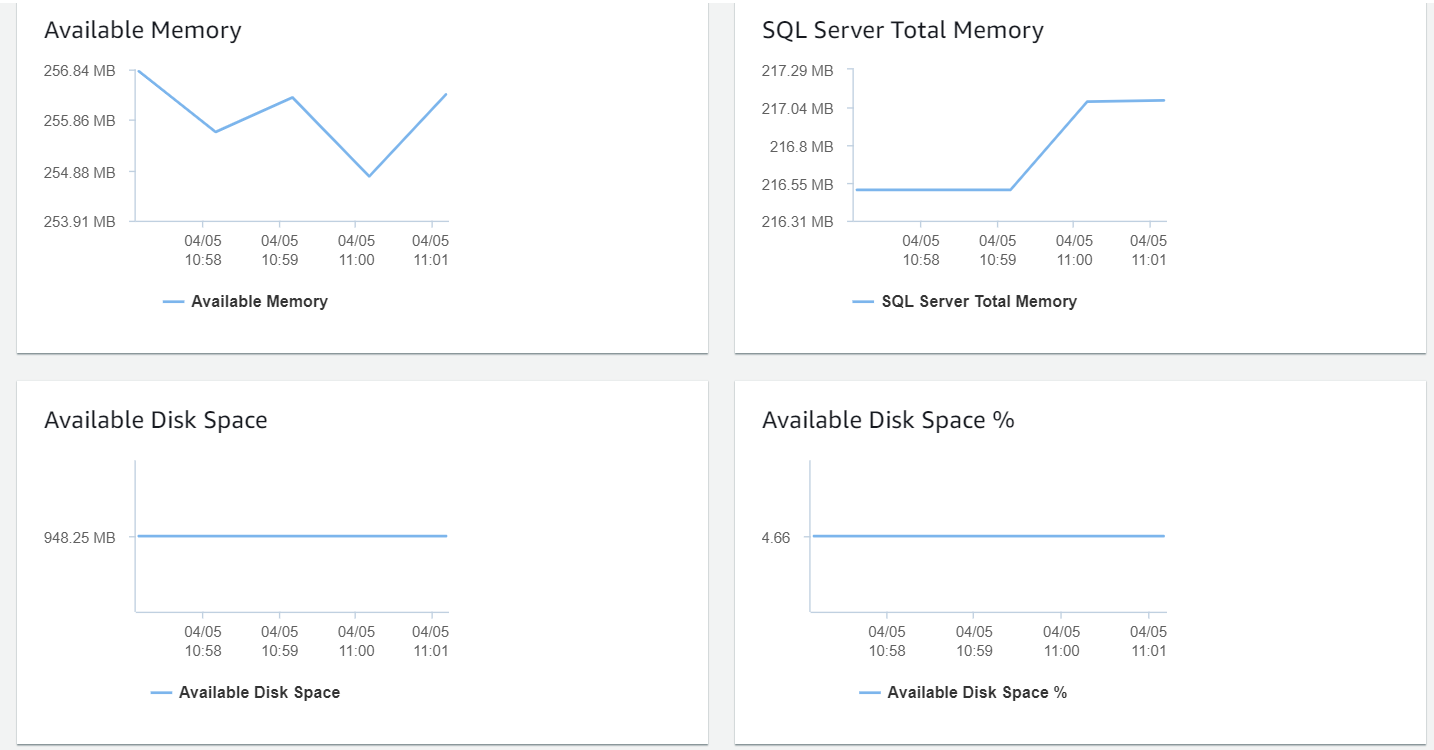
To add more graphs or remove the existing graphs you monitor, click on Manage graphs, select the options you need and click Save.
要添加更多图形或删除您监视的现有图形,请单击管理图形,选择所需的选项,然后单击保存 。
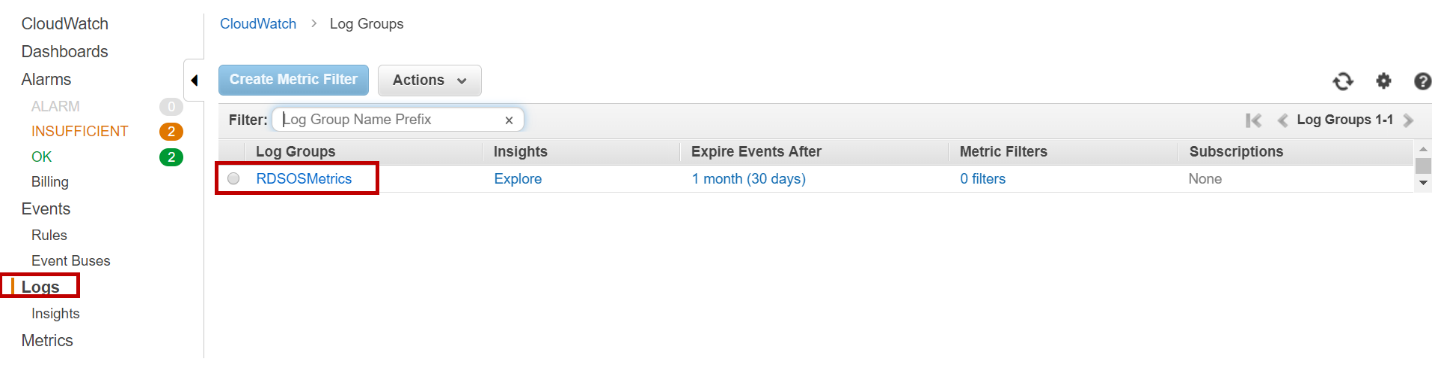
Enhanced monitoring metrics are stored in CloudWatch Logs. by default, the retention period of these logs is 30 days. If you want to modify the retention period of these logs, navigate to CloudWatch, Click on Logs. Select RDSOSMetrics group and Change the retention period under Expire Events After column.
增强的监控指标存储在CloudWatch Logs中。 默认情况下,这些日志的保留期为30天。 如果要修改这些日志的保留期限,请导航至CloudWatch,单击“ 日志”。 选择“ RDSOSMetrics”组,然后在“ 过期事件之后”列下更改保留期限。
You can also view these enhanced monitoring metrics from CloudWatch Logs. These logs will be updated based on the granularity we set in enhanced monitoring. These logs will be updated every second when the granularity is set to 1.
您还可以从CloudWatch Logs查看这些增强的监控指标。 这些日志将根据我们在增强监控中设置的粒度进行更新。 当粒度设置为1时,这些日志将每秒更新一次。
Navigate to CloudWatch Console, Click on Logs and click on RDSOSMetrics group. You will get the list of log streams. Select the latest log stream and you can see the metrics in JSON format.
导航到CloudWatch控制台,单击“ 日志” ,然后单击RDSOSMetrics组。 您将获得日志流列表。 选择最新的日志流,您可以看到JSON格式的指标。
Amazon CloudWatch指标 (Amazon CloudWatch Metrics)
AWS RDS SQL Server send the metrics of each database to CloudWatch every minute. With CloudWatch metrics we can monitor both DB instance and OS metrics.
AWS RDS SQL Server每分钟将每个数据库的指标发送到CloudWatch。 借助CloudWatch指标,我们可以监视数据库实例和操作系统指标。
在AWS RDS SQL Server控制台中查看CloudWatch指标: (Viewing CloudWatch metrics in AWS RDS SQL Server console:)
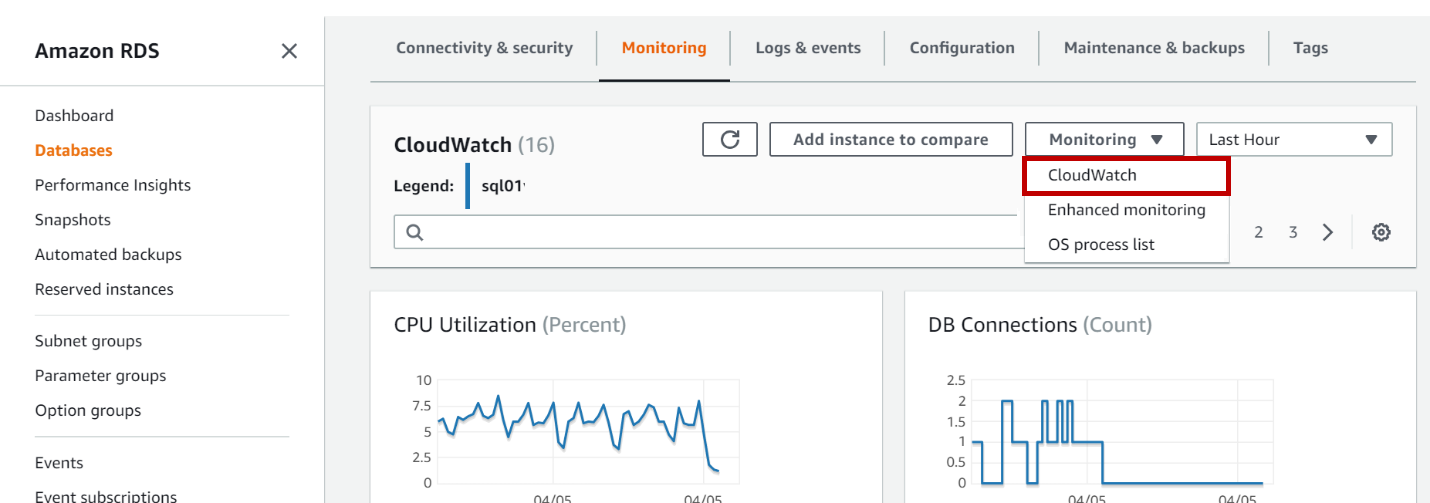
To view CloudWatch metrics, navigate to the database on the RDS menu, click on the database instance. In database instance details page click on monitoring.
要查看CloudWatch指标,请导航至RDS菜单上的数据库,然后单击数据库实例。 在数据库实例详细信息页面中,单击监视。
Click on monitoring. In the monitoring page, click on Monitoring drop down and select CloudWatch.
单击监视。 在监视页面中,单击监视下拉菜单,然后选择CloudWatch 。
在CloudWatch页面中查看CloudWatch指标: (Viewing CloudWatch metrics in CloudWatch Page:)
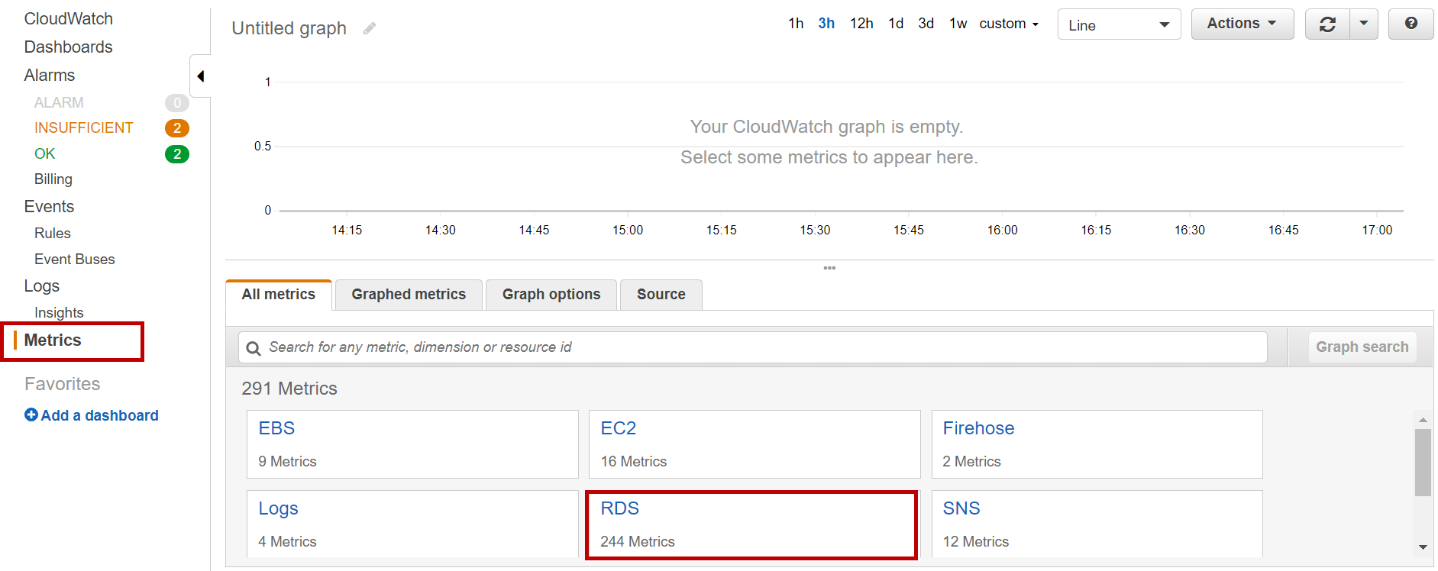
Alternatively, you can also view CloudWatch metrics by Navigating to CloudWatch page. Click on Metrics.
或者,您也可以通过导航到CloudWatch页面来查看CloudWatch指标。 点击指标 。
Click on RDS.
单击RDS。
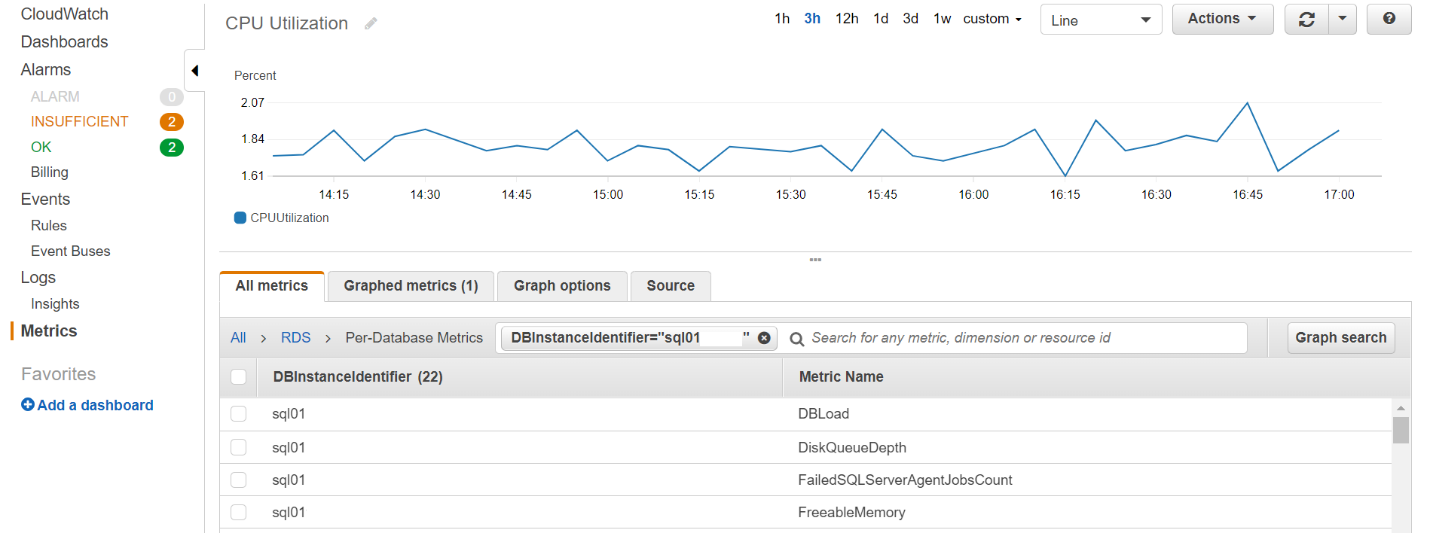
Select the dimension and the metric to view in the graph. You can select multiple metrics to show in the graph. You can also add this graph to the dashboard.
选择要在图形中查看的维度和指标。 您可以选择多个指标以显示在图形中。 您也可以将此图形添加到仪表板。
CloudWatch警报 (CloudWatch Alarms)
The CloudWatch alarm will help us to monitor a metric over a period and notify us through email if the metric value reaches the threshold value you set.
CloudWatch警报将帮助我们监控一段时间内的指标,并在指标值达到您设置的阈值时通过电子邮件通知我们。
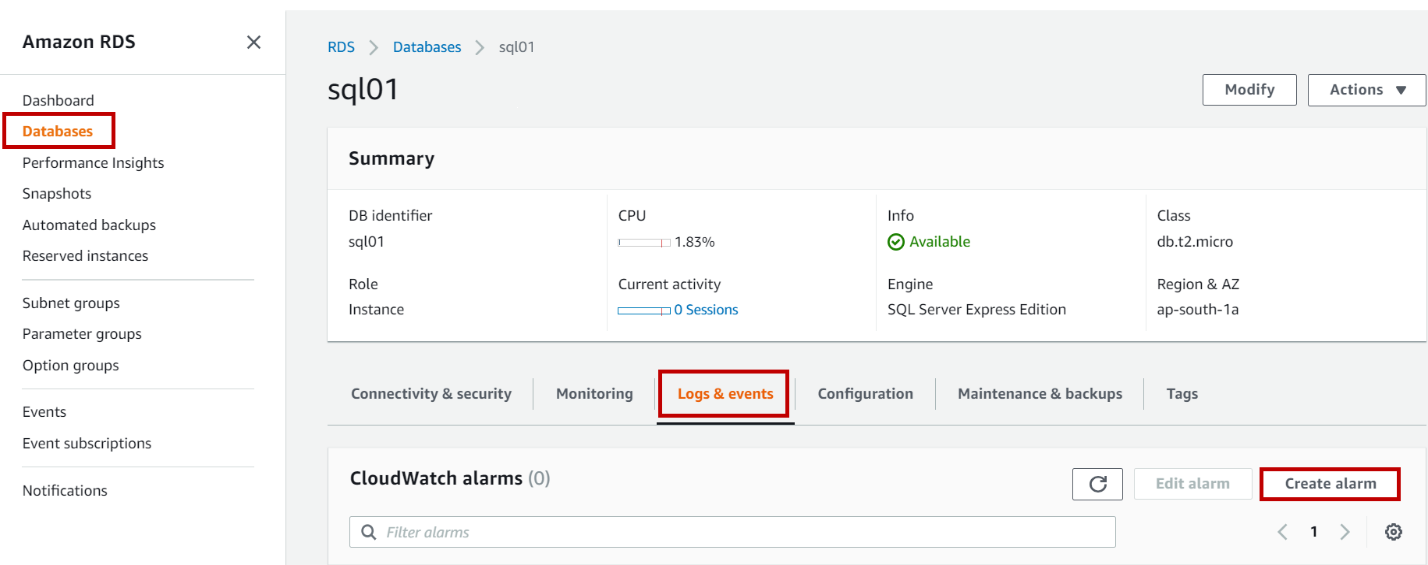
To create a CloudWatch alarm, Navigate to databases in AWS RDS SQL Server console. Click on the database instance and click on Logs and events. Click on Create alarm.
要创建CloudWatch警报,请导航到AWS RDS SQL Server控制台中的数据库。 单击数据库实例,然后单击日志和事件 。 单击创建警报 。
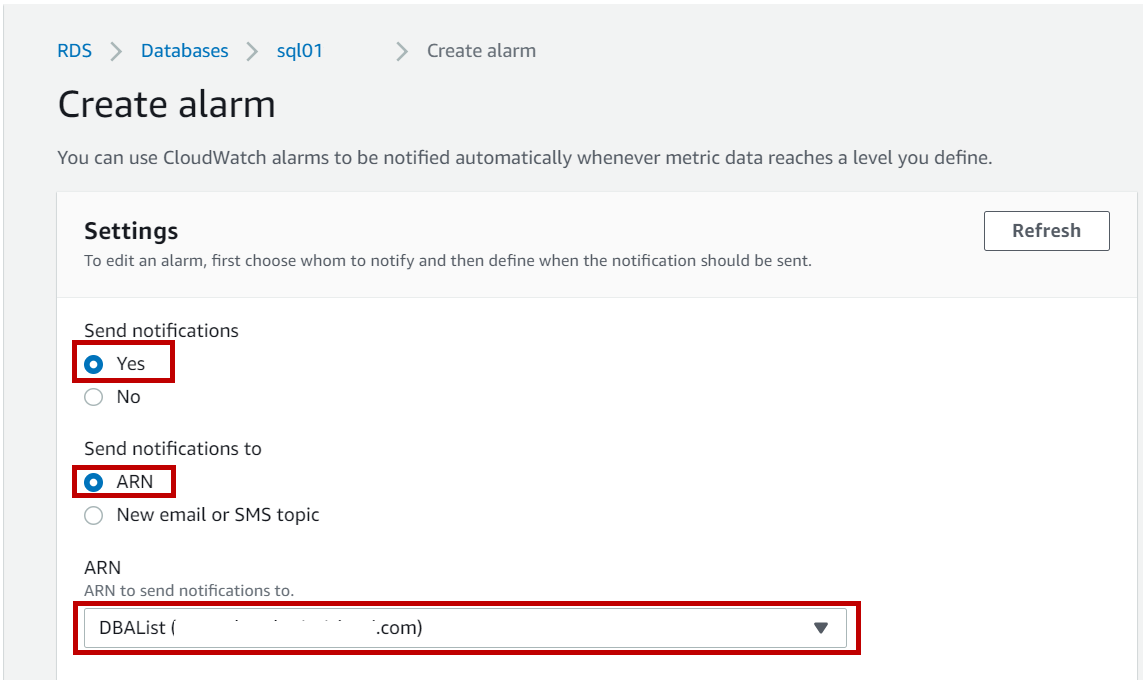
In Create alarm page, select Yes to send notifications and select the ARN if you already have one or create a new email or SMS topic.
在“创建警报”页面中,选择“ 是”以发送通知,如果已有警报或创建新电子邮件或SMS主题,则选择ARN。
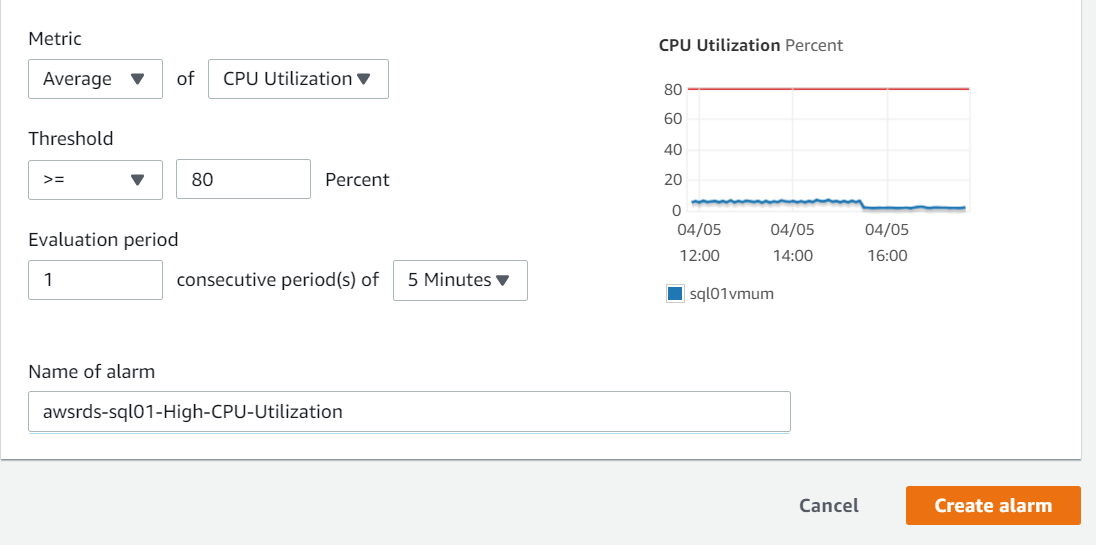
Choose the metric, evaluation period, threshold value and input the alarm name. Click on Create alarm.
选择指标,评估周期,阈值并输入警报名称。 单击创建警报。
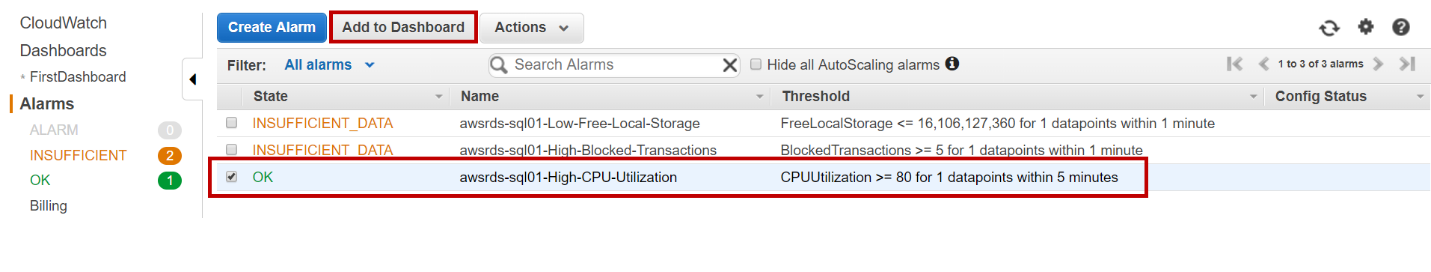
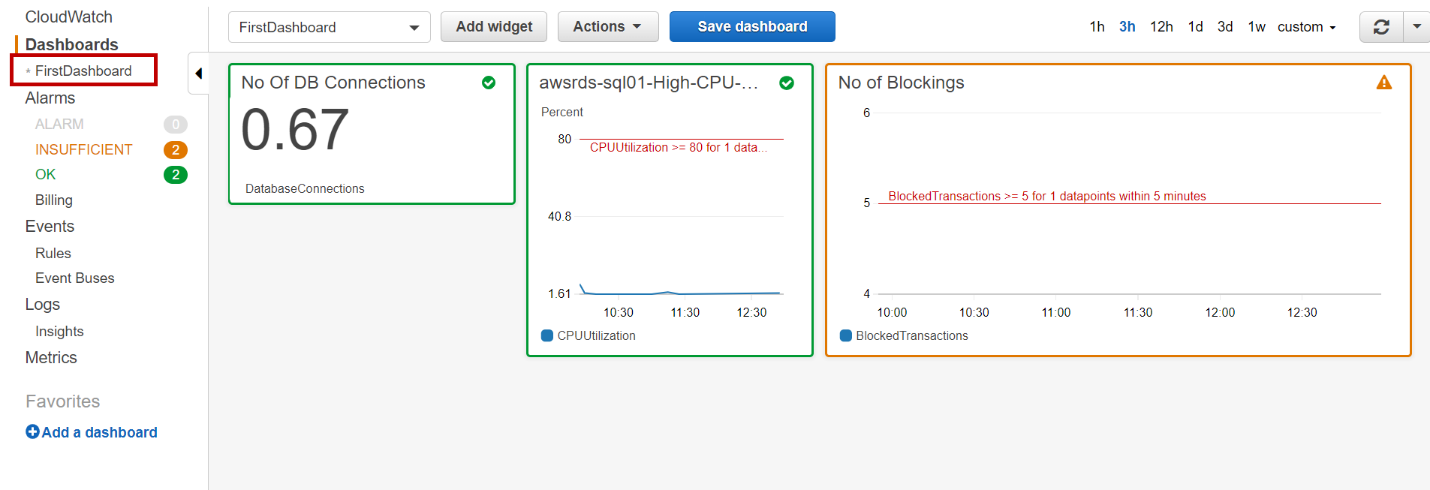
Once the alarm is created, click on view to navigate to CloudWatch alarm page where you can see the list of alarms created by you. We can modify, delete and add an alarm to a dashboard.
创建警报后,单击视图以导航到CloudWatch警报页面,您可以在其中查看由您创建的警报列表。 我们可以修改,删除警报并将其添加到仪表板。
To add an alarm to the dashboard. Navigate to CloudWatch page and click on Alarms. Select the alarm you want to add to the dashboard and click on Add to Dashboard.
向仪表盘添加警报。 导航到CloudWatch页面,然后单击Alarms 。 选择要添加到仪表板的警报,然后单击“ 添加到仪表板” 。
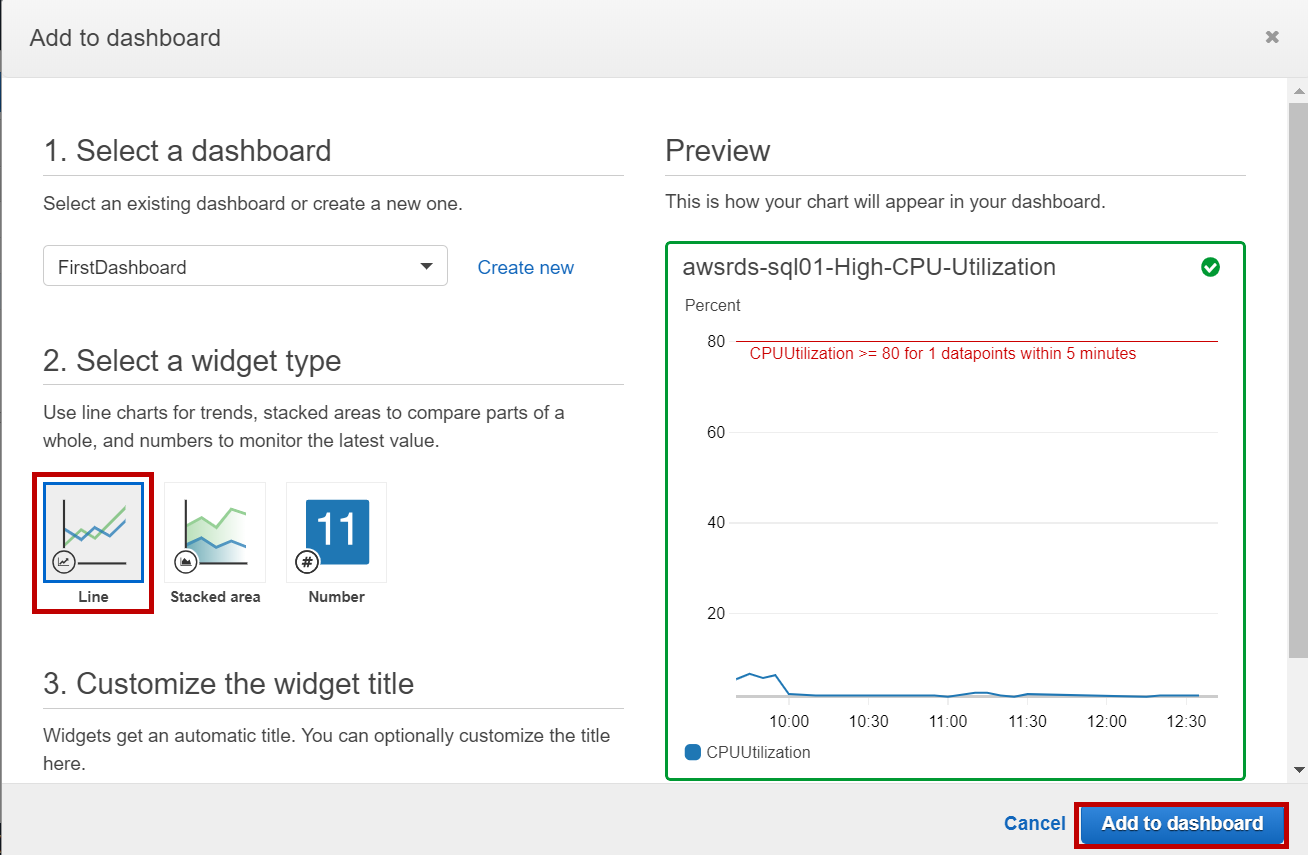
In the Add to dashboard popup, select the dashboard if you already have one else create a new one. Select the type of widget and give the name of the widget. Click on Add to the dashboard.
在“ 添加到仪表板”弹出窗口中,如果已经有一个仪表板 ,请选择一个仪表板。 选择小部件的类型并提供小部件的名称。 单击添加到仪表板 。
Now click on the dashboard name to navigate to the dashboard for a graphical view of all your alarms in one place.
现在,单击仪表板名称以导航到仪表板,以便在一处以图形方式查看所有警报。
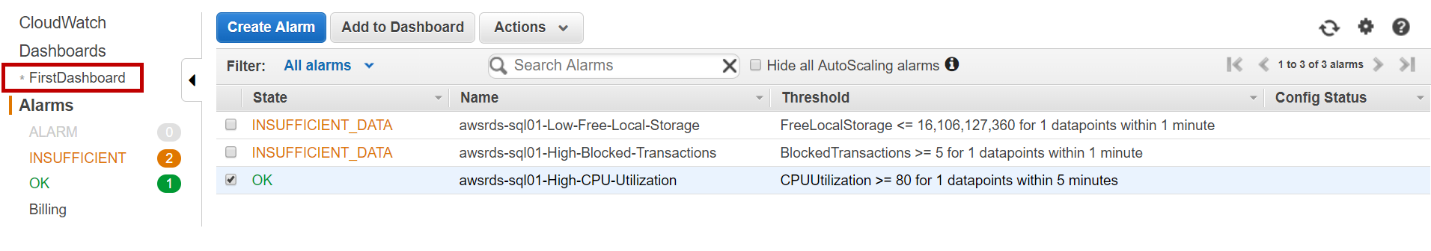
The color of the alarm indicates the state of the alarm.
警报的颜色指示警报的状态。
- Green – Ok 绿色–确定
- Yellow – Insufficient data 黄色–数据不足
- Red – Alarm state 红色–警报状态
数据库日志文件 (Database log files)
Database log files can be accessed from the AWS RDS SQL Server console. Navigate to databases in AWS RDS SQL Server console. Click on the AWS RDS SQL Server database instance and click on Logs and events.
可以从AWS RDS SQL Server控制台访问数据库日志文件。 导航到AWS RDS SQL Server控制台中的数据库。 单击AWS RDS SQL Server数据库实例,然后单击日志和事件 。
You can view, watch and download the SQL server and SQL server agent logs. Alternatively, you can use the stored procedure “rds_read_error_log” to read the log file. The retention period of these log files is 7 days.
您可以查看,观看和下载SQL Server和SQL Server代理日志。 或者,您可以使用存储过程“ rds_read_error_log”来读取日志文件。 这些日志文件的保留期为7天。
翻译自: https://www.sqlshack.com/aws-rds-sql-server-monitoring-database-instances/
aws rds监控慢sql
aws rds监控慢sql_AWS RDS SQL Server –监视数据库实例相关推荐
- aws rds监控慢sql_AWS RDS SQL Server入门
aws rds监控慢sql This article describes the concepts and steps to setup AWS RDS SQL Server(Relational D ...
- aws rds监控慢sql_AWS RDS SQL Server –启动新的数据库实例
aws rds监控慢sql This article will review on how to launch an AWS RDS SQL Server instance and how to co ...
- aws rds监控慢sql_AWS RDS SQL Server的多可用区配置
aws rds监控慢sql Amazon provides AWS RDS SQL Server as a managed relational database service. You can d ...
- aws rds监控慢sql_AWS RDS SQL Server恢复模型,备份和还原
aws rds监控慢sql This article will review about the recovery models backups and restore options in avai ...
- aws rds监控慢sql_AWS RDS SQL Server中的本机差异备份概述
aws rds监控慢sql This article explores the differential backups in AWS RDS SQL Server using recovery sc ...
- aws rds监控慢sql_AWS RDS SQL Server中的初始Windows身份验证配置
aws rds监控慢sql In this article, we will be exploring the process of enabling Windows authentication i ...
- aws rds监控慢sql_AWS RDS SQL Server中的高级Windows身份验证配置
aws rds监控慢sql This article will cover advanced configurations for Windows Authentication in AWS RDS ...
- 监控目前所有连接SQL SERVER的用户信息
原文:监控目前所有连接SQL SERVER的用户信息 if object_id('p_getlinkinfo','P')is not null drop proc p_getlinkinfo go c ...
- sql server 监视_监视SQL Server报告服务
sql server 监视 介绍 ( Introduction ) In our last get together I mentioned that oft times SQL Server rep ...
最新文章
- 微软张若非:搜索引擎和广告系统,那些你所不知的AI落地技术
- R语言ggplot2可视化分组的重叠图实战:grouped overlay plot
- nginx只允许域名访问,禁止ip访问
- crlf注入漏洞 java解决办法_HTTP响应拆分漏洞(CRLF注入攻击)解决办法
- Linux上的Shell之FAQ
- DOS下如何访问4G内存
- 哥大计算机科学学费,哥大计算机科学专业成功案例解析!!!
- sublime text3 插件安装
- 计算机26字母代码表,电脑打字学习:26个汉语拼音字母攻略
- bzoj 4199: [Noi2015]品酒大会 (后缀自动机+DP)
- 刷票投票的自动运行脚本
- 组播MAC地址和各类IP地址
- 提取富文本内容(包括去除图片)
- 安卓flash插件_Flash 终将谢幕:微软将于年底停止对 Flash 的支持
- 【记录】在win10系统上安装ubuntu(乌班图)双系统
- 计算机网络第八版(谢希仁)答案
- jconsole远程连接linux,使用jconsole远程连接linux监控jvm
- matlab function 矩阵,急:Simulink MATLAB function 如何实现矩阵输出
- WiFi路由器SRRC认证需要准备什么资料?
- 计算机双非本科毕业小结