机器学习之线性回归_通过线性回归开始机器学习之旅
机器学习之线性回归
线性回归 (Linear Regression)
Linear regression is a part of Statistics that defines the relationship between two numerical variables. It is a linear model that believes and justifies that there exists a linear relationship between two variables.
线性回归是统计的一部分,它定义了两个数值变量之间的关系。 它是一个线性模型,可以相信并证明两个变量之间存在线性关系。
It takes into account the input variable and the output variable. It implies that one can calculate from a linear combination of input variables (x).
它考虑了输入变量和输出变量。 这意味着可以根据输入变量(x)的线性组合进行计算。
线性回归模型表示 (Linear Regression Model Representation)
Linear regression can be expressed in terms of an equation as:
线性回归可以用等式表示为:
y=B0+B1*x
y = B0 + B1 * x
Where x is an input variable. ‘B’ is greek alphabet representing coefficients here which are a scalar factor assigned to each input variable. An additional coefficient has been added to incorporate the intercept or bias.
其中x是输入变量。 “ B”是希腊字母,代表此处的系数,是分配给每个输入变量的标量因子。 添加了附加系数以合并截距或偏差。
线性回归的类型 (Types of Linear Regression)
Simple Linear Regression: It takes into account a single x variable and helps in predicting output(y) variables.
简单线性回归:它考虑了单个x变量,并有助于预测输出(y)变量。
Example: When we are trying to predict the price of a house based on the square footage of the area covered by it. Here, Square footage of the house is the input variable and the price of the home is the output variable.
示例:当我们尝试根据房屋所覆盖区域的平方英尺来预测房屋价格时。 在这里,房屋的平方英尺是输入变量,房屋的价格是输出变量。
Multiple Regression: There are more than 1 input variables involved to predict output(y) variables.
多元回归:涉及多个输入变量来预测输出(y)变量。
Example: When we take an area of a house, the number of rooms, HouseStyle to predict the house price. Here, multiple input variables like the area of the house, number of rooms, HouseStyle are used to predict house price which is the output variable.
示例:当我们以房屋的面积为单位时,房间数,HouseStyle可以预测房价。 在这里,多个输入变量(如房屋面积,房间数量,HouseStyle)用于预测房屋价格,这是输出变量。
正则化 (Regularization)
It is the technique where we add information to the regression equation or reduce coefficients to zero to avoid overfitting or the complex nature of the problem. It is used when there is collinearity in input values
在这种技术中,我们将信息添加到回归方程中或将系数减小为零,以避免过度拟合或问题的复杂性。 当输入值存在共线性时使用
基于正则化的回归类型 (Types Of Regularization Based Regression)
Lasso Regression: It is also known as L1 Regularization. It is a procedure where Ordinary Least Squares is modified to reduce the absolute sum of the coefficients.
套索回归:也称为L1正则化。 这是修改普通最小二乘以减少系数的绝对和的过程。
Example: There are 10,000 features to predict variables, the Lasso model selects only a few coefficients and converts the reset to zero.
示例:有10,000个可预测变量的特征,套索模型仅选择一些系数并将重置值转换为零。
Ridge Regression: It is also known as L2 Regularization. It is a procedure where Ordinary Least Squares squared the absolute sum of the coefficients. When coefficients used in the regression are unbalanced, we introduce alpha value to improve the model. Example: When we are trying to predict the sales of outlets, the type of outlet has higher weight compared to the weight of items sold there then we introduce alpha which reduces the sum of coefficients.
岭回归:也称为L2正则化。 这是一个用普通最小二乘法对系数的绝对和求平方的过程。 当回归中使用的系数不平衡时,我们引入alpha值来改进模型。 示例:当我们试图预测网点的销售时,网点的类型比那里售出的商品的权重更高,因此我们引入alpha来减少系数的总和。
梯度下降 (Gradient Descent)
It is a process of optimizing coefficients by repeatedly minimizing the error of the model on your training data. The process involves adding learning rates and coefficients are updated for minimizing the error. It is iterated until a minimum sum square error is achieved or change is not possible.
这是通过反复最小化模型对训练数据的误差来优化系数的过程。 该过程涉及增加学习率,并且为了最小化误差而更新系数。 迭代直到达到最小和平方误差或无法更改。
Learning Rate () is the size of the improvement step for each iteration of the procedure and should be chosen decisively.
学习率()是该过程每次迭代的改进步骤的大小,应果断选择。
梯度下降的类型 (Types of Gradient Descent)
Stochastic Gradient Descent: This method looks at every example in the entire training set on every step.
随机梯度下降:此方法在每个步骤的整个训练集中查看每个示例。
Example: The training data has 200 samples then the parameters are updated for the same number of samples. It means once every individual sample is used in the model.
示例:训练数据有200个样本,然后针对相同数目的样本更新参数。 这意味着在模型中使用了每个单独的样本。
Batch Gradient Descent: This method iterates through a training set, whenever you come across a training example, you update the parameters according to the error gradient based on a single training example only.
批梯度下降:此方法遍历训练集,每当您遇到训练示例时,仅根据单个训练示例根据误差梯度更新参数。
Example: The training set has 100 samples, then the parameters of the model are updated only once based on all examples.
示例:训练集有100个样本,然后基于所有示例仅更新一次模型参数。
回归线属性 (Regression Line Properties)
Considering regression coefficients as B0 and B1, the line has the following properties:
考虑回归系数为B0和B1,该线具有以下属性:
- The line minimizes the sum of squared differences between the actual values and predicted values.该线使实际值和预测值之间的平方差之和最小。
- The regression line graphically passes through the mean of X and Y values.回归线以图形方式穿过X和Y值的平均值。
- B0 means the y-intercept of the regression line.B0表示回归线的y截距。
- B1 is the average change in Y for 1-unit change in X. It is also known as the slope of the regression line.B1是X的1个单位变化的Y的平均变化。也称为回归线的斜率。
The least-squares regression line is the only straight line that has all of these properties.
最小二乘回归线是具有所有这些属性的唯一直线。
定义输入和输出变量之间的关系 (Defining The Relationship Between Input And Output Variable)
When B1>0, x and y variables have positive relationships. It implies that x will increase y.
当B1> 0时,x和y变量具有正关系。 这意味着x将增加y。
When B1<0, x and y variables have negative relationships. It implies that x and y are inversely related, if x increases, y will decrease.
当B1 <0时,x和y变量具有负关系。 这意味着x和y成反比,如果x增加,y将减少。
For example , When we are trying to predict house price, house type, and several rooms used to define the model is known as input variables and house price is an output variable.
例如,当我们尝试预测房屋价格,房屋类型以及用于定义模型的多个房间时,将其称为输入变量,而房屋价格则是输出变量。
如何检查模型性能? (How To Check Model Performance?)
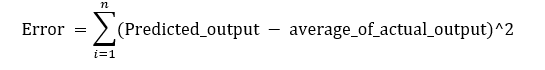
We plot the actual values and predicted values on a graph. The main idea is to find a line that best fits the data. The best line would be where the total prediction error is the smallest. Error is the distance between the point of the regression line.
我们在图表上绘制实际值和预测值。 主要思想是找到最适合数据的线。 最好的线是总预测误差最小的位置。 误差是回归线的点之间的距离。

Source: https://towardsdatascience.com/linear-regression-detailed-view-ea73175f6e86
资料来源: https : //towardsdatascience.com/linear-regression-detailed-view-ea73175f6e86
Error is squared so that positive and negative differences do not cancel each other.
误差是平方的,因此正负差异不会互相抵消。
R平方值 (R-Squared value)
This value exists from a range of 0 to 1 where 0 points to predictor X does not affect y and 1 means predictor has full effect on changes in y.
该值的范围是0到1,其中指向预测变量X的0不会影响y,指向1则意味着预测变量对y的变化具有完全的影响。
Regression sum of squares(SSR)
回归平方和(SSR)
It tells us the distance between the regression line and the actual output line.
它告诉我们回归线和实际输出线之间的距离。
2. Sum of Squared Error(SSE) It tells how much y value differs from the predicted value.
2. 平方误差之和(SSE)告诉您y值与预测值相差多少。

3. The total sum of squares (SSTO) It explains how much data points are close to mean.
3. 总平方和(SSTO)解释多少数据点接近均值。

结论 (Conclusion)
We covered the grounds of linear regression in the article. We learned about its model representation. We know about various types of regression and how we can use them in data science to predict values. We went through how we can predict based on one or more independent variables. Once we predict, we also know about how to check the model performance to know how much prediction varies from actual values.
我们在本文中介绍了线性回归的基础。 我们了解了其模型表示。 我们了解各种回归类型,以及如何在数据科学中使用它们来预测值。 我们介绍了如何根据一个或多个自变量进行预测。 一旦进行预测,我们还将知道如何检查模型性能,以了解与实际值有多少预测。
Originally published at https://www.zealousweb.com.
最初发布在 https://www.zealousweb.com 。
翻译自: https://medium.com/swlh/beginning-the-machine-learning-journey-with-linear-regression-826cdb024186
机器学习之线性回归
http://www.taodudu.cc/news/show-4299011.html
相关文章:
- 【CTR预估】The Wide and Deep Learning Model(译文+Tensorlfow源码解析)
- 【论文翻译】Frustratingly Simple Few-Shot Object Detection
- Bi-Direction attention flow for machine reading(原理篇)
- A Survey of Zero-Shot Learning: Settings, Methods, and Applications [reading notes]
- 【理论知识学习32】归纳偏差与选择性偏差(概念作用以及举例说明)
- 湖北计算机一级证书样本,湖北计算机一级(Hubei computer level).doc
- 【论文翻译】Learning from Few Samples: A Survey 小样本学习综述
- memcmp函数和memset函数的使用
- 使用CAPL 内置函数 memcpy 和memcmp 处理数组的若干问题
- c语言比较函数memcmp,c语言函数memcmp()如何比较内存前n个字节实例源码介绍
- 赶紧来修炼内功发~内存函数详解大全-memcpy、memmove、memcmp
- memcpy、memmove、memcmp、memset函数的使用说明和模拟实现
- strcmp, strncmp和memcmp的区别
- 内存函数-----Memcmp
- 如何批量将 Word 文档转为 HTML 格式
- 生成目录_将word转换成PDF
- mysql自增长
- php聚合查询,php elasticsearch 聚合查询(Aggregation)
- Elasticsearch实战(十三)---聚合搜索Aggs聚合及Count,Avg操作
- 2023最新最强网盘资源搜索引擎,聚合搜索6大网盘资源
- android微信解析失败,微信开放平台sdk解析失败
- 微信小程序 <map>: marker id should be a number
- 微信公众平台开发学习
- 指数微信互阅平台
- 下载微信支付平台证书及首次下载报错处理
- 7-2 高精度求累加和 分数 25作者 胡伟平单位 广西科技大学
- 【LOJ6713】「EC Final 2019」狄利克雷 k 次根 加强版(狄利克雷生成函数)
- 饭前一根香蕉,到底有多好!
- 数据结构c语言版胡学刚答案,哈夫曼树的建立与实现(最终版)最新版
- 怎样通过一根网线,一台电脑,做到月入过万。
机器学习之线性回归_通过线性回归开始机器学习之旅相关推荐
- 机器学习多元线性回归_过度简化的机器学习(1):多元回归
机器学习多元线性回归 The term machine learning may sound provocative. Machines do not learn like humans do. Ho ...
- 机器学习 建立模型_建立生产的机器学习系统
机器学习 建立模型 When businesses plan to start incorporating machine learning to enhance their solutions, t ...
- java 一元线性回归_一元线性回归的java实现
我们有两组数据,比如连续5年的pv与uv. 我们想预测一下,uv达到500k那么pv会是多少.当然更有意思可能是,如果销售额是500w的话,pv会是多少. 机器学习里的一元线性回归方法是比较简单的方法 ...
- python交叉验证结合线性回归_多元线性回归模型的特征选择:全子集回归、逐步回归、交叉验证...
在多元线性回归中,并不是所用特征越多越好:选择少量.合适的特征既可以避免过拟合,也可以增加模型解释度.这里介绍3种方法来选择特征:最优子集选择.向前或向后逐步选择.交叉验证法. 最优子集选择 这种方法 ...
- 机器学习葡萄酒质量_通过数据和机器学习制作出更好的啤酒和葡萄酒
机器学习葡萄酒质量 带GPS的狗,电子鼻和可倾倒完美啤酒的机器人 (GPS-Wearing Dogs, an Electronic Nose, and a Robot That Pours the P ...
- 不使用机器学习的机器视觉_我关于使用机器学习进行体育博彩的发现使博彩公司总能胜出
不使用机器学习的机器视觉 One afternoon, in the middle of my holidays the thought of using machine learning to pr ...
- 学习机器学习的项目_辅助项目在机器学习中的重要性
学习机器学习的项目 提示与建议 (Tips and Advice) There are a few questions that are asked frequently by machine lea ...
- 机器学习ai选股_自带AI机器学习的MEMS了解一下
作者: Queenie 你知道吗?每2个手机中就有1颗ST MEMS传感器,每3台车载导航仪中就有1颗ST MEMS传感器,每2个DRAM中就有1颗ST MEMS传感器,你身边的电子设备处处都有ST的 ...
- 凸优化 机器学习 深度学习_我应该在机器学习项目中使用哪个优化程序
凸优化 机器学习 深度学习 This article provides a summary of popular optimizers used in computer vision, natural ...
最新文章
- 科研团队如何探索商业化落地?这家语音AI公司用十年科学试验打了样
- 计算机在职英语,计算机在职研究生英语教学存在的不足
- Linux: 两个USB摄像头的数据采集问题
- 红帽加速开放混合云创新,助力企业成功迈向开源应用时代
- Android 中this、getContext()、getApplicationContext()、getApplication()、getBaseContext() 之间的区别...
- 页面输出缓存[转载]
- pillow 图像 基本概念
- 探索Google App Engine背后的奥秘(5)- Datastore的设计(转载)
- 发布一款给图片批量加水印的程序PicNet V1.0
- .net控件开发系列
- Unity3D之UGUI基础4:Button按钮
- excel VBA编程入门教程
- 基于xterm.js + socket.js的Web SSH
- 用计算机弹逆战的简谱,张杰逆战歌曲钢琴简谱
- 黑苹果HIDPI开启问题
- POJ 3744 Scout YYF I(矩阵快速幂优化+概率dp)
- OSChina 周五乱弹 —— 是时候动手了
- opencv将图像处理之后显示在label上(Mat转化为qimage)转换之后label显示全黑
- graphpad画生存曲线怎么样去掉删失点_手把手教你用graphpadprism绘制生存曲线
- React中文文档 8. 列表 Key