时间序列数据的多元回归_清理和理解多元时间序列数据
时间序列数据的多元回归
No matter what kind of data science project one is assigned to, making sense of the dataset and cleaning it always critical for success. The first step is to understand the data using exploratory data analysis (EDA)as it helps us create the logical approach for solving the business problem. It also allows us to identify the issues like outliers existing in our dataset.
无论分配给什么样的数据科学项目,理解数据集并清理它对于成功都是至关重要的。 第一步是使用探索性数据分析(EDA)来理解数据,因为它有助于我们创建解决业务问题的逻辑方法。 它还使我们能够识别数据集中存在的异常值之类的问题。
It is necessary to clean up these issues before starting any analysis because if our data is spewing garbage, so will our analysis. Moreover, the insights from such an analysis won’t tie up with the theoretical or business knowledge of our clients and they may lose confidence in our work.Even if the clients end up making a decision based on such an analysis but the end result will turn out to be wrong and we will be in a lot of trouble! Thus, how well we clean and understand the data has a tremendous impact on the quality of the results.
在开始任何分析之前,有必要清理这些问题,因为如果我们的数据冒出垃圾,我们的分析也将如此。 此外,这种分析的见解不会与客户的理论或业务知识相结合,他们可能会对我们的工作失去信心,即使客户最终根据这样的分析做出决定,但最终结果也会原来是错的,我们会遇到很多麻烦! 因此,我们清理和理解数据的质量对结果的质量有很大的影响。
Things get slightly more complicated when we deal with datasets having hidden properties like time series datasets. Time series datasets is a special type of data which is ordered chronologically and needs special attention for handling it’s intrinsic elements like trend and seasonality.
当我们处理具有隐藏属性(例如时间序列数据集)的数据集时,事情会变得稍微复杂一些。 时间序列数据集是一种特殊的数据类型,按时间顺序排序,在处理其诸如趋势和季节性之类的内在要素时需要特别注意。
For these reasons, We will be focusing on a step-by-step guideline that walks through the EDA and data cleaning process one can follow while working with multivariate time series data.
由于这些原因,我们将重点关注逐步指南,该指南逐步介绍了在处理多元时间序列数据时可以遵循的EDA和数据清理过程。
指数: (Index:)
- Understanding time series data — The Theory了解时间序列数据-理论
- EDA (inspection, data profiling, visualizations)EDA(检查,数据分析,可视化)
- Data Cleaning (missing data, outlier detection and treatment)数据清理(丢失数据,异常检测和处理)
- Final words最后的话
了解时间序列数据-理论 (Understanding time series data — The Theory)
One of the best freely available sources to learn about time series analysis is the book ‘Forecasting Principles and Practices’ by Rob J Hyndman and George Athanasopoulos. Both of them are professors at Monash University, Australia and Rob was Editor-in-Chief of the International Journal of Forecasting and a Director of the International Institute of Forecasters from 2005 to 2018. I am going to summarize some of the basic elements of a time series dataset here and for further details, please refer to the mentioned book.
Rob J Hyndman和George Athanasopoulos所著的“ 预测原理和实践 ”一书是学习时间序列分析的最佳免费资源之一。 他们都是澳大利亚莫纳什大学(Monash University)的教授,罗布(Rob)是2005年至2018年《 国际 预测》杂志的主编和国际预测协会的主任。我将总结一下时间序列数据集,有关更多详细信息,请参阅上述书籍。
时间序列数据的元素 (Elements of Time Series Data)
A time series data can be considered a list of numbers, along with information about when those numbers were recorded.Most commonly, a time series is a sequence taken at successive equally spaced points in time.Time series data is composed of four elements:
时间序列数据可以看作是一个数字列表以及有关记录这些数字的时间的信息。最常见的是,时间序列是在连续的等间隔时间点上获取的序列。时间序列数据由四个元素组成:

Decomposition techniques help us extract trend, seasonality and error/irregular components of a time series dataset. There are multiple decomposition techniques but we will be focusing on the additive method in this blog in the EDA section.
分解技术可帮助我们提取时间序列数据集的趋势,季节性和误差/不规则分量。 有多种分解技术,但在本博客的EDA部分中,我们将重点介绍加法。
平稳性 (Stationarity)
In the most intuitive sense, a stationary time series is one whose properties do not depend on the time at which the series is observed. Thus, time series with trends, or with seasonality, are not stationary — the trend and seasonality will affect the value of the time series at different times.
从最直观的意义上说,固定时间序列是一个其属性不依赖于观察该时间的时间的序列。 因此,具有趋势或季节性的时间序列不是固定的-趋势和季节性将影响不同时间的时间序列的值。

Why is this property important? Stationary processes are easier to model as the way they change is predictable and stable. For most models involving time series, we will find ourselves determining if the data was generated by a stationary process, and if not, then we possibly need to transform it so it has the properties generated by such a process.
为什么这个属性很重要? 平稳过程更容易模型,因为他们改变的方式是可以预见的,稳定的。 对于大多数涉及时间序列的模型,我们将发现自己确定数据是否是由固定过程生成的,如果不是,则可能需要对其进行转换,使其具有由该过程生成的属性。
ACF和PACF (ACF and PACF)
Autocorrelation (ACF) and partial autocorrelation (PACF) plots are heavily used to determine stationarity and time series model parameters.These plots graphically summarize the strength of a relationship with an observation in a time series with observations at prior time steps.
自相关(ACF)和局部自相关(PACF)图被大量用于确定平稳性和时间序列模型参数,这些图以图形方式总结了时间序列中与观测值的关系强度以及先前时间步长的观测值。
For ACF plots, we calculate the correlation for time series observations with observations with previous time steps, called lags. The PACF plot is a summary of the relationship between an observation in a time series with observations at prior time steps with the relationships of intervening observations removed. Such time plots for a stationary process will have start having statistically insignificant values within the first few lags.
对于ACF图,我们计算时间序列观测值与具有先前时间步长的观测值(称为滞后)的相关性。 PACF图是时间序列中的观测值与先前时间步长的观测值之间的关系的摘要,其中删除了中间观测值的关系。 固定过程的此类时间图将在头几个滞后内开始具有统计上无关紧要的值。
EDA(检查,数据分析,可视化) (EDA (inspection, data profiling, visualizations))
To share my understanding of the common concepts and techniques on EDA, we will work on the multivariate time series dataset on Hong Kong flat prices along with various macro economics variables. It is a daily dataset starting from 2nd January 2003 and goes on till 26th November 2019. The dataset is available in Kaggle.
为了分享我对EDA的通用概念和技术的理解,我们将研究香港统一价格的多元时间序列数据集以及各种宏观经济变量。 它是一个每日数据集,从2003年1月2日开始,一直持续到2019年11月26日。该数据集可在Kaggle中获得 。
To begin with, we imported necessary python libraries (for this example pandas, numpy,matplotlib etc) and loaded the data set.
首先,我们导入了必要的python库(例如pandas,numpy,matplotlib等)并加载了数据集。
查看数据并检查字段类型 (Looking at the data and checking field types)

- To take a closer look at the data, used “ .head()”function of pandas library which returns first five observations of the data. Similarly “.tail()” returns last five observations of the data set.为了更仔细地查看数据,使用了熊猫库的“ .head()”函数,该函数返回数据的前五个观察值。 同样,“。tail()”返回数据集的最后五个观察值。
- We found out the total number of rows and columns in the data set and data type of each column using “.info” function.Dataset comprises of 4233 observations and 14 columns. All the columns have the correct data format (Date is in datetime format and the rest are float). None of the columns have any null values我们使用“ .info”函数找出数据集中的行和列总数以及每一列的数据类型。数据集包含4233个观察值和14列。 所有列均具有正确的数据格式(日期为日期时间格式,其余为浮点型)。 所有列均无空值
获取摘要统计 (Get summary statistics)
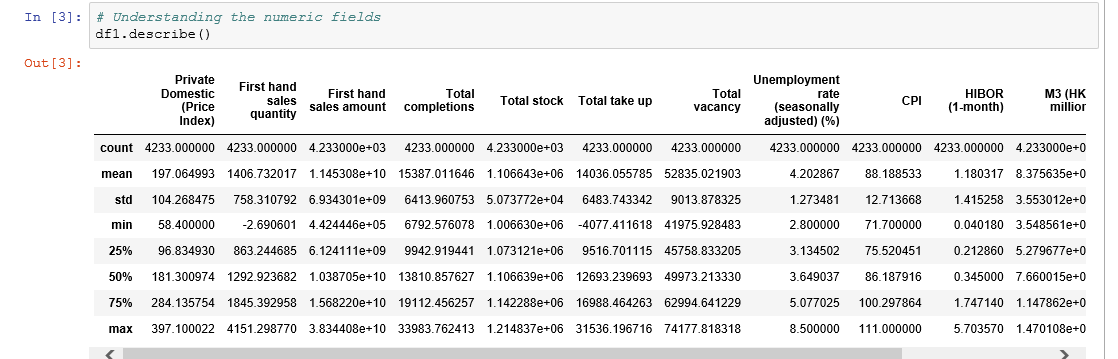
- Here as you can notice mean value is more than median value of most columns which is represented by 50%(50th percentile) in index column.在这里您可以注意到,平均值大于大多数列的中位数,这由索引列中的50%(第50个百分位数)表示。
- There is notably a big difference between 75th percentile and max values of certain fields like “First hand sales quantity”,”First hand sales amount”,”Total completions” etc.第75个百分位数与某些字段(例如“第一手销售数量”,“第一手销售数量”,“完成总数”等)的最大值之间存在很大差异。
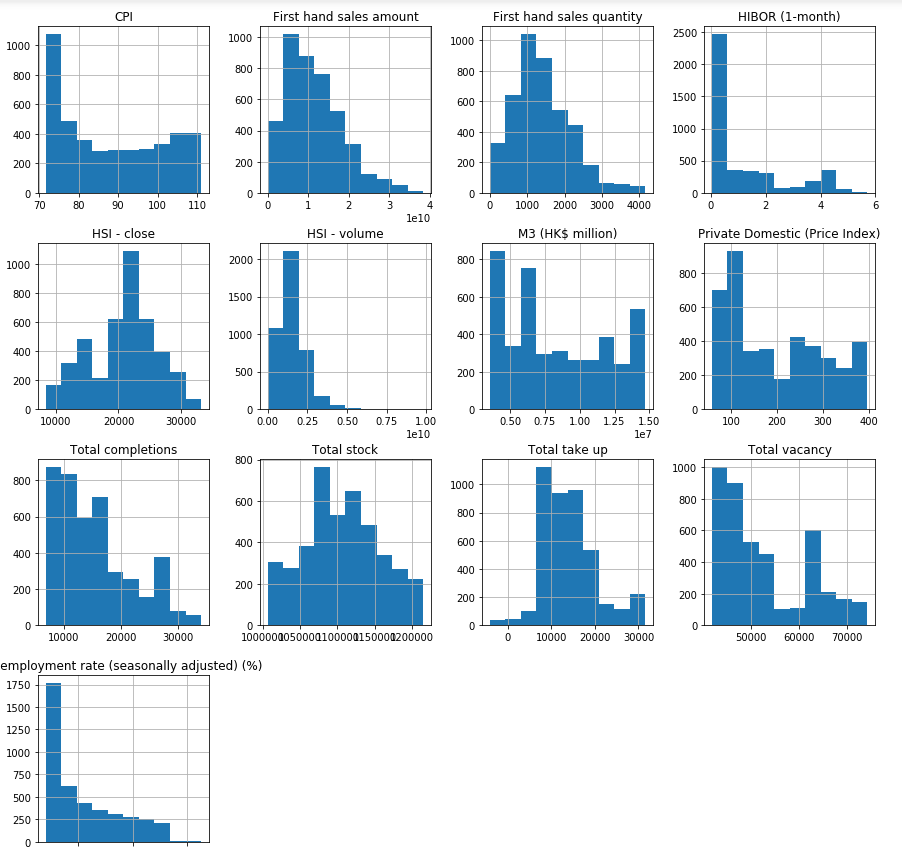
- Thus observations 1 and 2 suggests that there are extreme values-Outliers in our data set. We get the same conclusion once we look at the histograms of all the numeric fields.因此,观察值1和2表明在我们的数据集中存在极值-离群值。 查看所有数字字段的直方图,我们将得出相同的结论。
检查目标变量的时间序列属性 (Checking time series properties of target variable)
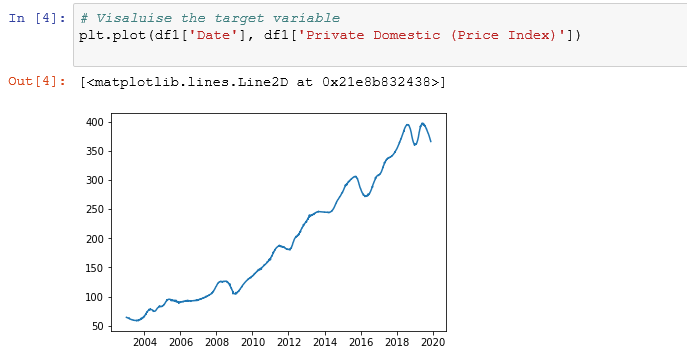
- Target variable/Dependent variable (‘Private Domestic (Price Index)’)has a rising trend目标变量/因变量(“国内私有(价格指数)”)呈上升趋势
- There is a seasonal dip in most years.大多数年份都有季节性下降。
- The variation in 2020 are extreme compared to overall trend与整体趋势相比,2020年的变化是极端的
- The target variable is not stationary目标变量不是固定的
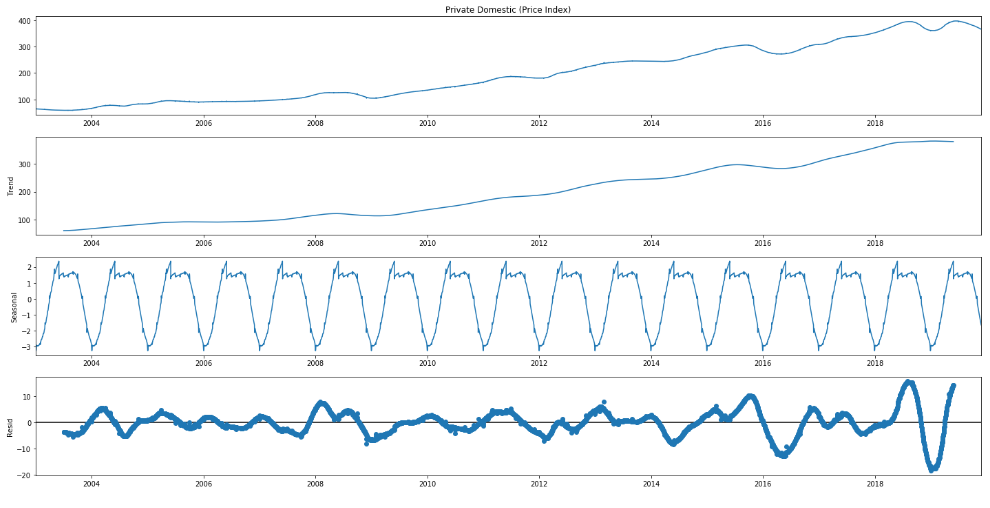
We have used the additive model for decomposition which assumes that the time series data is structured in the following manner:
我们已使用加法模型进行分解,该模型假定时间序列数据的结构如下:
Time Series Data = Trend + Seasonal + Random
时间序列数据=趋势+季节性+随机
- We can observe that the seasonal pattern is a regularly repeating pattern and that the trend is upward sloping but it is not a smooth line.我们可以观察到,季节性模式是有规律的重复模式,并且趋势呈向上倾斜,但不是一条平滑线。
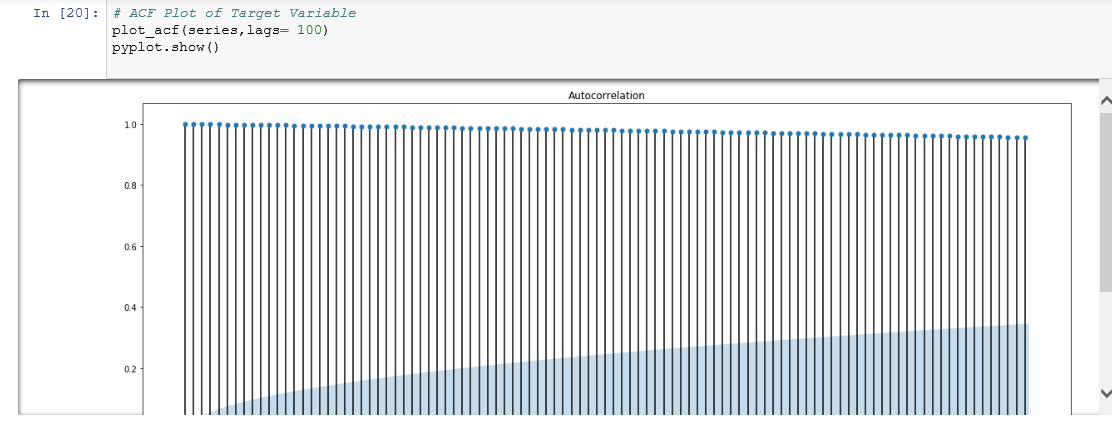
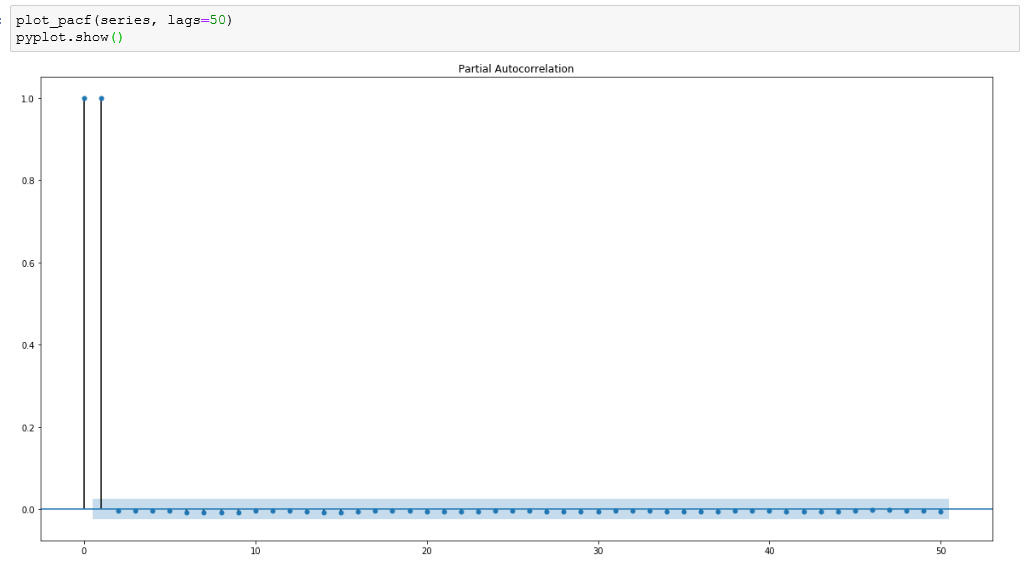
- The dataset is highly non-stationary as can be seen from the ACF and PACF plots.从ACF和PACF图可以看出,该数据集非常不稳定。
数据清理(丢失数据,异常值检测和处理) (Data Cleaning (missing data , outliers detection and treatment))
Data cleaning is the process of identifying and correcting inaccurate records from a dataset along with recognising unreliable or irrelevant parts of the data. We will be focusing on handling missing data and outliers in this blog.
数据清理是从数据集中识别和纠正不正确记录的过程,同时还要识别数据中不可靠或不相关的部分。 在此博客中,我们将专注于处理丢失的数据和异常值。
缺失数据 (Missing Data)
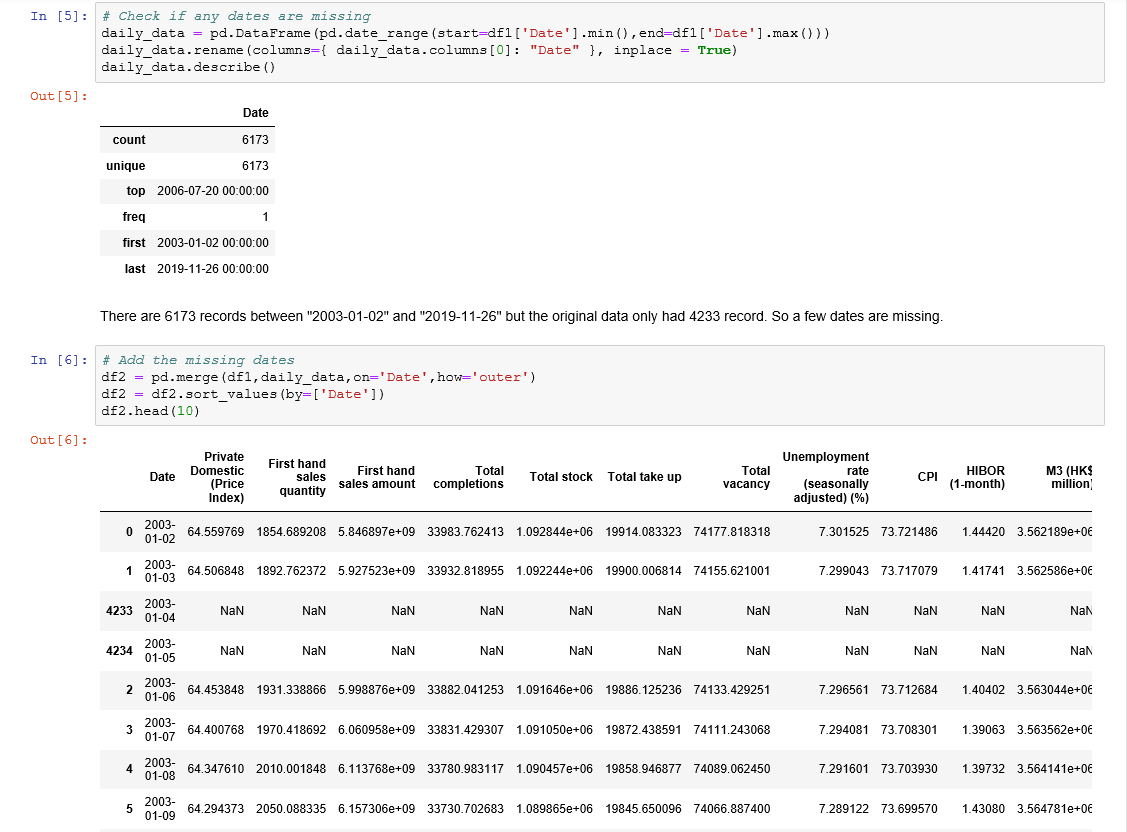
- Our raw data starts from “2003–01–02” and ends at “2019–11–26”. There are 6173 days between “2003–01–02” and “2019–11–26” but the original data only had 4233 record. So a few dates are missing.我们的原始数据从“ 2003-01-02”开始,到“ 2019-11-26”结束。 从“ 2003-01-02”到“ 2019-11-26”之间有6173天,但是原始数据只有4233条记录。 因此缺少一些日期。
- We create a new dataset with all the 6173 dates and join the original dataset with this new dataset. This leads to null values for all the record not available in the original dataset.我们使用所有6173个日期创建一个新数据集,并将原始数据集与此新数据集连接。 这将导致原始数据集中不可用的所有记录的空值。
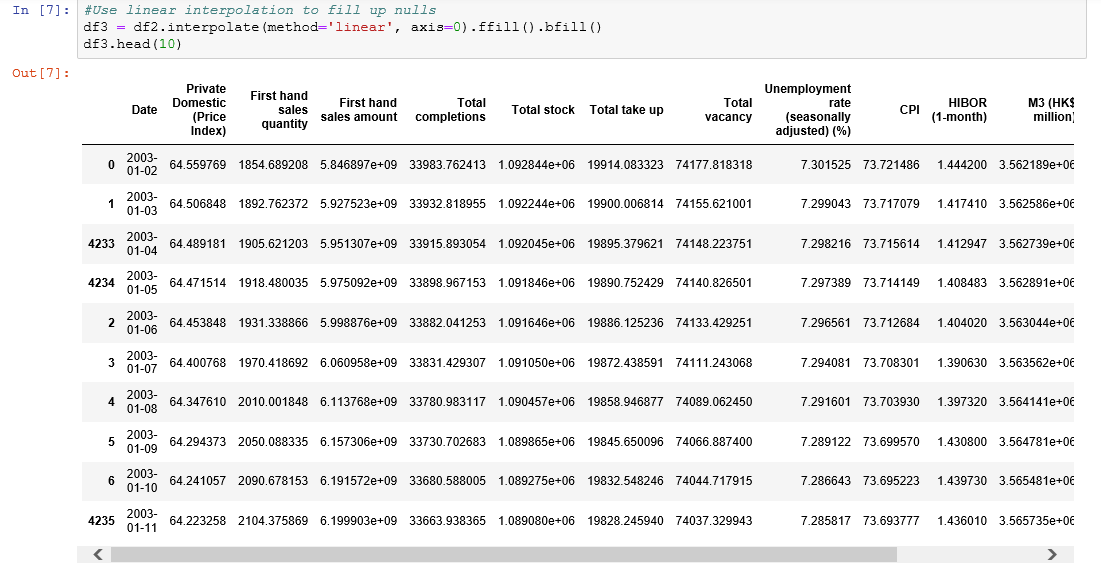
- We use linear interpolation to fill in the null values我们使用线性插值来填充空值
离群值检测 (Outlier detection)
Wikipedia definition,
维基百科的定义,
In statistics, an outlier is an observation point that is distant from other observations.
在统计中, 离群 点是与其他观测值相距较远的观测点。
To ease the discovery of outliers, we have plenty of methods in statistics, but we will only be discussing few basic techniques (interquartile range, standard deviation) here. In a separate blog, I will be focusing on the advanced methods.
为了简化离群值的发现,我们在统计数据中提供了很多方法,但是在这里我们将只讨论一些基本技术(四分位间距,标准差)。 在另一个博客中,我将重点介绍高级方法。
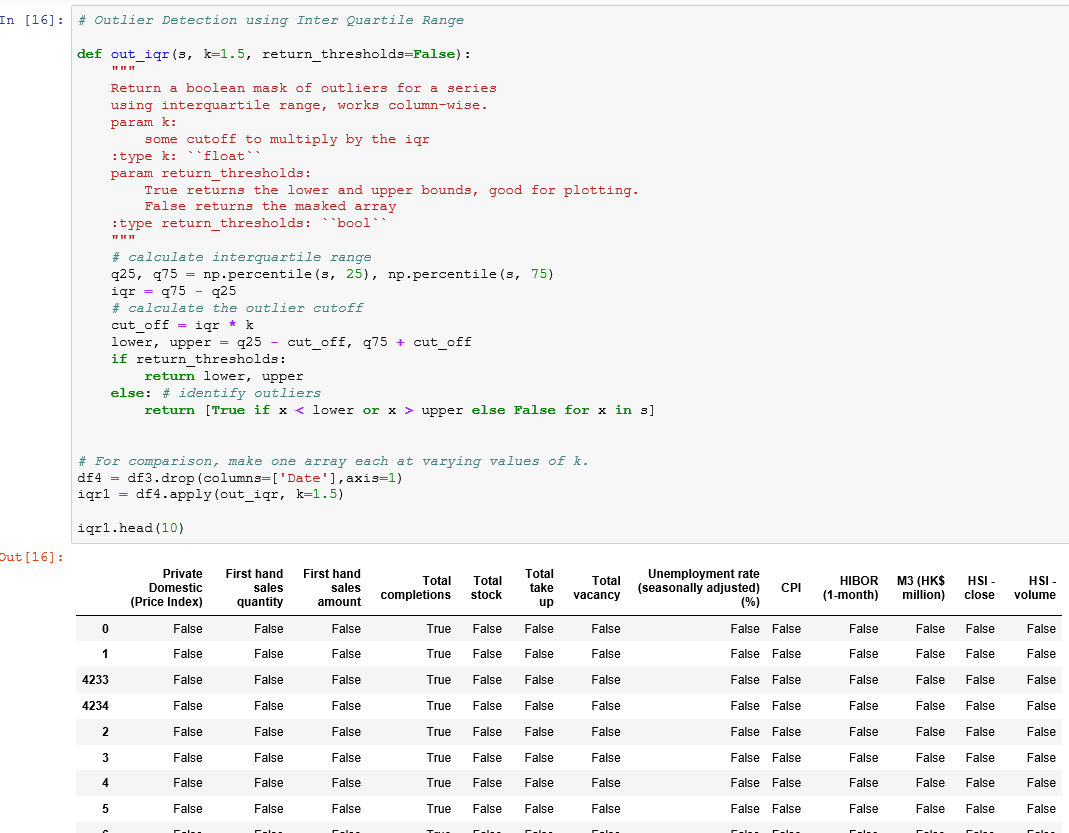
The Interquartile range (IQR) is calculated as the difference between the 75th and the 25th percentiles of the data.The IQR can be used to identify outliers by defining limits on the sample values that are a factor k of the IQR below the 25th percentile or above the 75th percentile. The common value for the factor k is the value 1.5 (which we have used here). A factor k of 3 or more can be used to identify values that are extreme outliers or “far outs”.
四分位间距(IQR)由数据的第75个百分位数和第25个百分位数之间的差计算得出.IQR可以通过定义样本值的限制来识别异常值,这些样本值是IQR的第25个百分位数以下的因数k或高于第75个百分点。 因子k的公共值为1.5(我们在这里使用)。 3或更大的系数k可用于识别极端离群值或“ 远距 ”值。
- For the initial values, fields like ‘Total Completion’ have a lot of outliers.对于初始值,“总计完成”之类的字段有很多异常值。
- If we know that the distribution of values in the sample is Gaussian or Gaussian-like, we can use the standard deviation of the sample as a cut-off for identifying outliers.Three standard deviations from the mean is a common cut-off in practice for identifying outliers in a Gaussian or Gaussian-like distribution. For smaller samples of data, perhaps a value of 2 standard deviations (95%) can be used, and for larger samples, perhaps a value of 4 standard deviations (99.9%) can be used.如果我们知道样本中值的分布是高斯或类高斯分布,则可以使用样本的标准偏差作为识别异常值的分界点。与平均值的三个标准差是实践中的常见分界点用于识别高斯或高斯分布中的离群值。 对于较小的数据样本,也许可以使用2个标准偏差(95%)的值,对于较大的样本,也许可以使用4个标准偏差(99.9%)的值。
离群值处理 (Outlier treatment)
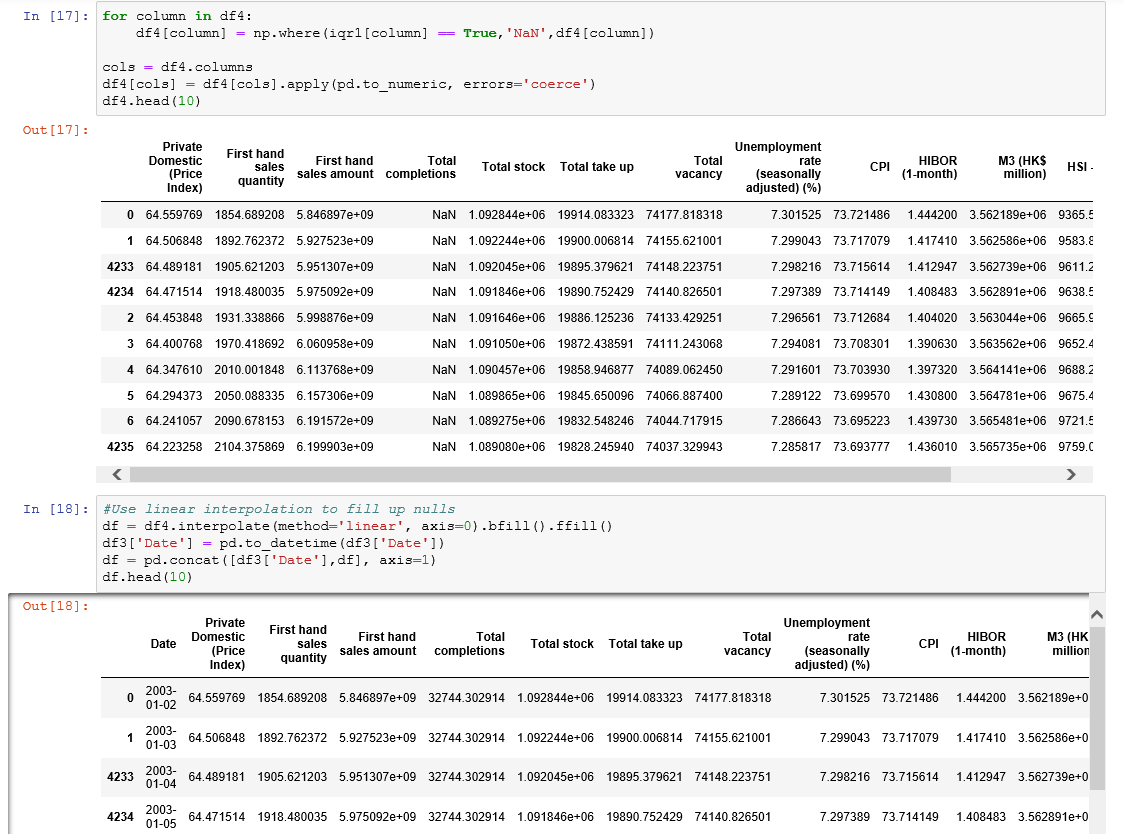
- All the identified outliers are replaced by nulls first.首先将所有标识的异常值替换为零。
- Then the nulls are filled by linear interpolation. In a separate blog, a more robust approach to replace outliers will be discussed.然后,通过线性插值填充零点。 在单独的博客中,将讨论一种更健壮的方法来替换异常值。
最后的话 (Final Words)
I hope this blog helps the readers make sense of their datasets as well handle some of the issues with messy data. Apart from the that, the readers should now be able to understand the basic elements of a time series dataset as well. But it is important to understand that each dataset comes has its own unique challenges and will need a customized approach to make the data usable.
我希望这个博客可以帮助读者理解他们的数据集,并解决一些数据混乱的问题。 除此之外,读者现在还应该能够理解时间序列数据集的基本元素。 但重要的是要了解,每个数据集都有其独特的挑战,并且需要一种定制的方法来使数据可用。
These are some of the questions one should always ask while working with a new dataset:
这些是在使用新数据集时应始终提出的一些问题:
How the data is collected, and under what conditions?
如何收集数据,在什么条件下收集数据?
What does the data represent?
数据代表什么?
What are the issues in the dataset? Are there any outliers?
数据集中有什么问题? 有离群值吗?
What methods should be used to clean the data and why?
应该使用什么方法清除数据,为什么?
This is a first blog in a series focused on creating a robust forecasting engine based on a multivariate time series data. The next blog will focus on feature engineering and selection. Stay tuned!
这是该系列中的第一个博客,致力于基于多元时间序列数据创建强大的预测引擎。 下一个博客将重点介绍功能设计和选择。 敬请关注!
翻译自: https://medium.com/@indraneeldb1993ds/cleaning-and-understanding-multivariate-time-series-data-6554eefbda9c
时间序列数据的多元回归
http://www.taodudu.cc/news/show-2257945.html
相关文章:
- 时间序列预测 | Python实现GAN时间序列数据生成建模
- 时序数据获取 | Python实现时间序列数据集获取
- 超全必看!开源时间序列数据集整理
- 一招搞定时间序列数据,手把手教你绘制时间序列图
- TODS:从时间序列数据中检测不同类型的异常值
- 时间序列数据的处理
- 时间序列数据如何插补缺失值?
- Python 时间序列数据平滑去噪 Savitzky-Golay滤波器
- 推荐 五个单变量时间序列数据集
- Python中的时间序列数据可视化的完整指南
- 【时间序列】时间序列数据的缺失填补方法总结
- 时间序列数据处理2——时间序列聚类算法
- 使用动态时间规整来同步时间序列数据
- R语言处理时间序列数据
- 什么是时间序列数据
- C语言什么是时间序列,什么是横截面数据、时间序列数据和面板数据
- 超长时间序列数据可视化的6个技巧
- 时间序列数据挖掘
- 开源时间序列数据集
- 时间序列数据分析
- 使用 TimeGAN 建模和生成时间序列数据
- 如何将数据转换为时间序列数据
- 时间序列的数据分析(三):经典时间序列分解
- 时间序列数据简介
- 时间序列(数据分析)
- 时间序列数据的存储和计算 - 概述
- 用python获取实时地球图像作为壁纸(windows)
- 计算机远程用户关机指令,有哪些远程关机命令?如何用向日葵进行远程关机电脑?...
- “向日葵”远程控制软件,方舟Q2硬件付费/免费功能全面评测,拔草向
- N33-Week 1-向日葵
时间序列数据的多元回归_清理和理解多元时间序列数据相关推荐
- 大数据相关从业_如何在组织中以数据从业者的身份闪耀
大数据相关从业 Build bridges, keep the maths under your hat and focus on serving. 架起桥梁,将数学放在脑海中,并专注于服务. 通过协 ...
- 大数据平台构建_如何像产品一样构建数据平台
大数据平台构建 重点 (Top highlight) Over the past few years, many companies have embraced data platforms as a ...
- python 3d大数据可视化软件_最受欢迎的大数据可视化软件
最受欢迎的大数据可视化软件 发布时间:2020-05-26 想像阅读书本一样阅读数据流?这只有在电影中才有可能发生. 在现实世界中,企业必须使用数据可视化工具来读取原始数据的趋势和模式. 大数据可视化 ...
- 数据数据泄露泄露_通过超参数调整进行数据泄漏
数据数据泄露泄露 介绍 (Introduction) Data Leakage is when the model somehow knows the patterns in the test dat ...
- 软件开发向大数据开发过渡_如果您是过渡到数据科学的开发人员,那么这里是您的最佳资源...
软件开发向大数据开发过渡 by Cecelia Shao 邵Ce It seems like everyone wants to be a data scientist these days - fr ...
- 数据科学与大数据排名思考题_排名前5位的数据科学课程
数据科学与大数据排名思考题 目录 (Table of Contents) Introduction介绍 Udemy乌迪米 Machine Learning A-Z™: Hands-On Python ...
- 本月与上月对比数据叫什么_财务人事应会Excel数据对比Vlookup函数快速核定变动...
如何对多列数据进行对比!说到多列数据的对比,其实说难也不难,说简单也不简单,在学习之前需要带大家认识一位新朋友VLOOKUP,赶紧一起来看看吧! 在上次的学习中,我们了解到可以使用合并计算功能,实现单 ...
- 数据存储方式_详解西门子S7-200PLC的数据区
(一)数字量输入和输出映象区 1.输入映象寄存器(数字量输入映象区)(I) 数字量输入映象区是S7-200CPU为输入端信号状态开辟的一个存储区.输入映像寄存器的标识符为I,在每个扫描周期的开始,CP ...
- 导入数据中文乱码_基于Navicat和Kettle的数据迁移完全解读(多图)
需求描述 对于数据分析人员来说,工作的基础是数据,没有数据分析就无从谈起,即巧妇难为无米之炊. #数据库# #数据迁移# #Oracle# 然而,数据分析往往在实验环境或者准生产环境中开展,而数据分布 ...
- 图表嵌入到数据表格下方_在excel图表下方添加数据表 excel图表添加数据表
在excel图表下方添加数据表 excel图表添加数据表,前天刚学习了一个excel的新技术,叫"excel图表添加数据表"授课老师对我们说,这一技术的专业全称为"在ex ...
最新文章
- 计算机二级7月考试,2020年计算机二级MS Office考试每日一练(7月27日)
- [eclipse]Myeclipse console 中乱码问题
- mysql 导出用户权限_MySQL中导出用户权限设置的脚本分享
- 3年营收翻8倍,网易智慧企业业务多品牌战略升级
- 一次性解决Java程序中的乱码问题
- BeanUtils.copyProperties(对象A,对象B)
- java 双向链表_Day26:二叉搜索树与双向链表
- 你自认为了解微信小程序?醒醒吧!
- Ubuntu下编译SHTOOLS
- Advanced IP Scanner - 网络扫描器
- [PHPCMS]精美大气自适应资源模板下载网站源码
- php零售,ThinkPHP开源新零售小程序_萤火商城系统
- PowerManagerService 电源管理架构初识
- 与iPhone5国行A1429的故事:越狱、降级刷机、完美电信3G、不完美电信4G、撸油管
- 金蝶K3修改核算项目锁定字段的默认长度(以物料主数据的助记码为例)
- zutuanxue.com-Linux终端的使用
- 华为云在Linux ECS上使用obsutil通过内网访问OBS
- Java两个网页之间的文件互传_如何让两台 PC 进行文件传输?
- 高德地图搜索附近地址所遇到的问题
- php nslookup,nslookup - 运维猫的个人空间 - OSCHINA - 中文开源技术交流社区