性能调优之综合篇 - Linux系统性能监控和故障排查利器Sysdig
Sysdig绝对是可以跟SystemTap相媲美的工具,都是系统故障排查的利器,不论是开发人员还是运维人员都必须要掌握的一个工具。今天先介绍一下Sysdig的一些特性。官网上说Sysdig是Strace, Tcpdump, Lsof, Htop, Iftop等工具的合体,至于你信不信只有使用之后才能来惊叹我说的到底对不对。这里官网总结了sysdig命令对于strace, tcpdump, lsof, iftop的对比:https://sysdig.com/blog/linux-troubleshooting-cheatsheet/。所以Sysdig主要功能就是系统级别的探测,捕捉服务器上的应用程序对CPU, Memory, I/O, Network的状况。
Sysdig最新版提供了Docker容器镜像,可以很方便的直接拉取Docker镜像,另一方它提供容器级别的信息采集指令(sysdig -pc container.name=your_container_name),支持查询指定容器之间的网络流量、指定容器的CPU使用率等。
公司旗下的商用软件Sysdig Cloud则是容器级别的系统信息和网络流量监控、调试软件,这个在CoreOS Fest 大会上有介绍,它支持Real-Time Dashboard, Historical Replay, Dynamic Topology and Intelligent Alert, 可以想象成Nagios对系统的监控。
软件安装请参考官方文档:http://www.sysdig.org/install/ 相对于SystemTap的安装Sysdig更容易些,本篇文章有点长就不浪费在安装上了,熟悉Ansible的可以去直接用sysdig的Galaxy:https://galaxy.ansible.com/detail#/role/692
Sysdig的语法在record 和replay系统跟踪方面跟Tcpdump和perf很像;在系统性能分析方面的语法chisels又跟SystemTap和dstat的--top*很像,只不过SystemTap需要自己写tap(代码写好了,比Sysdig强大), Sysdig是已经帮你写好了;在交互式使用方面又跟htop很像。
不废话了,下面介绍一下基本的使用方法。
一,基础功能介绍:
最简单的使用方法是直接输入sysdig, 他会捕获系统的每一个事件并且直接输出到屏幕。
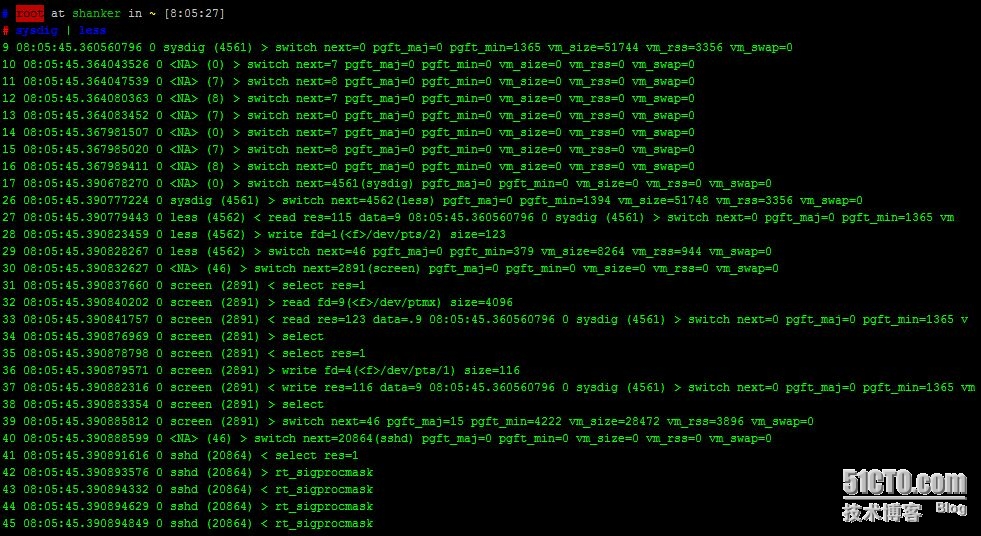
每一个event都是一行信息,输出的格式如下:
*%evt.num %evt.time %evt.cpu %proc.name (%thread.tid) %evt.dir %evt.type %evt.args
evt.num 是一个自动增长的event number
evt.time 是时间戳
evt.cpu 是捕获到的在用的哪颗CPU
proc.name 是process name
thread.tid 是thread id,如果不是多线程,就是pid
evt.dir 是event方向,>代表进入events,<代表退出events
evt.type 是event的操作名称,e.g. open or read
evt.args 是event 调用命令参数的列表
如果要保存信息的话,可以加上-w选项,限制捕捉行数用-n:
sysdig -n 100 -w firstcapture.scap
如果是按大小区分捕获文件的话,可以用-C 1 默认捕获1M文件就分割到下一个文件,-W 5 参数只捕获5个文件
sysdig -C 1 -W 5 -w secondcapture.scap
生成的文件名是secondcapture.scap.{1..5}。
要阅读刚才捕获的文件,用-r参数:
sysdig -r firstcapture.scap
如果要对捕获的内容做具体的事件查询呢?请看下面
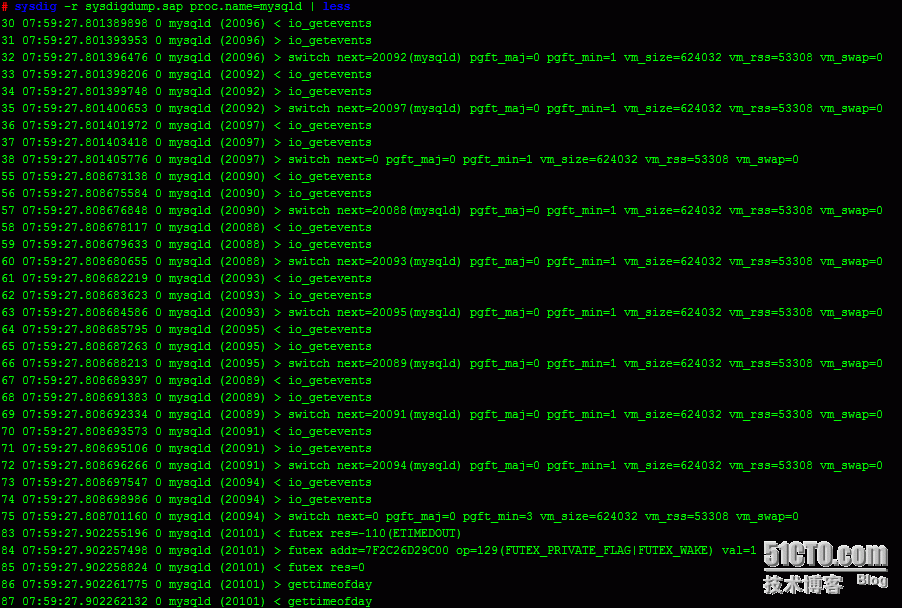
查询进程是mysqld的event:
sysdig -r firstcapture.scap proc.name=mysqld
看proc.name 是mysql 或者nginx的,并且event是read的event
sysdig -r firstcapture.scap proc.name=mysqld or proc.name=nginx and env.type=read
筛选的关键字可以用sysdig -l 来获得,他支持以下12中Field Class:
fd
process
evt
user
group
syslog
container
fdlist
k8s
mesos
span
evtin
# sysdig -l
----------------------
Field Class: fd
fd.num          the unique number identifying the file descriptor.
fd.type         type of FD. Can be 'file', 'directory', 'ipv4', 'ipv6', 'unix','pipe', 'event', 'signalfd', 'eventpoll', 'inotify' or 'signalfd'.
fd.typechar     type of FD as a single character. Can be 'f' for file, 4 for IPv4 socket, 6 for IPv6 socket, 'u' for unix socket, p for pipe, 'e' for eventfd, 's' for signalfd, 'l' for eventpoll, 'i' for inotify, 'o' for uknown.
fd.name         FD full name. If the fd is a file, this field contains the fullpath. If the FD is a socket, this field contain the connectiontuple.----------------------
Field Class: process
proc.pid        the id of the process generating the event.
proc.exe        the first command line argument (usually the executable name ora custom one).
proc.name       the name (excluding the path) of the executable generating the event.
proc.args       the arguments passed on the command line when starting the process generating the event.
proc.env        the environment variables of the process generating the event.
proc.cmdline    full process command line, i.e. proc.name + proc.args.
proc.exeline    full process command line, with exe as first argument, i.e. proc.exe + proc.args.
proc.cwd        the current working directory of the event.
proc.nthreads   the number of threads that the process generating the event currently has, including the main process thread.
proc.nchilds    the number of child threads that the process generating the event currently has. This excludes the main process thread.----------------------
Field Class: evt
evt.num         event number.
evt.time        event timestamp as a time string that includes the nanosecond part.
evt.time.s      event timestamp as a time string with no nanoseconds.
evt.datetime    event timestamp as a time string that includes the date.
evt.rawtime     absolute event timestamp, i.e. nanoseconds from epoch.
evt.rawtime.s   integer part of the event timestamp (e.g. seconds since epoch).
evt.rawtime.ns  fractional part of the absolute event timestamp.
evt.reltime     number of nanoseconds from the beginning of the capture.
evt.reltime.s   number of seconds from the beginning of the capture.
evt.reltime.ns  fractional part (in ns) of the time from the beginning of the capture.
evt.latency     delta between an exit event and the correspondent enter event, in nanoseconds.----------------------
Field Class: user
user.uid        user ID.
user.name       user name.
user.homedir    home directory of the user.
user.shell      user's shell.
----------------------
Field Class: group
group.gid       group ID.
group.name      group name.
----------------------
Field Class: syslog
syslog.facility.strfacility as a string.
syslog.facility facility as a number (0-23).
syslog.severity.strseverity as a string. Can have one of these values: emerg, alert, crit, err, warn, notice, info, debug
syslog.severity severity as a number (0-7).
syslog.message  message sent to syslog.
----------------------
Field Class: container
container.id    the container id.
container.name  the container name.
container.p_w_picpath the container p_w_picpath.
container.type  the container type, eg: docker or rkt
----------------------
Field Class: fdlist
fdlist.nums     for poll events, this is a comma-separated list of the FD numbers in the 'fds' argument, returned as a string.
fdlist.names    for poll events, this is a comma-separated list of the FD namesin the 'fds' argument, returned as a string.
fdlist.cips     for poll events, this is a comma-separated list of the client IP addresses in the 'fds' argument, returned as a string.
fdlist.sips     for poll events, this is a comma-separated list of the server IP addresses in the 'fds' argument, returned as a string.
fdlist.cports   for TCP/UDP FDs, for poll events, this is a comma-separated list of the client TCP/UDP ports in the 'fds' argument, returned as a string.
fdlist.sports   for poll events, this is a comma-separated list of the server TCP/UDP ports in the 'fds' argument, returned as a string.
----------------------
Field Class: k8s
k8s.pod.name    Kubernetes pod name.
k8s.pod.id      Kubernetes pod id.
k8s.pod.label   Kubernetes pod label. E.g. 'k8s.pod.label.foo'.
k8s.pod.labels  Kubernetes pod comma-separated key/value labels. E.g. 'foo1:bar1,foo2:bar2'.
k8s.rc.name     Kubernetes replication controller name.
k8s.rc.id       Kubernetes replication controller id.
k8s.rc.label    Kubernetes replication controller label. E.g. 'k8s.rc.label.foo'.
k8s.rc.labels   Kubernetes replication controller comma-separated key/value labels. E.g. 'foo1:bar1,foo2:bar2'.
k8s.svc.name    Kubernetes service name (can return more than one value, concatenated).
k8s.svc.id      Kubernetes service id (can return more than one value, concatenated).----------------------
Field Class: mesos
mesos.task.name Mesos task name.
mesos.task.id   Mesos task id.
mesos.task.labelMesos task label. E.g. 'mesos.task.label.foo'.
mesos.task.labelsMesos task comma-separated key/value labels. E.g. 'foo1:bar1,foo2:bar2'.
mesos.framework.nameMesos framework name.
mesos.framework.idMesos framework id.
marathon.app.nameMarathon app name.
marathon.app.id Marathon app id.
marathon.app.labelMarathon app label. E.g. 'marathon.app.label.foo'.----------------------
Field Class: span
span.id         tracer ID. This is a unique identifier that is used to match the enter and exit tracer events for this span. It can also be used to match different spans belonging to a trace.
span.time       time of the span enter tracer as a time string that includes the nanosecond part.
span.ntags      number of tags that this span has.
span.nargs      number of arguments that this span has.
span.tags       dot-separated list of the span's tags.
span.tag        one of the span's tags, specified by 0-based offset, e.g. 'span.tag[1]'. You can use a negative offset to pick elements from the end of the tag list. For example, 'span.tag[-1]' returns thelast tag.----------------------
Field Class: evt
evtin.span.id   (FILTER ONLY) the ID of the trace span containing the event.
evtin.span.ntags(FILTER ONLY) the number of tags of the trace span containing the event.
evtin.span.nargs(FILTER ONLY) the number of arguments of the trace span containing the event.
evtin.span.tags (FILTER ONLY) the comma-separated list of tags of the trace span containing the event.
evtin.span.tag  (FILTER ONLY) one of the tags of the trace span containing the event, specified by offset. E.g. 'evtin.span.tag[1]'. You can use a negative offset to pick elements from the end of the tag list. For example, 'evtin.span.tag[-1]' returns the last tag.
如果不想要sysdig默认的输出格式,也可以自己定制,类似于top的定制。变量名必须用%开头。
# sysdig -r sysdigdump.sap -p "user:%user.name dir:%evt.arg.path"  evt.type=chdir
user:root dir:/
user:root dir:/
输出一个程序正在被哪个用户使用,被调用的命令参数是怎样的:
# sysdig -p"%user.name) %proc.name %proc.args" evt.type=execve and evt.arg.ptid=zsh
root) git config --get oh-my-zsh.hide-status
root) git symbolic-ref HEAD
root) git rev-parse --short HEAD
root) ls --color=tty --color=auto -hltr
root) git config --get oh-my-zsh.hide-status
root) git symbolic-ref HEAD
root) git rev-parse --short HEAD
可以我在zsh的命令行上执行了ls 命令, 并且oh-my-zsh在后台悄悄地执行git config 命令,没有sysdig工具你是没法知道oh-my-zsh在没执行一次命令都在后台执行git config的,果断把oh-my-zsh自动更新给禁掉,以后可以每隔一段时间手动去更新oh-my-zsh。
查看哪个进程在/etc下写文件,同样效果lsof也可以实现,只是显示不如sysdig,而且sysdig还可以定制显示内容。
# root at shanker in ~/.oh-my-zsh on git:master o [9:22:59]
# sysdig -p "user:%user.name process:%proc.name file:%fd.name" "evt.type=write and fd.name contains /etc"
user:root process:vim file:/etc/ansible/.hosts.swp
user:root process:vim file:/etc/ansible/.hosts.swp
user:root process:vim file:/etc/ansible/.hosts.swp^C#
# root at shanker in ~/.oh-my-zsh on git:master o [9:27:32]
# lsof -cv /etc
COMMAND   PID USER   FD      TYPE DEVICE SIZE/OFF   NODE NAME
vmstat     59 root  cwd       DIR  202,1     4096      2 /
vmstat     59 root  rtd       DIR  202,1     4096      2 /
vmstat     59 root  txt   unknown                        /proc/59/exe
vim     11547 root  cwd       DIR  202,1     4096  16386 /root
vim     11547 root  rtd       DIR  202,1     4096      2 /
vim     11547 root  txt       REG  202,1  2191736   1026 /usr/bin/vim.basic
vim     11547 root  mem       REG  202,1    47712 418583 /lib/x86_64-linux-gnu/libnss_files-2.19.so
vim     11547 root  mem       REG  202,1    47760 418575 /lib/x86_64-linux-gnu/libnss_nis-2.19.so
vim     11547 root  mem       REG  202,1    97296 418568 /lib/x86_64-linux-gnu/libnsl-2.19.so
vim     11547 root  mem       REG  202,1    39824 418566 /lib/x86_64-linux-gnu/libnss_compat-2.19.so
vim     11547 root  mem       REG  202,1    10680 418582 /lib/x86_64-linux-gnu/libutil-2.19.so
vim     11547 root  mem       REG  202,1   100728 396113 /lib/x86_64-linux-gnu/libz.so.1.2.8
vim     11547 root  mem       REG  202,1    18624 396035 /lib/x86_64-linux-gnu/libattr.so.1.1.0
vim     11547 root  mem       REG  202,1   252032 397658 /lib/x86_64-linux-gnu/libpcre.so.3.13.1
vim     11547 root  mem       REG  202,1  1840928 418580 /lib/x86_64-linux-gnu/libc-2.19.so
vim     11547 root  mem       REG  202,1   141574 418570 /lib/x86_64-linux-gnu/libpthread-2.19.so
vim     11547 root  mem       REG  202,1  3480880    895 /usr/lib/x86_64-linux-gnu/libpython2.7.so.1.0
vim     11547 root  mem       REG  202,1    14664 418562 /lib/x86_64-linux-gnu/libdl-2.19.so
vim     11547 root  mem       REG  202,1    27080   8084 /usr/lib/x86_64-linux-gnu/libgpm.so.2
vim     11547 root  mem       REG  202,1    31168 396033 /lib/x86_64-linux-gnu/libacl.so.1.1.0
vim     11547 root  mem       REG  202,1   134296 396097 /lib/x86_64-linux-gnu/libselinux.so.1
vim     11547 root  mem       REG  202,1   167096 396105 /lib/x86_64-linux-gnu/libtinfo.so.5.9
vim     11547 root  mem       REG  202,1  1071552 418560 /lib/x86_64-linux-gnu/libm-2.19.so
vim     11547 root  mem       REG  202,1   149120 418572 /lib/x86_64-linux-gnu/ld-2.19.so
vim     11547 root  mem       REG  202,1  1607664   1578 /usr/lib/locale/locale-archive
vim     11547 root    0u      CHR  136,7      0t0     10 /dev/pts/7
vim     11547 root    1u      CHR  136,7      0t0     10 /dev/pts/7
vim     11547 root    2u      CHR  136,7      0t0     10 /dev/pts/7
vim     11547 root    4u      REG  202,1    12288 131619 /etc/ansible/.hosts.swp
想要看网络连接,使用文件描述法是ipv4即可:
sysdig fd.type=ipv4 and evt.type=write
如果使用container的情况下,输出格式需要重新格式化才能友好阅读,根据自己container的类型选择命令参数:
Using -pc or -pcontainer, the default format will be changed to a container-friendly one:
%evt.num %evt.outputtime %evt.cpu %container.name (%container.id) %proc.name (%thread.tid:%thread.vtid) %evt.dir %evt.type %evt.info
Using -pk or -pkubernetes, the default format will be changed to a kubernetes-friendly one:
%evt.num %evt.outputtime %evt.cpu %k8s.pod.name (%container.id) %proc.name (%thread.tid:%thread.vtid) %evt.dir %evt.type %evt.info
Using -pm or -pmesos, the default format will be changed to a mesos-friendly one:
%evt.num %evt.outputtime %evt.cpu %mesos.task.name (%container.id) %proc.name (%thread.tid:%thread.vtid) %evt.dir %evt.type %evt.info
二,Chisels用法简介:
因为sysdig的图标是铲子,这个Chisel字面翻译是凿子,铲子加上凿子可以帮你挖的更深。
用过SystemTap(Dtrace Solaris的叫法)工具的朋友一定熟悉他的stap脚本,这个脚本语言需要单独去学习,使用成本比较高,sysdig呢直接提供了很多chisels共大家使用,免去了自己开发脚本的时间,它是用Lua脚本语言开发的。他俩的功能都是挖掘系统层的调用事件,挖的很深很深......
引用一下官网的“自吹”:
Sysdig’s chisels are little scripts that analyze the sysdig event stream to perform useful actions. If you’ve used system tracing tools like dtrace, you’re probably familiar with running scripts that trace OS events. Usually, with dtrace-like tools you write your scripts using a domain-specific language that gets compiled into bytecode and injected in the kernel. Sysdig uses a different approach: events are efficiently brought to user-level, enriched with context, and then scripts can be applied to them. This brings several benefits:
A well known scripting language can be used instead of a custom one. In fact, sysdig’s chisels are Lua scripts. Lua is well known, powerful, stable and extremely efficient.
Chisels can leverage the broad collection of Lua libraries.
Chisels work well on live systems, but can also be used with capture files for offline analysis.
下面是一个SystemTap的stap脚本,这个工具会单独开一篇文章来介绍,也是史诗级的。
# cat nginx.stap
global s;
global quit = 0;
probe timer.profile { if (pid() == target()) { if (quit) { foreach (i in s-) { print_ustack(i); printf("\t%d\n", @count(s[i])); } exit() } else { s[ubacktrace()] <<< 1; } }
}
probe timer.s(20) { quit = 1
}
要使用sysdig的chisels, 用-cl参数来查看,如果想对其中的某一个感兴趣,使用-i来详细查看,sysdig源码在github上,您也可以自己去创造自己的chisel。
# sysdig -cl
Category: Application
---------------------
httplog         HTTP requests log
httptop         Top HTTP requests
memcachelog     memcached requests log
Category: CPU Usage
-------------------
spectrogram     Visualize OS latency in real time.
subsecoffset    Visualize subsecond offset execution time.
topcontainers_cpuTop containers by CPU usage
topprocs_cpu    Top processes by CPU usage
Category: Errors
----------------
topcontainers_errorTop containers by number of errors
topfiles_errors Top files by number of errors
topprocs_errors top processes by number of errors
Category: I/O
-------------
echo_fds        Print the data read and written by processes.
.....
# root at shanker in ~ [1:52:57]
# sysdig -i echo_fds
Category: I/O
-------------
echo_fds        Print the data read and written by processes.
Print the data read and written for any FD. Combine this script with a filter t
o restrict what it shows. This chisel is compatible with containers using the s
ysdig -pc or -pcontainer argument, otherwise no container information will be s
hown. (Blue represents  [Write], and Red represents [Read] for all data except
when the -pc or -pcontainer argument is used. If used the container.name and co
ntainer.id will be represented as: Green [host], and Cyan [container]) Containe
r information will contain '[]' around container.name and container.id.
Args:
[string] disable_color - Set to 'disable_colors' if you want todisable color output
如果要运行某一个chisel,直接跟-c即可,比如查看top process by CPU, Network I/O, File I/O:
sysdig -c topprocs_cpu{topprocs_file,topprocs_net}
Bytes               Process             PID
--------------------------------------------------------------------------------
488B                sshd                18115
如何查询一个特定进程的所有网络流量呢?拿nginx为例,以ASCII字符显示nginx进程的所有网络流量,回显蓝色字体是写,红色字体是read:
# root at shanker in ~ [2:00:35]
# sysdig -A -c echo_fds proc.name=nginx
------ Read 73B from   127.0.0.1:54811->127.0.0.1:http (nginx)
GET / HTTP/1.1
User-Agent: curl/7.35.0
Host: localhost
Accept: */*
------ Write 504B to   ffff880007b07080->ffff880007b05640 /var/run/php5-fpm.sock (nginx)
QUERY_STRINGREQUEST_METHODGETCONTENT_TYPECONTENT_LENGTHSCRIPT_FILENAME/var/www/html/index.php
SCRIPT_NAME/index.phpREQUEST_URI/
DOCUMENT_URI/index.php
DOCUMENT_ROOT/var/www/htmlSERVER_PROTOCOLHTTP/1.1GATEWAY_INTERFACECGI/1.1SERVER_SOFTWAREnginx/1.4.6REMOTE_ADDR127.0.0.1REMOTE_PORT54811SERVER_ADDR127.0.0.1SERVER_PORT80SERVER_NAMEshanker.heyoa.comREDIRECT_STATUS200HTTP_USER_AGENTcurl/7.35.0HTTP_HOSTlocalhostHTTP_ACCEPT*/*
------ Read 4.00KB from   ffff880007b07080->ffff880007b05640 /var/run/php5-fpm.sock (nginx)
X-Powered-By: PHP/5.5.9-1ubuntu4.16
Content-Type: text/html; charset=UTF-8
如果把proc.name=nginx换成fd.sport=80是一样的效果。
如果想查看sshd进程交互的,server ip 是172.31.23.95的流量:
sysdig -A -s 65000 -n 1000 -c echo_fds fd.sip=172.31.23.95 and proc.name=sshd
我们在拿官网的topfiles_bytes chisel来学习一下。如果不接任何参数就显示的就是读写磁盘字节数最高的那些进程:

$ sysdig -c topfiles_bytes
Bytes     Filename
------------------------------
23.32KB   /proc/net/unix
9.11KB    /usr/share/icons/hicolor/16x16/actions/terminator_receive_off.png
5.64KB    /etc/localtime
4.92KB    /proc/interrupts
4.38KB    /dev/input/event2
4.37KB    /etc/wgetrc
2.88KB    /proc/stat
2.39KB    /usr/share/locale/locale.alias
1.85KB    /proc/18263/status
如果不想看访问/dev的进程,可以这样:
sysdig -c topfiles_bytes "not fd.name contains /dev"
如果只想看/root目录下读写比较高的进程,可以这样:
$ sysdig -c topfiles_bytes "fd.name contains /root"
Bytes     Filename
------------------------------
1.29KB    /root/agent/build/debug/test/index.html.93
1.10KB    /root/.dropbox/PENDING_aWX7WU
1.10KB    /root/.dropbox/UPDATED_UsxrsX
16B       /root/.dropbox/filecache.dbx```
如果想看某个进程对文件的读写,还可以这样:
$ sysdig -c topfiles_bytes "proc.name=vi"
Bytes     Filename
------------------------------
4.00KB    /root/agent/build/debug/test/.lo.txt.swp
3.36KB    /usr/share/terminfo/x/xterm-256color
2.18KB    /etc/passwd
1.98KB    /root/agent/build/debug/test/lo.txt
1.92KB    /etc/virc
1.66KB    /etc/nsswitch.conf
832B      /lib64/libpcre.so.1
832B      /lib64/libc.so.6
832B      /lib64/libnss_files.so.2
或者针对某个用户的:
$ sysdig -c topfiles_bytes "user.name=loris"
Bytes     Filename
------------------------------
3.31KB    /etc/nsswitch.conf
2.18KB    /etc/passwd
1.62KB    /lib64/libselinux.so.1
1.62KB    /lib64/libc.so.6
1.62KB    /lib64/libpcre.so.1
1.62KB    /lib64/libdl.so.2
1.62KB    /lib64/libnss_files.so.2
898B      /etc/group
54B       /proc/self/task/30414/attr/current
三,csysdig简介
csysdig的用法就有点类似htop了,是sysdig交互式的用户界面,在熟悉了sysdig的用法的基础上,用csysdig就轻车熟路了,在这里就不详细介绍了,大家可以参考官方文档http://www.sysdig.org/wiki/csysdig-overview/
https://github.com/draios/sysdig/blob/dev/userspace/sysdig/man/csysdig.md
和youtube上的视频介绍:
https://www.youtube.com/watch?v=UJ4wVrbP-Q8
最后总结一下,sysdig真的是一款非常强大的系统分析工具,本文只是抛砖引玉,希望大家多多挖掘,分享更深层的东西来分析服务器的瓶颈和故障。
参考连接:
http://www.sysdig.org/wiki/sysdig-user-guide/
http://www.sysdig.org/wiki/chisels-user-guide/
http://bencane.com/2014/04/18/using-sysdig-to-troubleshoot-like-a-boss/
http://xmodulo.com/monitor-troubleshoot-linux-server-sysdig.html
转载于:https://blog.51cto.com/shanker/1768735
性能调优之综合篇 - Linux系统性能监控和故障排查利器Sysdig相关推荐
- mysql性能监控 调优_MySQL管理之道:性能调优、高可用与监控(第2版)
MySQL管理之道:性能调优.高可用与监控(第2版) 作者:贺春旸 著 出版日期:2016年08月 文件大小:71.36M 支持设备: ¥50.00在线试读 适用客户端: 言商书局 iPad/iPho ...
- mysql性能优化与高可用_MySQL管理之道:性能调优、高可用与监控》迷你书
MySQL管理之道:性能调优.高可用与监控>迷你书 MYSQL5.5.X主要改进 1.默认使用innodb存储引擎 2.充分利用CPU多核处理能力 3.提高刷写脏页数量和合并插入数量,改善I/O ...
- jvm性能调优实战 - 49OOM异常进行监控以及online处理
文章目录 Pre 最佳的解决方案 一个比较成熟的系统监控体系的建议 一种比较Low的JVM OOM问题的被动发现方法 系统发生OOM了,应该怎么来处理 初步思路 自动dump内存快照 迄今为止我们可以 ...
- 《MySQL管理之道:性能调优、高可用与监控》china-pub首发!
预售网址:http://product.china-pub.com/3769079 一年多的辛苦终于出版了,感谢为我写序的朋友们!希望各位读者多多支持,如有任何问题,请直接联系我. 本文转自hcymy ...
- jvm性能调优实战 -55RPC调用引发的OOM故障
文章目录 Pre 系统架构介绍 故障发生现场 初步查找内存溢出的故障发生点 分析内存快照找到占用内存最大的对象 通过分析源代码找出原因 铺垫一个关键知识点:RPC框架的类定义 RPC框架的一个bug: ...
- JVM性能调优(4)——性能调优工具
目录 一.JDK工具1.JDK工具2.利用 jps 找出进程3.利用 jstat 查看VM统计信息4.利用 jmap 查看对象分布情况5.利用 jstack 分析线程栈 二.Linux 命令行工具1. ...
- eBay的Elasticsearch性能调优实践
https://www.sohu.com/a/220443841_467759 Elasticsearch 是一个基于 Apache Lucene 的开源搜索和分析引擎,允许用户近实时地存储.搜索和分 ...
- 【Elasticsearch】eBay上的Elasticsearch性能调优实践
1.概述 翻译:eBay上的Elasticsearch性能调优实践 中文版:eBay上的Elasticsearch性能调优实践 Elasticsearch 是一个基于 Apache Lucene 的开 ...
- Linux系统性能监控与调优
基本概念 QPS:query per second, 1秒内完成的请求数 RT:response time, 1个请求完成的时间 Throughput越大,Latency会越差.因为请求量过大,系统太 ...
最新文章
- fedora mysql 客户端_fedora mysql 安装
- Android studio 使用心得(三)—从Eclipse迁移到Android studio
- java bank项目答案_Java基础实战Bank项目01-04
- php要求输入是个数求平均值、_【227期】EXCEL求平均值的各种套路汇聚合,最后难倒70%的人...
- switch类型模式
- APL开发日志--2013-01-17
- MySQL数据库索引及失效场景
- 完美解决 IDEA plugins 插件搜索不出结果
- Cobbler安装指南
- it男java_java-学习8
- 微信红包后台系统设计
- 树莓派简单摄像头录像并保存视频文件
- Linux环境下YUM和DNF详细介绍
- 宿迁卫校计算机多少钱一年,江苏宿迁卫生中等专业学校2021年招生录取分数线...
- 特殊字符在英语中的读法
- 领存技术至强 E5-2648L 6U VPX 通用密集计算刀片
- css变形-扭曲(skew())
- http 307重定向
- 移轴镜头摄影计算机作业模板,移轴镜头拍摄技巧全攻略
- 西邮linux兴趣小组网络,西邮Linux兴趣小组
热门文章
- mysql数据设置浮动_浮动float
- android焦点优先级,Viewgroup焦点获取优先级android:descendantFocusability用法简析
- 前端如何提示自己的技术水平
- 深度剖析浏览器渲染性能原理,你到底知道多少?
- php运行时输出,在PHP中运行具有实时输出的过程
- mysql 删除数据 分页_PHP实现对mysql数据库内容分页显示
- 修改vscode 窗口字体大小和编辑窗口字体大小
- oracle 传递table,将对象类型表从java传递到oracle 8i(Pass table of object type from java to oracle 8i)...
- rpm deb命令集合
- 消耗性缺口_衰竭缺口分析