Spring Boot框架敏感信息泄露的完整介绍与SRC实战(附专属字典与PoC)
转载于:https://www.freebuf.com/vuls/289710.html
#前言
##Spring Boot框架介绍
Spring框架功能很强大,但是就算是一个很简单的项目,我们也要配置很多东西。因此就有了Spring Boot框架,它的作用很简单,就是帮我们自动配置,其设计目的是用来简化新Spring应用的初始搭建以及开发过程。Spring Boot框架的核心就是自动配置,只要存在相应的jar包,Spring就帮我们自动配置。该框架使用了特定的方式来进行配置,从而使开发人员不再需要定义样板化的配置。如果默认配置不能满足需求,我们还可以替换掉自动配置类,使用我们自己的配置。另外,Spring Boot还集成了嵌入式的Web服务器,系统监控等很多有用的功能,让我们快速构建企业及应用程序。
##Actuator中间件工具介绍
Actuator是Spring Boot提供的服务监控和管理工具。当Spring Boot应用程序运行时,它会自动将多个端点注册到路由进程中。而由于对这些端点的错误配置,就有可能导致一些敏感信息泄露。
#如何发现Spring Boot框架
通常有两种方法:
1.网站的icon文件是一个绿色的树叶:

2.页面存在特有的报错信息: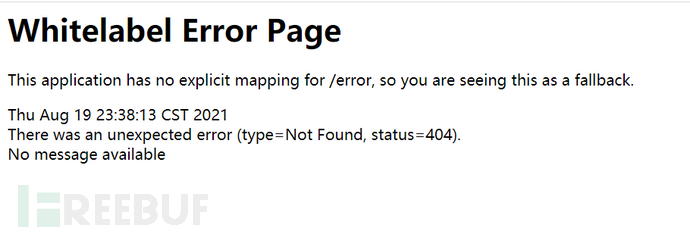
#敏感信息泄露所影响的版本
Spring Boot < 1.5: 默认未授权访问所有端点。
Spring Boot >= 1.5: 默认只允许访问/health和/info端点,但是此安全性通常被应用程序开发人员禁用。
#每个端点的作用
官方文档有对它们展开详细的描述:
路径                  描述                  默认启用
auditevents 显示当前应用程序的审计事件信息 Yes
beans   显示一个应用中所有Spring Beans的完整列表  Yes
conditions  显示配置类和自动配置类(configuration and auto-configuration    classes)的状态及它们被应用或未被应用的原因
configprops 显示一个所有@ConfigurationProperties的集合列表    Yes
env 显示来自Spring的 ConfigurableEnvironment的属性  Yes
flyway  显示数据库迁移路径,如果有的话  Yes
health  显示应用的健康信息(当使用一个未认证连接访问时显示一个简单    的’status’,使用认证连接访问则显示全部信息详情)
info    显示任意的应用信息   Yes
liquibase   展示任何Liquibase数据库迁移路径,如果有的话   Yes
metrics 展示当前应用的metrics信息    Yes
mappings    显示一个所有@RequestMapping路径的集合列表   Yes
scheduledtasks  显示应用程序中的计划任务    Yes
sessions    允许从Spring会话支持的会话存储中检索和删除(retrieval and deletion)    用户会话。使用Spring Session对反应性Web应用程序的支持时不可用。
shutdown    允许应用以优雅的方式关闭(默认情况下不启用)    No
threaddump  执行一个线程dump  Yes
heapdump    返回一个GZip压缩的hprof堆dump文件 Yes
jolokia 通过HTTP暴露JMX beans(当Jolokia在类路径上时,WebFlux不可用)   Yes
logfile 返回日志文件内容(如果设置了logging.file或logging.path属性的话),支持使用HTTP Range头接收日志文件内容的部分信息  Yes
prometheus  以可以被Prometheus服务器抓取的格式显示metrics信息   Yes
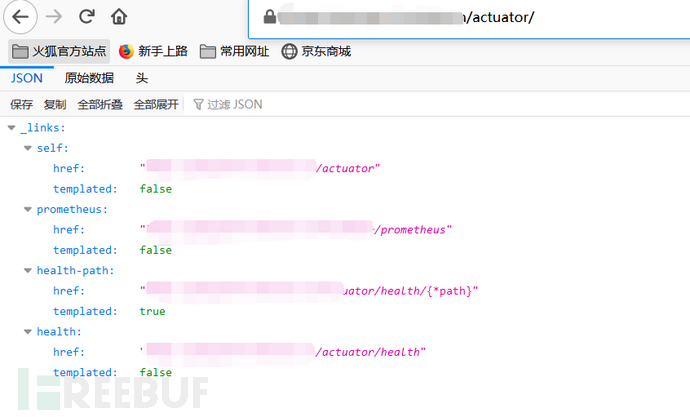
##访问/actuator
如果网站设置了management.endpoints.web.exposure.include为*,那么我们可以在/actuator看到所有存在的断点:
##访问/actuator/version
泄露版本信息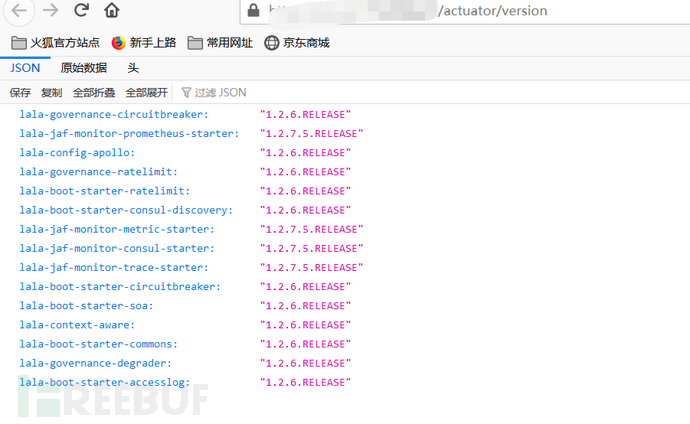
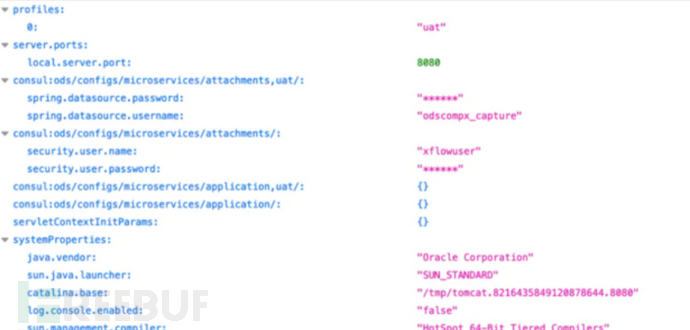
##访问/env或者/actuator/env
获取环境属性
其中redis账户和信息泄露:

其中数据库账户和信息泄露:
##访问/actuator/metrics
获得每个度量的名称,其中主要监控了JVM内容使用、GC情况、类加载信息等:
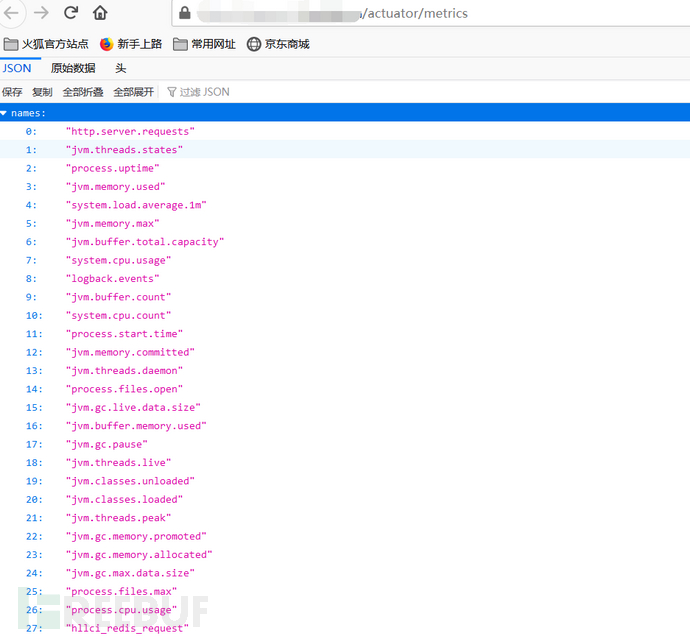
如果想要得到每个度量的详细信息,你需要传递度量的名称到URL中,比如这样:
http://x.x.x.x/actuator/metrics/http.server.requests
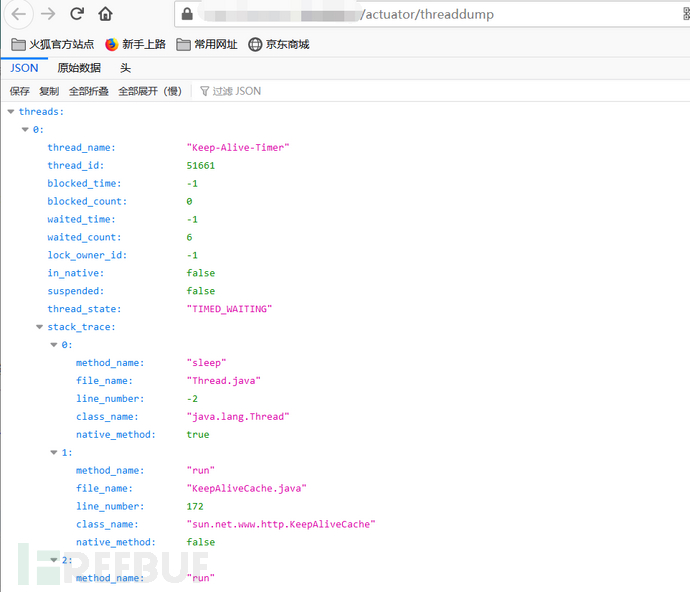
##访问/actuator/threaddump
获取服务器的线程堆栈:
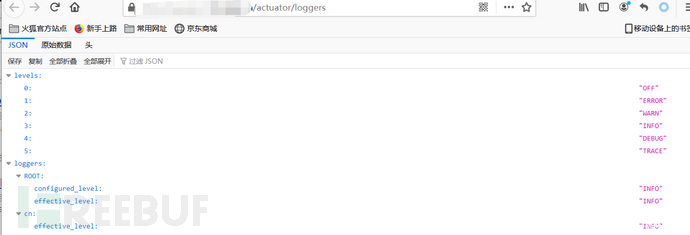
##访问/actuator/loggers
获取服务器的日志级别:
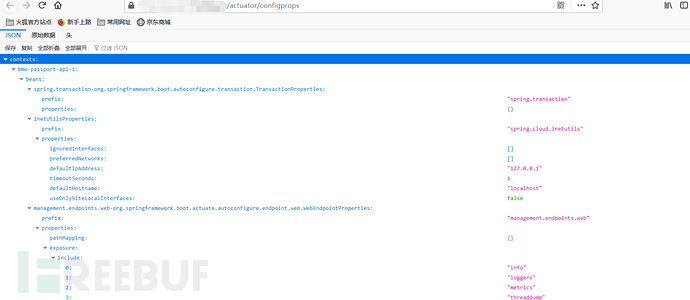
##访问/actuator/configprops
查看配置文件中设置的属性内容,以及一些配置属性的默认值:
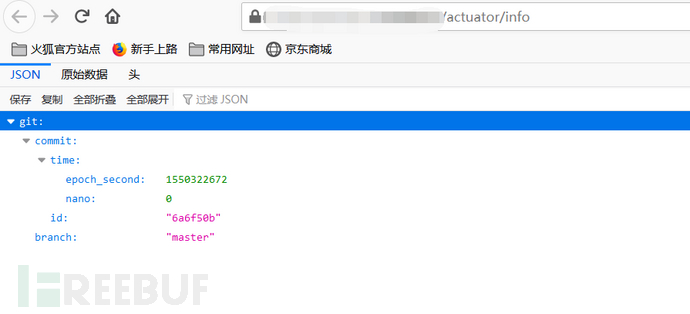
##访问/actuator/info
展示了关于应用的一般信息,这些信息从编译文件比如META-INF/build-info.properties或者git文件比如git.properties或者任何环境的property中获取:
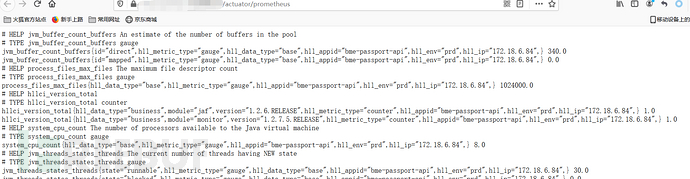
##访问/actuator/prometheus
获取一些监控指标:
##访问/actuator/mappings
其中描述全部的URI路径,以及它们和控制器的映射关系:
访问:http://x.x.x.x/actuator/mappings
{"/**/favicon.ico": {"bean": "faviconHandlerMapping"},"{[/hello]}": {"bean": "requestMappingHandlerMapping","method": "public java.lang.String com.neo.controller.HelloController.index()"},"{[/error]}": {"bean": "requestMappingHandlerMapping","method": "public org.springframework.http.ResponseEntity<java.util.Map<java.lang.String, java.lang.Object>> org.springframework.boot.autoconfigure.web.BasicErrorController.error(javax.servlet.http.HttpServletRequest)"}
}
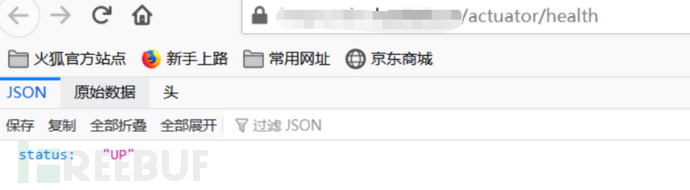
##访问/actuator/health
healthendpoint只展示了简单的UP和DOWN状态,比如这样:
为了获得健康检查中所有指标的详细信息,就需要通过在application.yaml中增加如下内容:
management:endpoint:health:show-details: always
一旦你打开上述开关,那么在/health中可以看到详细内容,比如下面这样:
{"status": "UP","diskSpace": {"status": "UP","total": 209715195904,"free": 183253909504,"threshold": 10485760}"db": {"status": "UP","database": "MySQL","hello": 1}
}
##访问/heapdump或者/actuator/heapdump
会返回一个GZip压缩的JVM堆dump,其中是jvm heap信息。下载的heapdump文件大小通常在 50M—500M 之间,有时候也可能会大于 2G。然后使用 MAT 可以获得jvm heap中的密码明文。
其中还有部分端点,这里就不一一展示了。
#Spring Boot敏感端点路径专属字典
这里送波福利吧:
%20/swagger-ui.html
actuator
actuator/auditevents
actuator/beans
actuator/conditions
actuator/configprops
actuator/env
actuator/health
actuator/heapdump
actuator/httptrace
actuator/hystrix.stream
actuator/info
actuator/jolokia
actuator/logfile
actuator/loggers
actuator/mappings
actuator/metrics
actuator/scheduledtasks
actuator/swagger-ui.html
actuator/threaddump
actuator/trace
api.html
api/index.html
api/swagger-ui.html
api/v2/api-docs
api-docs
auditevents
autoconfig
beans
caches
cloudfoundryapplication
conditions
configprops
distv2/index.html
docs
druid/index.html
druid/login.html
druid/websession.html
dubbo-provider/distv2/index.html
dump
entity/all
env
env/(name)
eureka
flyway
gateway/actuator
gateway/actuator/auditevents
gateway/actuator/beans
gateway/actuator/conditions
gateway/actuator/configprops
gateway/actuator/env
gateway/actuator/health
gateway/actuator/heapdump
gateway/actuator/httptrace
gateway/actuator/hystrix.stream
gateway/actuator/info
gateway/actuator/jolokia
gateway/actuator/logfile
gateway/actuator/loggers
gateway/actuator/mappings
gateway/actuator/metrics
gateway/actuator/scheduledtasks
gateway/actuator/swagger-ui.html
gateway/actuator/threaddump
gateway/actuator/trace
health
heapdump
heapdump.json
httptrace
hystrix
hystrix.stream
info
intergrationgraph
jolokia
jolokia/list
liquibase
logfile
loggers
mappings
metrics
monitor
prometheus
refresh
scheduledtasks
sessions
shutdown
spring-security-oauth-resource/swagger-ui.html
spring-security-rest/api/swagger-ui.html
static/swagger.json
sw/swagger-ui.html
swagger
swagger/codes
swagger/index.html
swagger/static/index.html
swagger/swagger-ui.html
swagger-dubbo/api-docs
swagger-ui
swagger-ui.html
swagger-ui/html
swagger-ui/index.html
system/druid/index.html
template/swagger-ui.html
threaddump
trace
user/swagger-ui.html
v1.1/swagger-ui.html
v1.2/swagger-ui.html
v1.3/swagger-ui.html
v1.4/swagger-ui.html
v1.5/swagger-ui.html
v1.6/swagger-ui.html
v1.7/swagger-ui.html
/v1.8/swagger-ui.html
/v1.9/swagger-ui.html
/v2.0/swagger-ui.html
v2.1/swagger-ui.html
v2.2/swagger-ui.html
v2.3/swagger-ui.html
v2/swagger.json
webpage/system/druid/index.html
#用工具跑字典
##Burp Suite
用Burp Suite跑似乎有点问题:
在Intruder爆破模块中,将payload设置成如此形式,跑不出来:

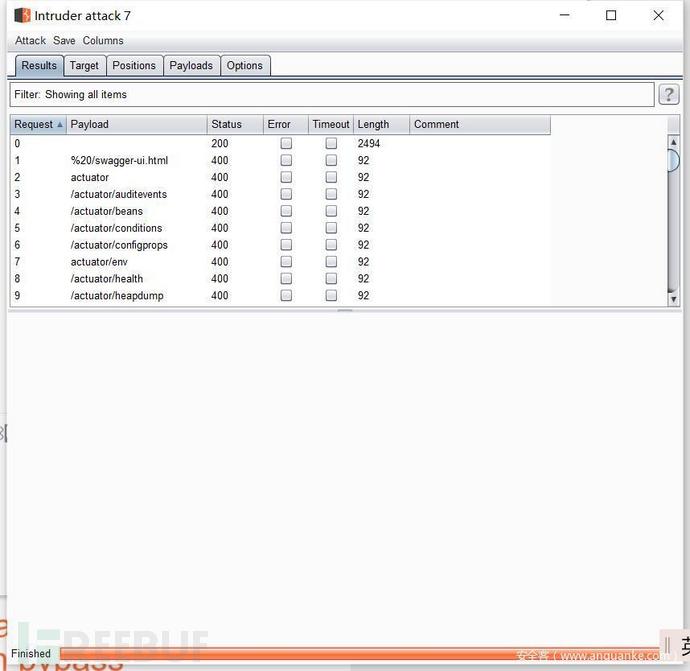
然而手测完页面却能访问,而且是有敏感信息的,所以这里有点问题。然后上网搜完,说是payload要设置成如下形式:
其中有部分状态码返回200了,还有Content-length也返回的是正确的,可是还是大部分是错误的,和我手测不相符:
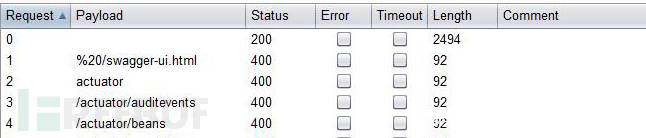
这里如果有师傅知道原因请告诉我。
##自己写python脚本
既然上面出现了问题,那么我只能自己写一个来跑了:
import requests
import time
url = ‘http://x.x.x.x/’ #这里url末尾要有’/’
with open(“SpringBoot信息泄露目录字典.txt”, ‘r’) as web:
webs = web.readlines()
for web in webs:
web = web.strip()
u = url + web
response = requests.get(u)
#print(“url为:”+u)
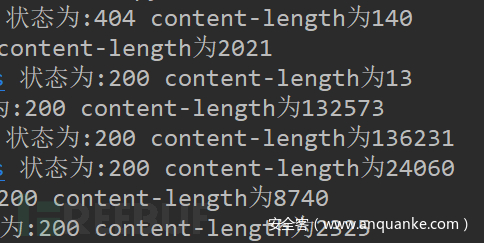
print(“url为:” + u + ’ ’ + “状态为:%d”%response.status_code + ’ ’ + “content-length为:” + str(len(response.content)))
time.sleep(5) #想sleep多久看自己~
w = open(‘easyresult.txt’, ‘w+’)
for web in webs:
web = web.strip()
u = url + web
response = requests.get(u)
w.write(“url为:” + u + ’ ’ + “状态为:%d”%response.status_code + ’ ’ + “content-length为:” + str(len(response.content)) + ‘\n’)
结果也是全部正确:
 进阶脚本,可以跑多个URL:
import requests
import time
with open(“url.txt”, ‘r’) as temp:
for url in temp.readlines():
url = url.strip(’\n’)
with open(“SpringBoot信息泄露目录字典.txt”, ‘r’) as web:
webs = web.readlines()
for web in webs:
web = web.strip()
u = url + web
r = requests.get(u)
# print(“url为:”+u)
print(“url为:” + u + ’ ’ + “状态为:%d”%response.status_code + ’ ’ + “content-length为:” + str(len(response.content)))
time.sleep(5)       #想睡多久看自己~
w = open(‘result.txt’, ‘w+’)
for web in webs:
web = web.strip()
u = url + web
r = requests.get(u)
w.write(“url为:” + u + ’ ’ + “状态为:%d”%response.status_code + ’ ’ + “content-length为:” + str(len(response.content)) + ‘\n’)
测试出来的结果也是全部正确。
##SRC实战
我用这个漏洞实战了某些src,均挖掘出了敏感信息并提交至平台。上面的所有截图均为实战时候的截图,现已全部修复。
参考
https://blog.csdn.net/weixin_50464560/article/details/119778686?spm=1001.2014.3001.5501
https://blog.csdn.net/weixin_50464560/article/details/119711472
Spring Boot框架敏感信息泄露的完整介绍与SRC实战(附专属字典与PoC)相关推荐
- 【web渗透思路】框架敏感信息泄露(特点、目录、配置)
前言: 介绍: 博主:网络安全领域狂热爱好者(承诺在CSDN永久无偿分享文章). 殊荣:CSDN网络安全领域优质创作者,2022年双十一业务安全保卫战-某厂第一名,某厂特邀数字业务安全研究员,edus ...
- Spring boot带来的信息泄露
一.什么是Actuator Spring Boot Actuators 模块端点信息官方文档: Spring Boot Actuator Web API Documentation Spring Bo ...
- 【232期】面试官:如何保护 Spring Boot 配置文件敏感信息?
点击上方"Java精选",选择"设为星标" 别问别人为什么,多问自己凭什么! 下方有惊喜,留言必回,有问必答! 每天 08:15 更新文章,每天进步一点点... ...
- 【web渗透思路】敏感信息泄露(网站+用户+服务器)
前言: 介绍: 博主:网络安全领域狂热爱好者(承诺在CSDN永久无偿分享文章). 殊荣:CSDN网络安全领域优质创作者,2022年双十一业务安全保卫战-某厂第一名,某厂特邀数字业务安全研究员,edus ...
- Spring Boot 框架介绍和使用
本文参考自Spring Boot文档. Spring Boot 简介 Spring框架功能很强大,但是就算是一个很简单的项目,我们也要配置很多东西.因此就有了Spring Boot框架,它的作用很简单 ...
- spring boot框架_探索微框架:Spring Boot
spring boot框架 Spring Boot是Pivotal团队的全新框架,旨在简化新Spring应用程序的引导和开发. 该框架采用了自以为是的配置方法,使开发人员无需定义样板配置. 这样一来, ...
- springboot原生mysql写法_【Rainbond最佳实践】Spring Boot框架配置MySQL
Rainbond开源软件介绍: Rainbond是国内首个开源的生产级无服务器PaaS. 深度整合基于Kubernetes的容器管理.多类型CI/CD应用构建与交付.多数据中心的资源管理等技术,提供云 ...
- 检测到目标url存在内部ip地址泄露_Cendertron,动态爬虫与敏感信息泄露检测
Cendertron,动态爬虫与敏感信息泄露检测 Cendertron = Crawler + Rendertron Cendertron https://url.wx-coder.cn/HinPM ...
- Spring Boot框架中使用Jackson的处理总结
1.前言 通常我们在使用Spring Boot框架时,如果没有特别指定接口的序列化类型,则会使用Spring Boot框架默认集成的Jackson框架进行处理,通过Jackson框架将服务端响应的数据 ...
最新文章
- Apache RocketMQ 的 Service Mesh 开源之旅
- 让IDA Pro输出能让gcc编译器直接编译的.s汇编文件
- 记录上一个项目踩过的坑
- ios开发学习--动画(Animation)效果源码分享--系列教程1
- JavaScript:判断当前浏览器是否为微信浏览器
- python访问字符串中的部分字符的操作_小白学Python-13(字符串基础与简单操作)...
- Coffice协同办公管理系统(C#)(
- 基于汇编与c语言的单片机原理及应用答案,基于汇编与C语言的单片机原理及应用...
- 漂浮广告代码、漂浮代码分析(讲解)
- freyja 功能基本完毕
- 调用百度AI开放平台实现图片文字识别
- SLF4J: Class path contains multiple SLF4J bindings(log4j与logback冲突了)
- 求菲波那切数列第n项
- apk包反编译,签名
- FCF中地址控制域设定值对帧中所包含地址的影响
- VirtualBox桥接网络设置无效的解决办法
- 第一篇博客,与您共勉
- eclipse svn切换用户信息
- jdk8中Map集合中的compute系列方法的使用
- 网站建设设计|这三个基本要求你需要重点掌握!