rdlc tablix_SQL Server中的报表–通过分组功能(由Tablix控件提供)处理数据
rdlc tablix
介绍 (Introduction)
In many of our past “get togethers” we have discussed pivoting raw data in order to best represent corporate data within our business reporting. As we may remember, in many instances we pivoted the data within the report query.
在过去的许多“聚在一起”中,我们讨论了枢轴原始数据,以便在业务报告中最好地表示公司数据。 我们可能还记得,在许多情况下,我们在报表查询中旋转数据。
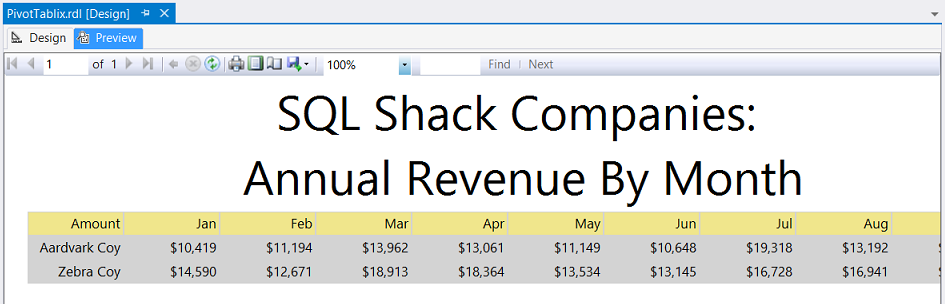
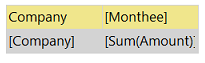
In today’s “fire side chat” we shall be discussing how we may achieve the same effect with the report controls, by manipulating the data via the grouping functions (provided by the Tablix control). In other words, we shall be discussing how we may go from this
在今天的“旁白”中,我们将讨论如何通过分组功能(由Tablix控件提供)操纵数据,从而如何使用报表控件实现相同的效果。 换句话说,我们将讨论如何从此发展
to this…
为此...
Without further adieu, let us get started.
没有更多的理由,让我们开始吧。
入门 (Getting started)
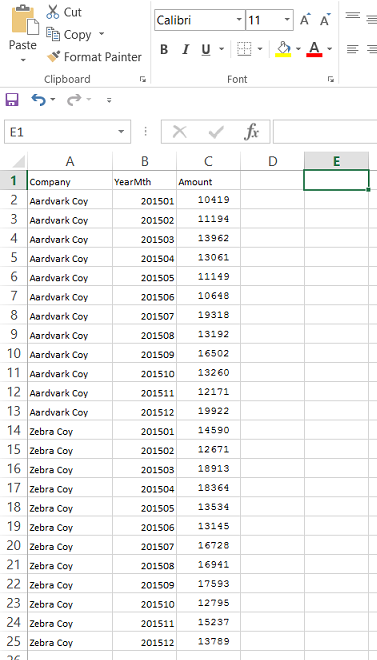
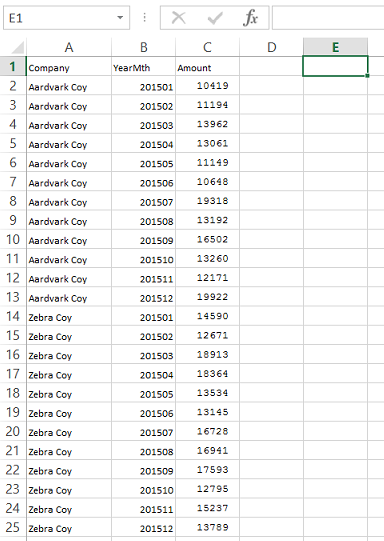
We begin with a small sample of data representing the revenue from two SQL Shack corporate divisions. As most folks in the financial world prefer spreadsheets, we received the necessary data in spreadsheet format (see below).
我们从一小部分数据样本开始,这些数据代表了两个SQL Shack公司部门的收入。 由于金融界的大多数人都喜欢电子表格,因此我们以电子表格格式接收了必要的数据(请参见下文)。
The data above represent the revenue for 2015, month by month.
上面的数据按月表示2015年的收入。
Our first task is to load the data into SQL Server.
我们的首要任务是将数据加载到SQL Server中。
Having completed the SQL Server load (see above), our next task is to create an additional column that will display the calendar month for any given “YearMth”. As an example, for 201501 we would expect to see “Jan”.
完成SQL Server加载(请参见上文)后,我们的下一个任务是创建一个附加列,该列将显示任何给定“ YearMth”的日历月。 例如,对于201501,我们希望看到“ Jan”。
As the reader may have noted, in a previous article I created a user function that accepts a year and month combination and returns the calendar month name. The function is named “Monthee” and the code may be found in Addenda 1.
正如读者可能已经注意到的那样,在上一篇文章中,我创建了一个接受年份和月份组合并返回日历月份名称的用户函数。 该函数名为“ Monthee”,其代码可以在附录1中找到。
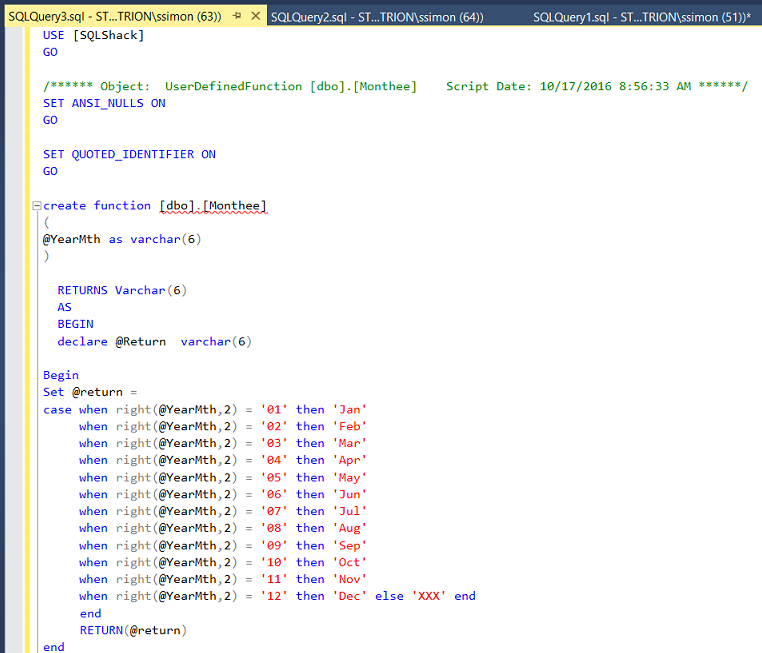
The function “Monthee” may be seen above.
函数“ Monthee”可以在上面看到。
Having now met “Monthee”, we shall use the function in our report query.
现在遇到了“ Monthee”,我们将在报表查询中使用该函数。
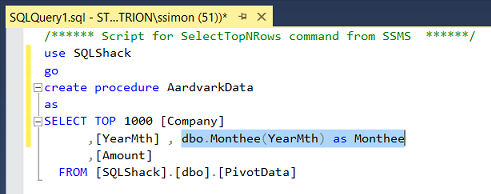
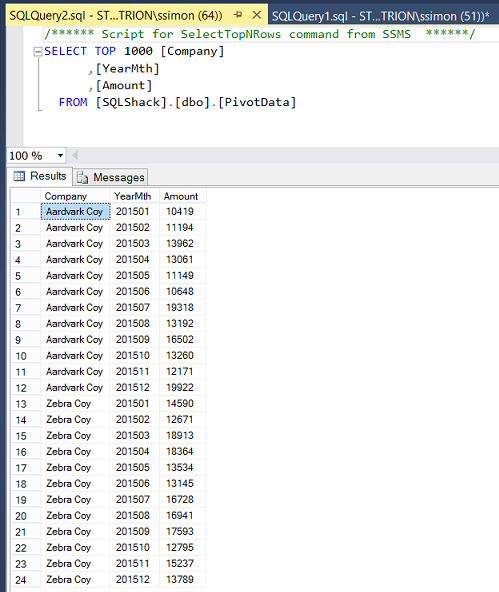
Our report query may be seen above. In this query we wish to extract the company name, the year and month combination, the calendar month name and the sales figures (“Amount”). Having created the necessary code, we proceed to create a stored procedure (which we shall utilize within our report).
我们的报告查询可以在上方看到。 在此查询中,我们希望提取公司名称,年月组合,日历月名称和销售数字(“金额”)。 创建了必要的代码之后,我们继续创建存储过程(将在报告中使用该存储过程)。
创建我们的报告 (Creating our report)
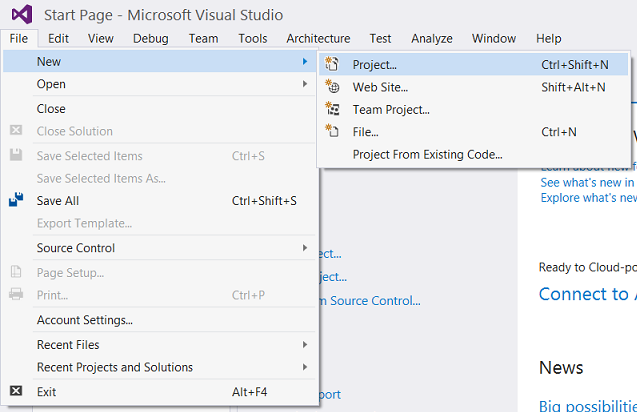
Opening Visual Studio 2015 or SQL Server Data Tools 2010 or later, we create a new Reporting Services project (see below).
打开Visual Studio 2015或SQL Server Data Tools 2010或更高版本,我们创建一个新的Reporting Services项目(如下所示)。
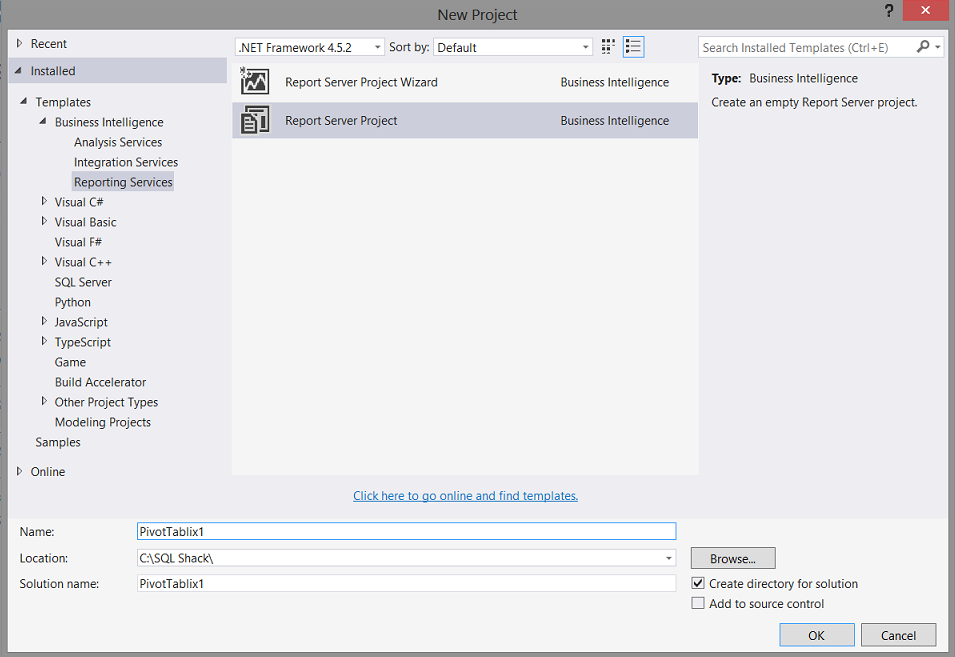
We give our new “Report Server Project” a name (see above).
我们为新的“报表服务器项目”命名(请参见上文)。
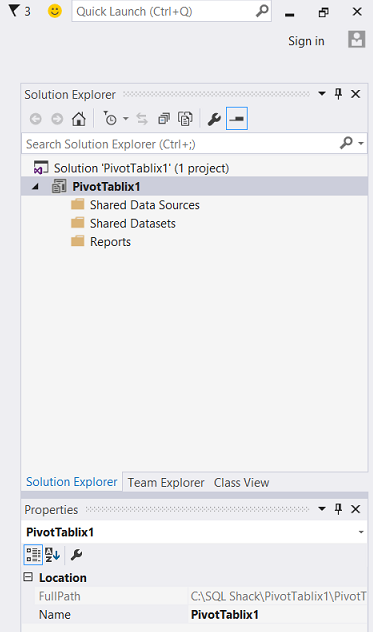
Upon creating our project we find ourselves on our design surface (see above).
创建项目后,我们发现自己位于设计图上(见上文)。
Our first task is to connect to our relational database “SQLShack”.
我们的首要任务是连接到关系数据库“ SQLShack”。

We right click upon the “Shared Data Source” folder and select “Add New Data Source” from the context menu (see above).
我们右键单击“共享数据源”文件夹,然后从上下文菜单中选择“添加新数据源”(请参见上文)。
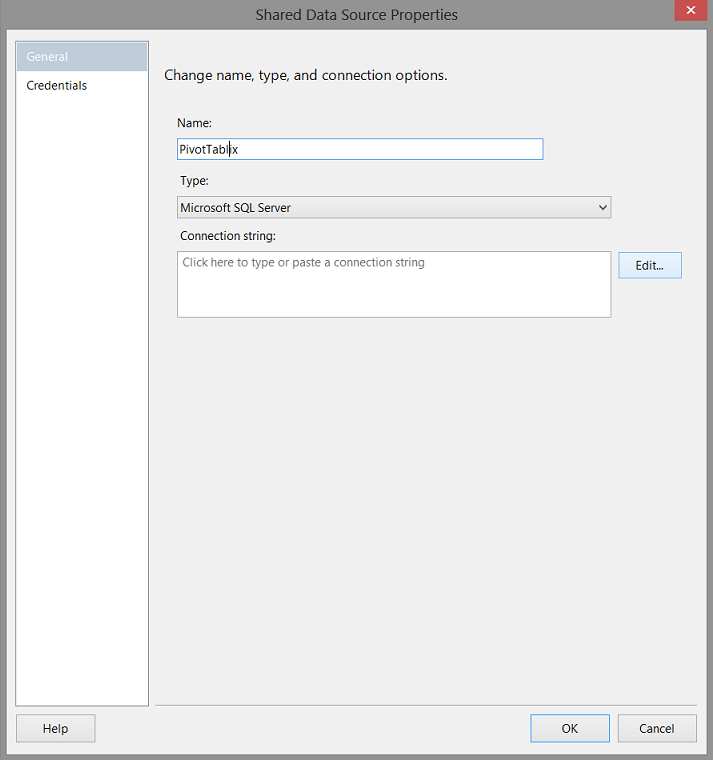
The “Shared Data Source” properties dialogue box appears. We give our “Shared Data Source” a name and click upon the “Edit” button to create the necessary “Connection String” (see above).
出现“共享数据源”属性对话框。 我们给“共享数据源”命名,然后单击“编辑”按钮以创建必要的“连接字符串”(请参见上文)。
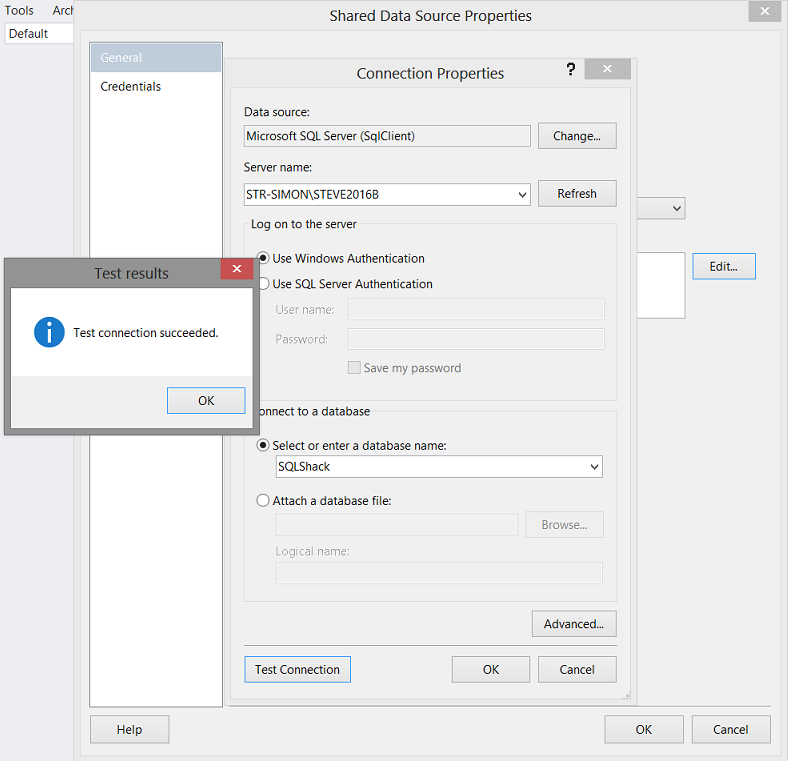
The “Connection Properties” dialogue box appears. We tell the system to which server the connection should be made, in addition to providing the name of the relevant database. This achieved we test the connection (see above). We click “OK”.
出现“连接属性”对话框。 除了提供相关数据库的名称之外,我们还告诉系统应该与哪个服务器建立连接。 这样就可以测试连接(见上文)。 我们点击“确定”。
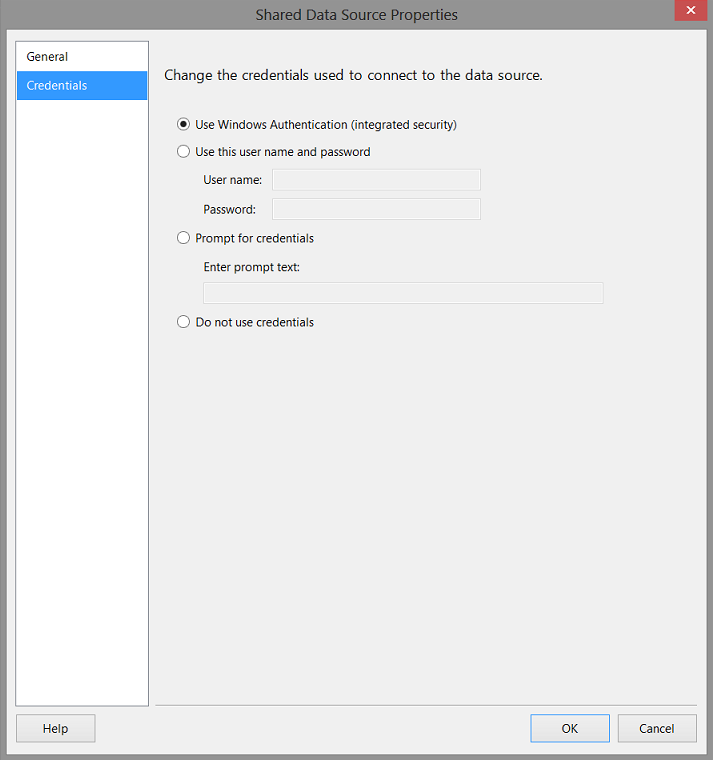
Clicking upon the “Credentials” tab, we accept the default option to utilize Windows Authentication to verify that the user is entitled to view the data (see above). Finally we click “OK” to leave the “Shared Data Source Properties” dialogue box and we find ourselves back upon our design surface.
单击“凭据”选项卡,我们接受默认选项以利用Windows身份验证来验证用户是否有权查看数据(请参见上文)。 最后,我们单击“确定”离开“共享数据源属性”对话框,然后回到设计图面上。
向我们的项目添加新报告 (Adding a new report to our project)
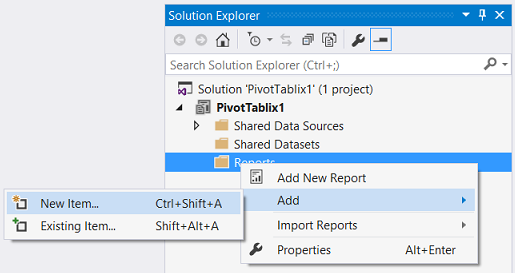
We right click upon the “Reports” folder to bring up the related context menu. We select “Add” and “New Item” (see above).
我们右键单击“ Reports”文件夹,以打开相关的上下文菜单。 我们选择“添加”和“新项目”(见上文)。
We select “Report” and give our new report the name “PivotTablix1” and click “Add” (see above).
我们选择“报告”并将新报告命名为“ PivotTablix1”,然后单击“添加”(请参见上文)。
Our report design surface appears (see above).
出现我们的报告设计图(请参见上文)。
创建本地数据集 (Creating a local dataset)
Our next task is to create a local data set.
我们的下一个任务是创建本地数据集。
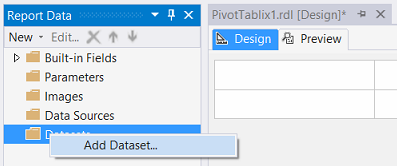
We right click upon the “Datasets” folder (above) and bring up the context menu. We select “Add Dataset” (see above).
我们右键单击“ Datasets”文件夹(上方),然后打开上下文菜单。 我们选择“添加数据集”(见上文)。
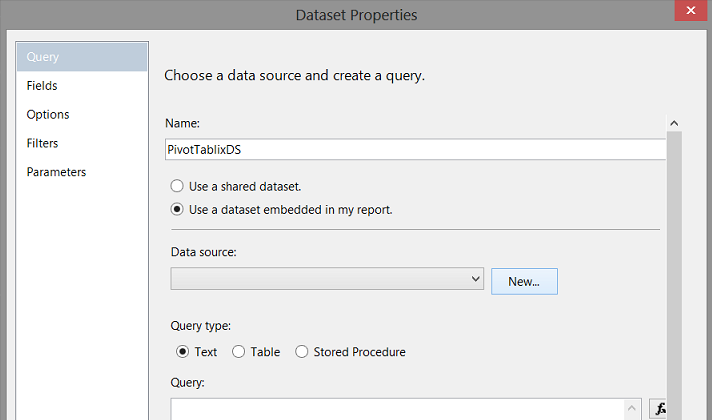
The “Dataset Properties” dialogue box opens. We give our local dataset the name “PivotTablixDS” and select “Use a dataset embedded in my report” (see above). We must new click the “New” button to create a new “local data source” which shall be utilized to connect to the shared data source that we created above. As I have mentioned in other articles, the advantage of utilizing local datasets and local data sources are that we can customize them for this one particular report and yet not affect the shared data source, considering that a Reporting Service project will probably have a myriad of different reports.
“数据集属性”对话框打开。 我们将本地数据集命名为“ PivotTablixDS”,然后选择“使用嵌入到我的报告中的数据集”(请参见上文)。 我们必须重新单击“新建”按钮以创建新的“本地数据源”,该新本地数据源将用于连接到上面创建的共享数据源。 正如我在其他文章中提到的那样,利用本地数据集和本地数据源的优势在于,我们可以为一个特定的报表自定义它们,而不会影响共享数据源,因为Reporting Service项目可能会有无数的不同的报告。
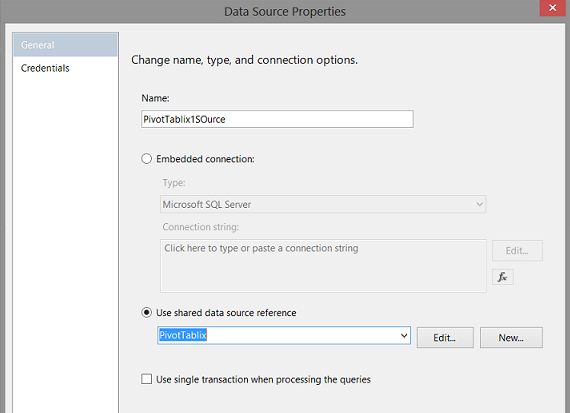
Our configured “Local Data Source” may be seen above. We click “OK” to leave the dialogue box.
我们配置的“本地数据源”可以在上方看到。 我们单击“确定”离开对话框。
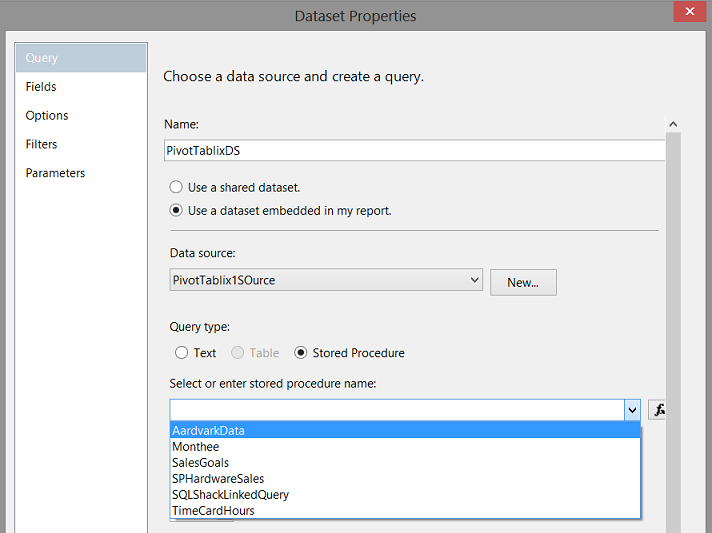
We find ourselves back within the “Dataset Properties” dialogue box. We click the “Stored Procedure” Query type and select the stored procedure that we created within SQL Server Management Studio (see above). We click “OK” to continue.
我们回到“数据集属性”对话框中。 我们单击“存储过程”查询类型,然后选择在SQL Server Management Studio中创建的存储过程(请参见上文)。 我们单击“确定”继续。
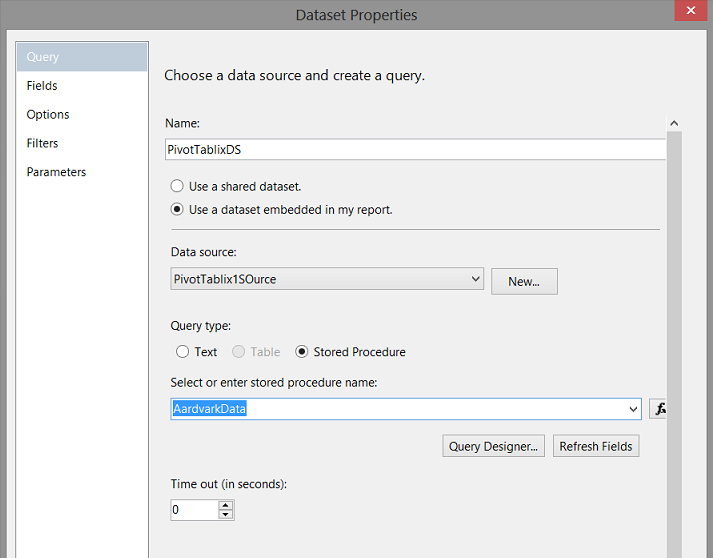
Whilst we now have a connection through to the stored procedure, we much now inform our dataset of which data fields will be pulled. We click the “Refresh Fields” button (see above).
现在,我们已经连接到存储过程,现在,我们将通知我们的数据集哪些数据字段将被提取。 我们点击“刷新字段”按钮(见上文)。
Clicking upon the “Fields” tab, we note that the fields within our stored procedure are now are visible to our report (see above). We click “OK” to leave the “Dataset Properties” dialogue box.
单击“字段”选项卡,我们注意到存储过程中的字段现在对我们的报表可见(见上文)。 我们单击“确定”离开“数据集属性”对话框。
When returned to our drawing surface, we cannot help but notice that the dataset that we just created is now clearly visible (see above).
当返回到绘图图面时,我们不禁会注意到刚才创建的数据集现在清晰可见(请参见上文)。
创建我们的数据显示 (Creating our data display)
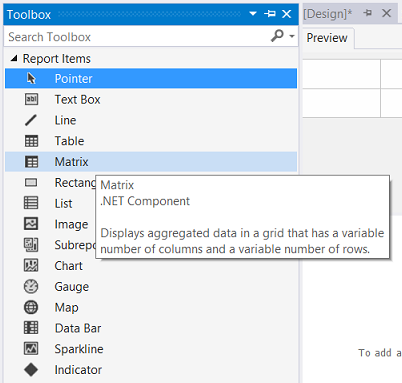
Our next task is to “drag” a “Matrix” from the toolbox and place it on our drawing surface.
我们的下一个任务是从工具箱中“拖动”一个“矩阵”并将其放置在我们的绘图表面上。
The “Matrix” may be seen above.
可以在上方看到“矩阵”。
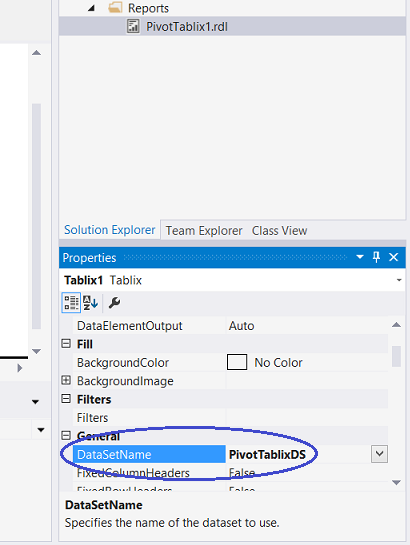
Clicking upon the “Matix/Tablix” we bring up the “Tablix1” property and assign the dataset which we just created (see above).
单击“ Matix / Tablix”,我们调出“ Tablix1”属性,并分配刚创建的数据集(请参见上文)。
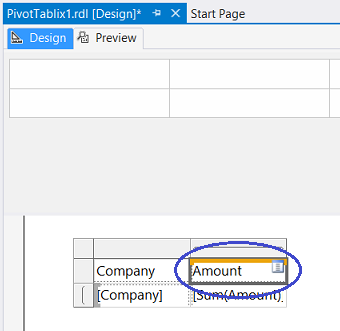
Now that the dataset has been allocated to the “Matrix / Tablix”, we are now able to “Add” our desired columns to the “Matrix / Tablix”. We add “Company” and the “Amount” field (see above).
现在,数据集已分配给“ Matrix / Tablix”,我们现在可以将所需的列“添加”到“ Matrix / Tablix”。 我们添加“公司”和“金额”字段(请参见上文)。
The important point to note is that in this case we shall utilize the “Column Grouping” which in past exercises we have removed.
需要注意的重要一点是,在这种情况下,我们将使用在过去的练习中已删除的“列分组”。
设置“列分组”条件 (Setting the “Column Grouping” criteria)
We commence by right clicking upon the “ColumnGroup” tab (see below). The context menu appears.
我们首先右键单击“ ColumnGroup”选项卡(见下文)。 出现上下文菜单。
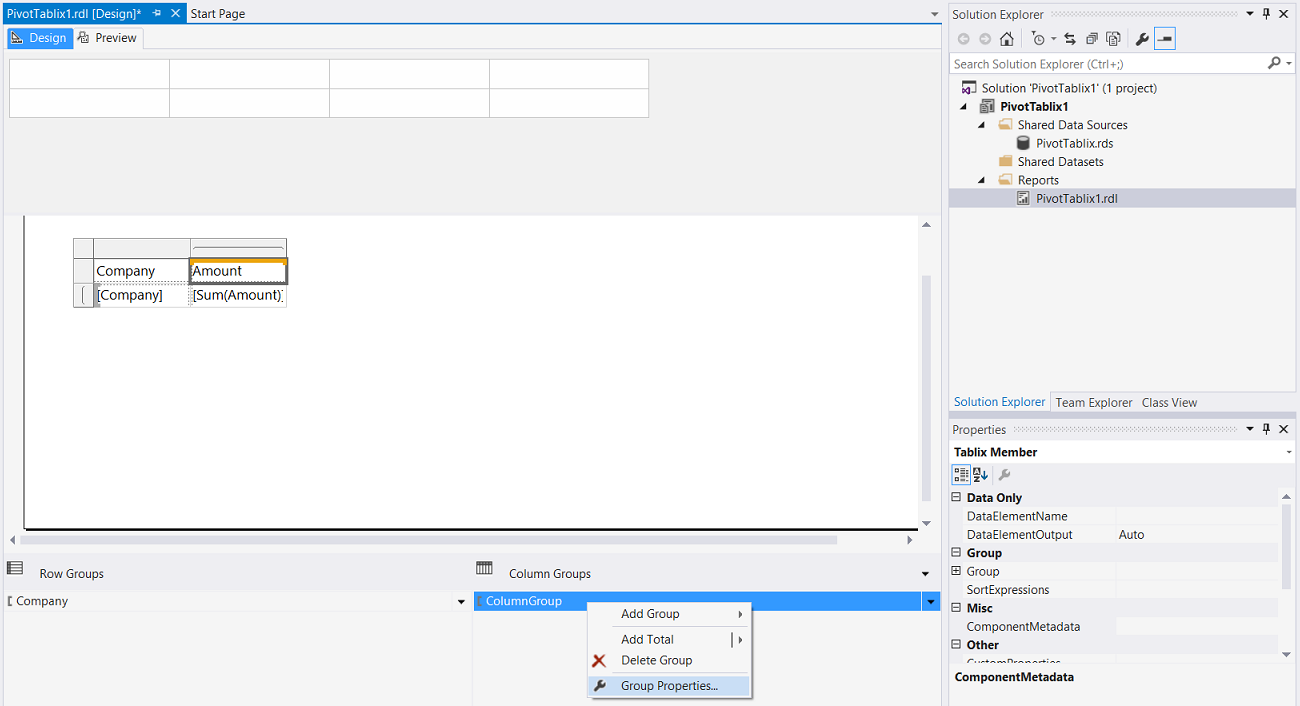
We select “Group Properties”.
我们选择“组属性”。
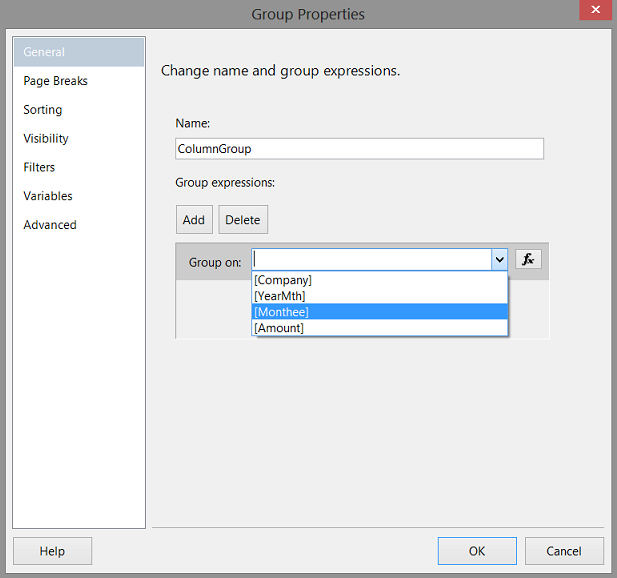
We add “Monthee” as the “Group on” field (see above).
我们将“ Monthee”添加为“ Group on”字段(请参见上文)。
Now here is where the “real trick” appears. We must now set the “Column Sorting” which we shall do with the “YearMth” field. The astute reader will remember that “YearMth” contained the year and month of the revenue record.
现在,这里出现了“真正的把戏”。 现在,我们必须设置“列排序”,我们将对“年份”字段进行设置。 精明的读者会记得,“ YearMth”包含了收入记录的年份和月份。
设置“行分组”标准 (Setting the “Row Grouping” Criteria)
This time however we right click upon the “RowGroup” tab. The “RowGroup” context menu appears.
但是这次我们右键单击“ RowGroup”选项卡。 出现“ RowGroup”上下文菜单。
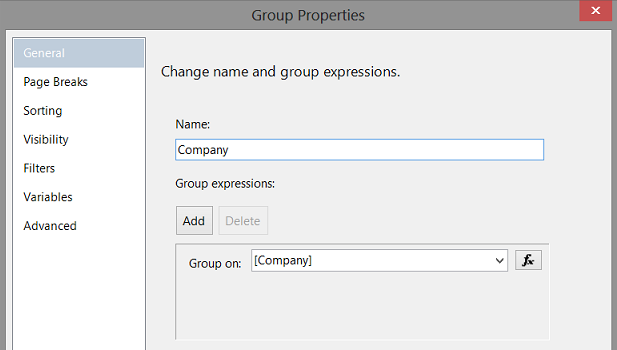
We opt to “Group on” Company (see above). We click OK to leave the “Group Properties” dialogue box.
我们选择“加入”公司(见上文)。 我们单击确定离开“组属性”对话框。
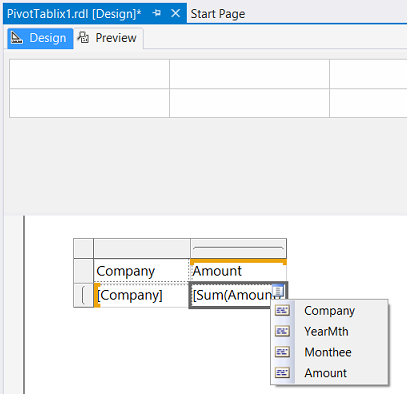
We find ourselves back upon the design surface and have on last (however extremely important) task to do. We must replace the “Amount” field shown above with the “Monthee” field (see below).
我们回到设计表面,并有最后( 尽管非常重要 )的任务要做。 我们必须将上面显示的“金额”字段替换为“ Monthee”字段(请参见下文)。
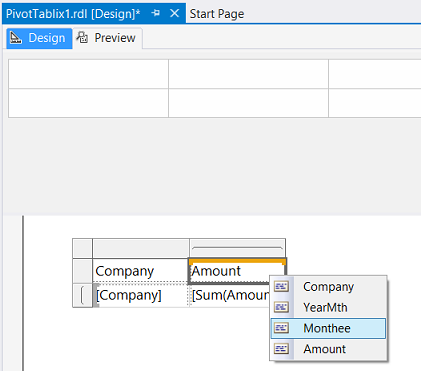
This change will permit the month names to be displayed as the column header.
此更改将允许月份名称显示为列标题。
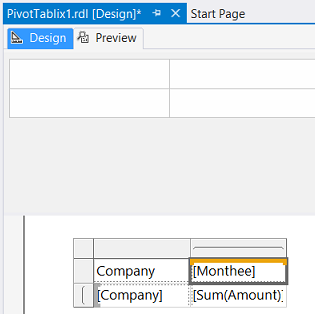
We note the effect of the change above.
我们注意到上述变化的影响。
让我们来看看我们的报告吧! (Let us give our report a spin!)
We click upon the “Preview” tab and our report is brought into view. We note that instead of the initial data format that we placed into our SQL Server table, that our data is now displayed in a format that starts with January and ends with December (not shown). This is all possible as we utilized the year and month combination as the sort field (see above).
我们单击“预览”选项卡,然后我们的报告就会显示出来。 我们注意到,现在的数据不是以放置在SQL Server表中的初始数据格式显示的,而是以从1月开始到12月结束的格式显示的(未显示)。 由于我们将年和月的组合用作排序字段,因此这一切都是可能的(请参见上文)。
Now it is blatantly obvious that we need to perform a tad of formatting to “pretty up” our report.
现在,很明显,我们需要执行一些格式化以“漂亮”我们的报告。
格式化我们的报告 (Formatting our report)
Back within design view we begin by formatting our “Title” line.
回到设计视图中,我们首先格式化“标题”行。
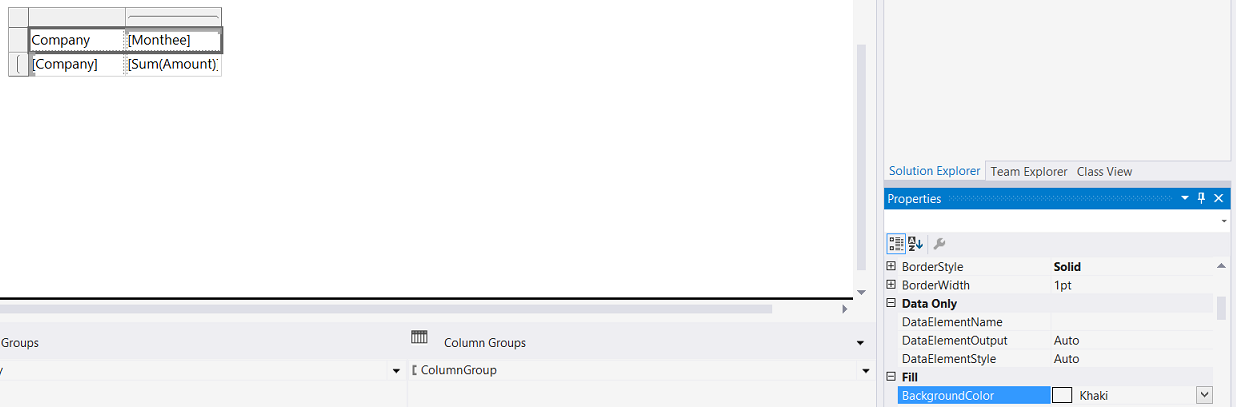
We set the “BackGroundColor” to Khaki (see above).
我们将“ BackGroundColor”设置为卡其色(见上文)。
We note that our “Title or Column Header” line now has a Khaki coloured fill.
我们注意到,“标题或列标题”行现在具有卡其色的填充。
We set the “Data Row” background to “LightGray”.
我们将“数据行”背景设置为“浅灰色”。
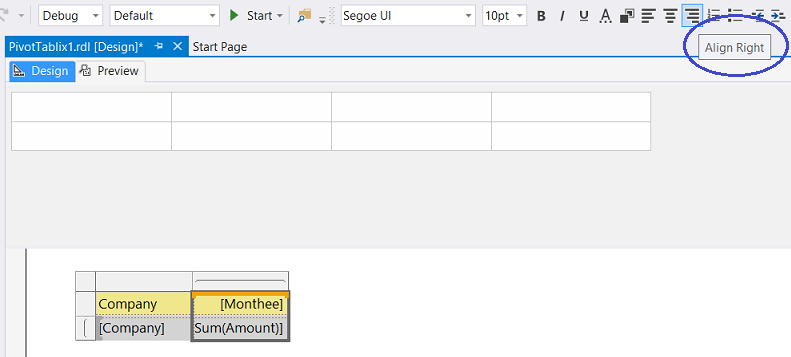
Our modification may be seen above. Further, we shall ensure that the “Monthee” and “Amount” columns are “Right” aligned.
我们的修改可以在上面看到。 此外,我们将确保“ Monthee”和“ Amount”列与“ Right”对齐。
Our last task is to format the financial amounts so that they represent dollar values.
我们的最后一项任务是格式化财务金额,以便它们代表美元价值。
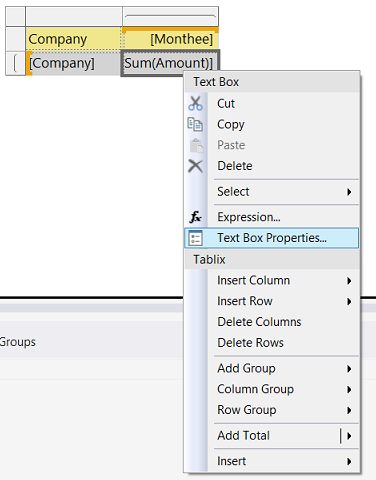
Highlighting the “Sum(amount)” text box and right clicking upon it (see above), we bring up the context menu. We select the “Text Box Properties” option (see above).
突出显示“总和(金额)”文本框,然后右键单击它(参见上文),我们弹出上下文菜单。 我们选择“文本框属性”选项(见上文)。
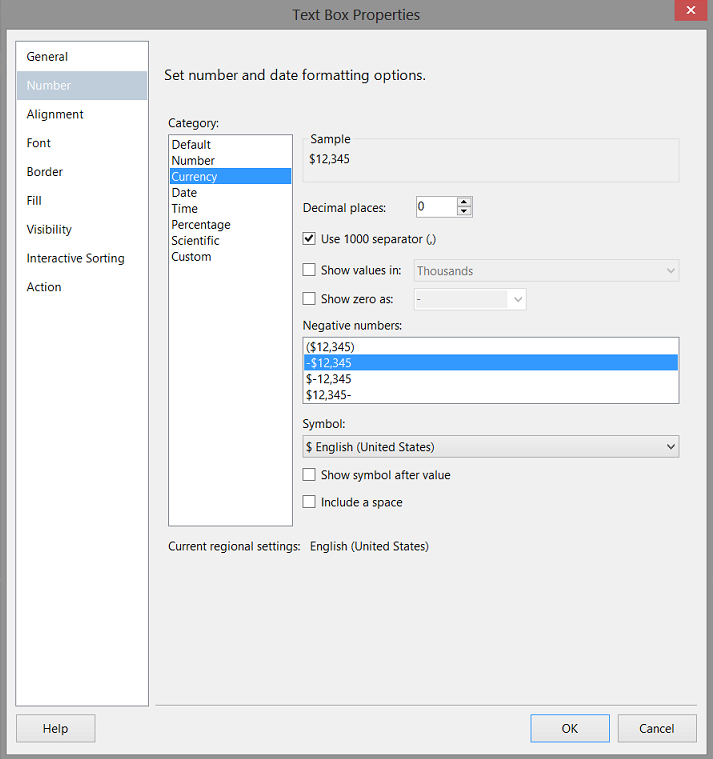
The “Text Box Properties” dialogue box appears. We select “Number” from the upper left portion of the box and set the value to “Currency” and set the decimal places to 0. We also tell the system that we wish to have negative values represented with a minus sign (see above). We click “OK” to leave the “Text Box Properties” dialog box.
出现“文本框属性”对话框。 我们从框的左上方选择“数字”,然后将值设置为“货币”,并将小数位设置为0。我们还告诉系统希望用负号表示负值(请参见上文) 。 我们单击“确定”离开“文本框属性”对话框。
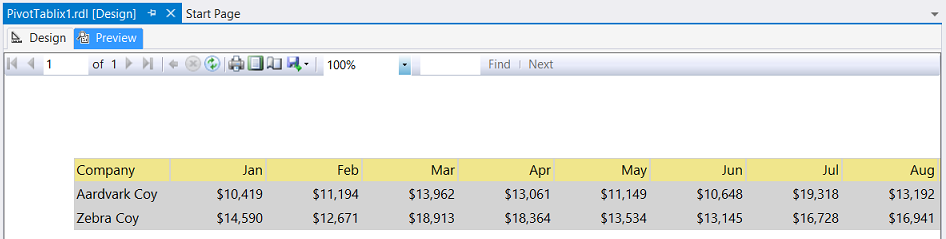
Clicking the “Preview” button once again we see our completed report.
再次单击“预览”按钮,我们将看到已完成的报告。
结论 (Conclusions)
Once again, we have arrived at the end of another “get together”. In past exercises we have always pivoted report data within our query prior to populating our report dataset.
我们再次到达了另一个“聚在一起”的尽头。 在过去的练习中, 在填充报告数据集之前 ,我们始终在查询中旋转报告数据。
In our current chat, we have seen how this pivoting may be achieved via the report controls, in a most efficient and effective manner.
在当前的聊天中,我们已经看到如何通过报表控件以最有效和有效的方式实现这一枢纽。
As always, should you have any questions pertaining to what we have just discussed or for any other “fireside chat” for that matter, please do feel free to contact me.
与往常一样,如果您对我们刚刚讨论的内容或任何其他“炉边聊天”有疑问,请随时与我联系。
Happy programming and all the best!
祝您编程愉快,一切顺利!
附录1 (Addenda 1)
USE [SQLShack]
GO
/****** Object:  UserDefinedFunction [dbo].[Monthee]    Script Date: 10/17/2016 8:56:33 AM ******/
SET ANSI_NULLS ON
GO
SET QUOTED_IDENTIFIER ON
GOcreate function [dbo].[Monthee]
(
@YearMth as varchar(6)
)RETURNS Varchar(6) AS BEGIN declare @Return  varchar(6)Begin
Set @return =
case when right(@YearMth,2) = '01' then 'Jan'when right(@YearMth,2) = '02' then 'Feb'when right(@YearMth,2) = '03' then 'Mar'when right(@YearMth,2) = '04' then 'Apr'when right(@YearMth,2) = '05' then 'May'when right(@YearMth,2) = '06' then 'Jun'when right(@YearMth,2) = '07' then 'Jul'when right(@YearMth,2) = '08' then 'Aug'when right(@YearMth,2) = '09' then 'Sep'when right(@YearMth,2) = '10' then 'Oct'when right(@YearMth,2) = '11' then 'Nov'when right(@YearMth,2) = '12' then 'Dec' else 'XXX' endend RETURN(@return)
end
GO
参考资料 (References)
- Understanding Groups (Report Builder and SSRS)了解组(报表生成器和SSRS)
- Create a Basic Table Report (SSRS Tutorial)创建基本表报告(SSRS教程)
- Tablix Data Region (Report Builder and SSRS)Tablix数据区域(报表生成器和SSRS)
翻译自: https://www.sqlshack.com/reporting-sql-server-manipualting-data-via-grouping-functions-provided-by-tablix-control/
rdlc tablix
rdlc tablix_SQL Server中的报表–通过分组功能(由Tablix控件提供)处理数据相关推荐
- Atitit.Gui控件and面板----数据库区-mssql 2008 权限 配置 报表查看成员
Atitit.Gui控件and面板----数据库区-mssql 2008 权限 配置 报表查看成员 1. 配置服务器连接权限 1 2. 配置数据库权限 1 3. 设置表格/视图安全性 2 1. 配置服 ...
- Winform中在使用Dock属性设计页面布局控件的顺序导致页面效果不同的问题
场景 在Winform中进行页面设计时,常使用控件的Dock属性来进行布局调整.但是由于设置属性的顺序问题,导致达不到想要的效果. 比如以下两个控件 下面的控件设置的Dock属性是Bottom,即在页 ...
- WPF中ContextMenu(右键菜单)使用Command在部分控件上默认为灰色的处理方法
WPF中ContextMenu(右键菜单)使用Command在部分控件上默认为灰色的处理方法 原文:WPF中ContextMenu(右键菜单)使用Command在部分控件上默认为灰色的处理方法 问题描 ...
- matlab figure函数_如何在Matlab中使用GUI做一个简易音乐播放器? ---- (六)控件间的数据传递...
我纠结了两个星期是否要写这一章-最后决定还是要写一章收尾,来解释其中的控件间的数据传递问题. 在前五篇中,如果有童鞋跟上了我的思路或者做完了这样一个gui,会发现还有一个一直避开的遗留问题,就是将歌曲 ...
- mfc中在vector里添加控件类型的数据时出现C2248错误
@mfc中在vector里添加控件类型的数据时出现C2248错误 这是我在.h文件中定义的2个容器 public:vector<CComboBox*> cbx;vector <CSt ...
- 怎样把vc6的MSComm控件接受的数据实时的显示在编辑框,并把数据实时惠存txt文件中
怎样把vc6的MSComm控件接受的数据实时的显示在编辑框,并把数据实时存入txt文件中 我在做一个基于VC6的MSComm控件的电机上位机控制,数据帧格式采用9600bps,8位数据位,奇校验,1位 ...
- 添加Aforge控件,报错“在.....中没有可放置在工具箱上的控件”
添加Aforge控件,报错"在-中没有可放置在工具箱上的控件" 1.先添加AForge系列引用 工具–>NuGet包管理器–>管理解决方案的NuGet程序包 之后,打开 ...
- VFP中使用winsock控件收发二进制数据
VFP中使用winsock控件收发网络数据时,如果包含有二进制数据,总是会丢失,或者与实际数据不符,这是由于字符转换的问题引起的. vfp的字符串本质与二进制数据没有任何区别,而所有的OCX控件和CO ...
- delphi多线程超时控Delphi7中Indy控件对于网络数据的接收
1.引言 随着我国经济和社会的发展,水资源的科学管理与合理配置显得越来越重要.而获取大量的.实时的.动态的水资源及其相关信息则是实现水资源科学管理的基础.传统的水资源信息获取采用人工抄取数据后逐级的方 ...
最新文章
- bat启动/停止oracle服务
- 论机器学习的正确学习姿势
- 解决无法使用pip命令加载Python的扩展库问题
- spider RPC更新至2.0.0-RELEASE
- [翻译]在asp.net 2.0中使用WebParts
- SQL Server中的SQL语句优化与效率问题
- AcWing 1234. 倍数问题
- 在springBoot中使用Mapper类问题_@Mapper_@MapperScan_xml文件跟mapper分开_xml文件跟mapper在同一个目录下
- 缓存类java_用Java写一个简单的缓存操作类
- 用户空间和内核空间通讯之【Netlink 中】
- 我摸鱼写的Java片段意外称霸Stack Overflow十年、征服6000多GitHub开源项目: 有bug!...
- Liferay 加载自定义css 文件
- 网站部署——基于Django框架的天天生鲜电商网站项目系列博客(十六)
- win10的mysql密码忘记了怎么办_win10忘记mysql密码怎么办
- eclipse-mars-2-win32.zip 下载
- Android组件化开发实践和案例分享
- 关于protel 99 SE如何建立自己的元件库,导入Sch文件file is not recognized.
- yolov5facce-landmarks(98点)
- 会计平台常见问题QA
- vue输入空格符 以及空字符串在页面不显示或者只显示一个的问题