像冠军一样创建报告! Reporting Services的提示和技巧
介绍 (Introduction)
Over the past few months we have covered a lot of ground in our little “get togethers”. We have seen a few of my favorite tips and tricks. In today’s discussion we are going to have a look at a few gotcha’s upon which I have banged my head many times.
在过去的几个月中,我们的小“聚在一起”已经涵盖了很多领域。 我们已经看到了一些我最喜欢的提示和技巧。 在今天的讨论中,我们将看一些我屡屡碰到的陷阱。
We shall be looking at line charts where the dataset is missing data and the line charts reflect this data loss with gapping gaps. Further we are going to see how we may ‘smooth out’ these line charts.
我们将查看折线图,其中数据集缺少数据 ,折线图反映出这种数据丢失的差距。 此外,我们将看到如何“平滑”这些折线图。
Often when dealing with bar charts, the default colours are system set. Oft times this does not produce a satisfactory solution as we may wish set the colours of the bars ‘on the fly’ or dynamically. The case of earned income is a great example especially when we may wish to point out poor performance.
通常在处理条形图时,默认颜色是系统设置的。 通常,这不能产生令人满意的解决方案,因为我们可能希望“实时”或动态设置条的颜色。 挣钱的例子就是一个很好的例子,特别是当我们希望指出业绩不佳时。
Finally, we shall be looking at a nifty way of selecting the data that must appear on the screen for the user.
最后,我们将研究一种选择必须为用户显示在屏幕上的数据的巧妙方法。
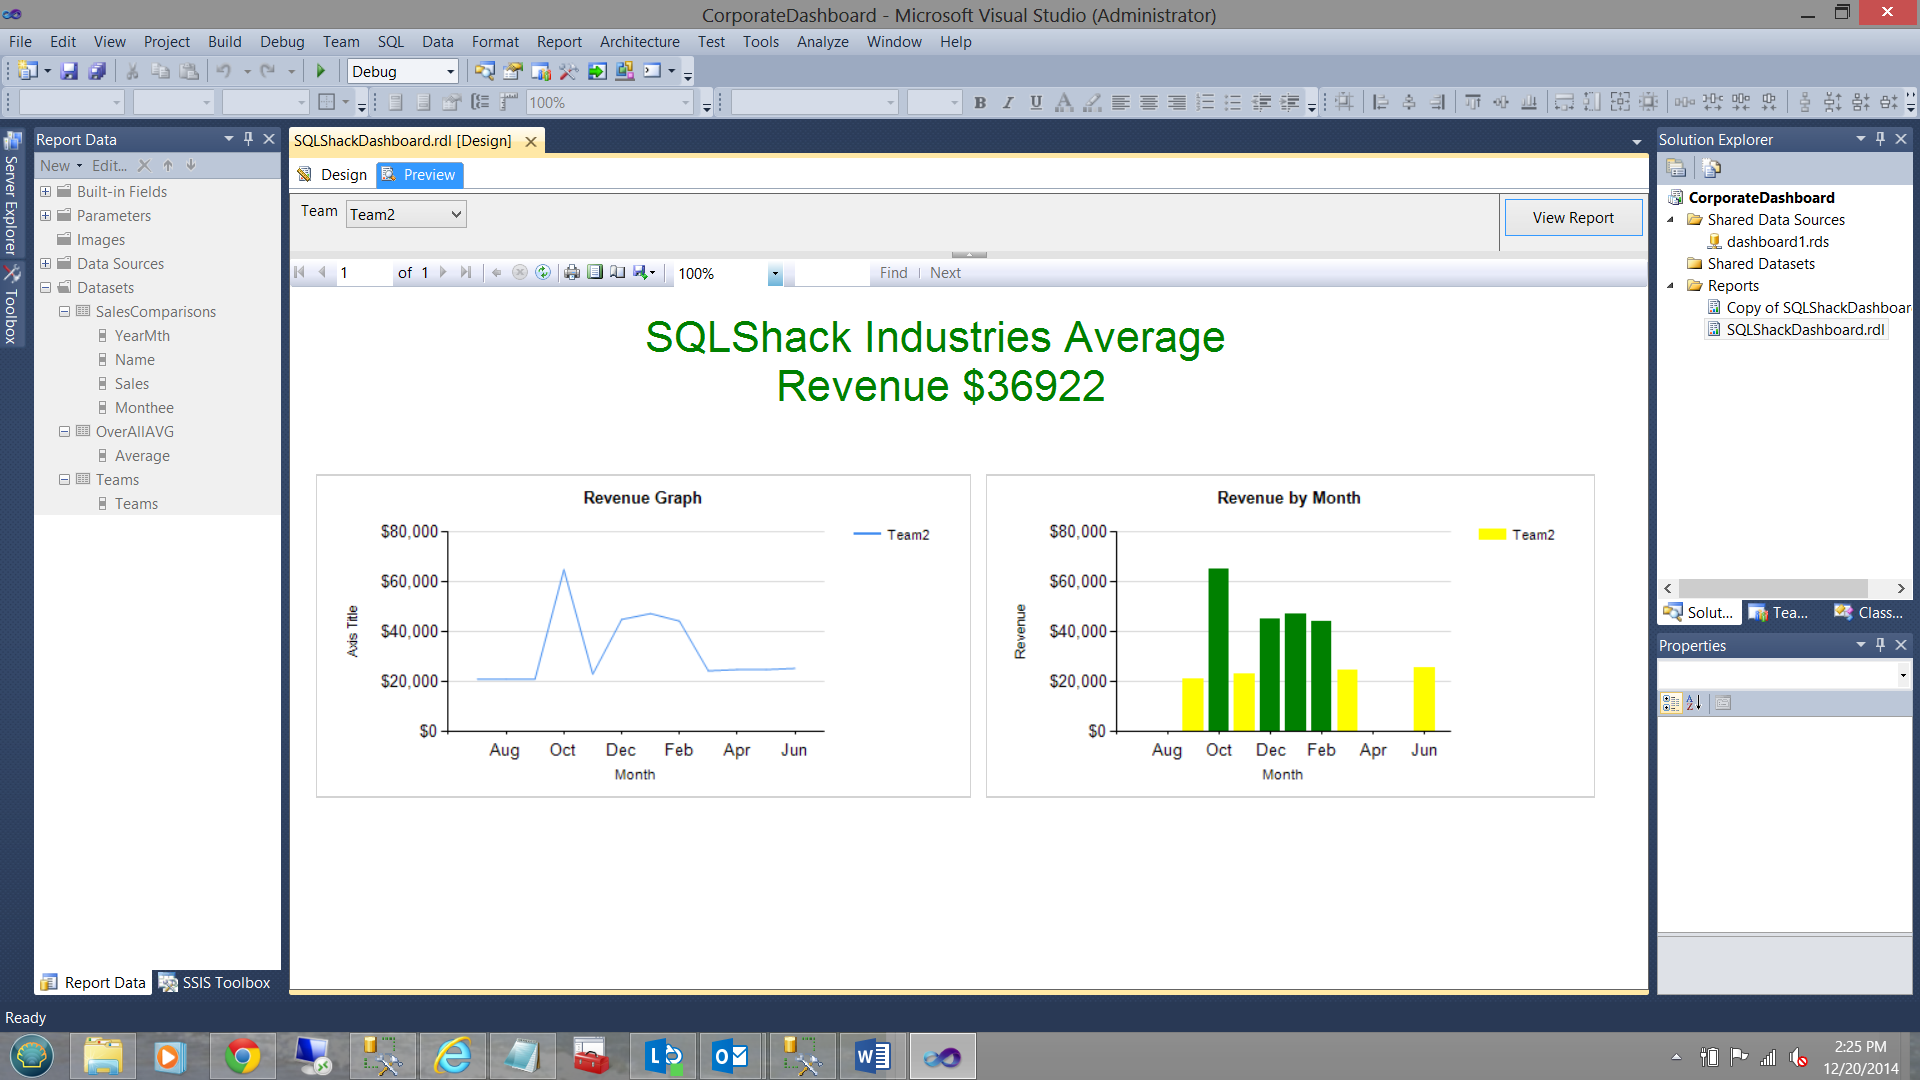
All of this is our challenge for today! The finised dashboard that we are going to create may be seen below:
所有这些都是我们今天面临的挑战! 我们将要创建的精细仪表板如下所示:
Enough said, let us get to it!!!
说够了,让我们开始吧!!!
准备数据 (Preparing our data)
The SQLShack Industries financial year runs from July 1st throught June 30th. Prior to utilizing the data within reports we must create a piece of code that will
SQLShack Industries财政年度从7月1日到6月30日。 在利用报告中的数据之前,我们必须创建一段代码,该代码将
- Based upon the ‘year’ part of the current day set the start and end dates for the ‘year to date’ data extract.
根据当天的“年”部分,设置“年至今”数据提取的开始和结束日期。 Apr,Aug,Dec,Feb,Jan,Jul,Jun,Mar,May,Nov,Oct,Sep but rather
Jul,Aug,Sep,Oct,Nov,Dec,Jan,Feb,Mar,Apr,May,Jun4月,8月,12月,2月,1月,7月,6月,3月,5月,11月,10月,9月
七月,八月,九月,十月,十一月,十二月,一月,二月,三月,四月,五月,六月
Whilst there are many methods of achieving this, I prefer the method shown below:
尽管有许多方法可以实现此目的,但我更喜欢以下所示的方法:
The code below shows how we obtain the start and end dates of our current fiscal year.
下面的代码显示了我们如何获取当前会计年度的开始和结束日期。
declare @beginFiscal date
declare @endFiscal date
declare @Yearr varchar(4)
declare @LowYearr varchar(4)
declare @decider int
declare @YearIncoming varchar(4)set @decider = datepart(Month,convert(date,getdate()))
set @Yearr = datepart(YEAR,Convert(date,Getdate()))
set @Lowyearr = @Yearr
set @Lowyearr = case when @decider < 7 then datepart(YEAR,Convert(date,Getdate())) else @LowYearr end
set @Yearr    = case when @decider >= 7 then datepart(YEAR,Convert(date,Getdate())) + 1 else @Yearr end
set @YearIncoming = @yearr
set @Beginfiscal = convert(varchar(4),@LowYearr) + '0701'
set @Endfiscal   = convert(varchar(4),@Yearr) + '0630'
An explanation of this code is in order.
此代码的解释是有序的。
- We first obtain the current month from the GetDate() function which returns the current Month. This is placed in the @decider variable.
我们首先从GetDate()函数获取当前月份,该函数返回当前月份。 这放置在@decider变量中。 - We next determine the current year and place the value of the year into @Yearr.
接下来,我们确定当前年份并将该年份的值放入@Yearr。 - We now set @LowYear to the value of @Year. ( the reason for this will be seen in a second).
现在,我们将@LowYear设置为@Year的值。 (其原因将在一秒钟内看到)。 - If @decider is less than 7 then we accept the current year FROM GetDate otherwise we leave the value of @LowYearr as it was (i.e. @Yearr)
如果@decider小于7,则我们接受GetDate中的当年,否则我们将保留@LowYearr的值(即@Yearr) - Similarily if @decider >= 7 then we increment the value @Yearr by 1.
类似地,如果@decider> = 7,那么我们将@Yearr的值增加1。 - Finally, we set the variable @BeginFiscal to the value of July 1 of the low year.
最后,我们将变量@BeginFiscal设置为低年7月1日的值。 - Finally, we set the variable @EndFiscal to the value of June 30 of the high year.
最后,我们将变量@EndFiscal设置为最高年份6月30日的值。
The next two screen dumps show the process in action (run in December). Note the override that I placed within the code to force the value of @decider to be 12 and @Yearr to be 2014
接下来的两个屏幕转储显示了正在运行的过程(在12月运行)。 请注意我在代码中放置的替代项,以强制@decider的值为12,而@Yearr的值为2014
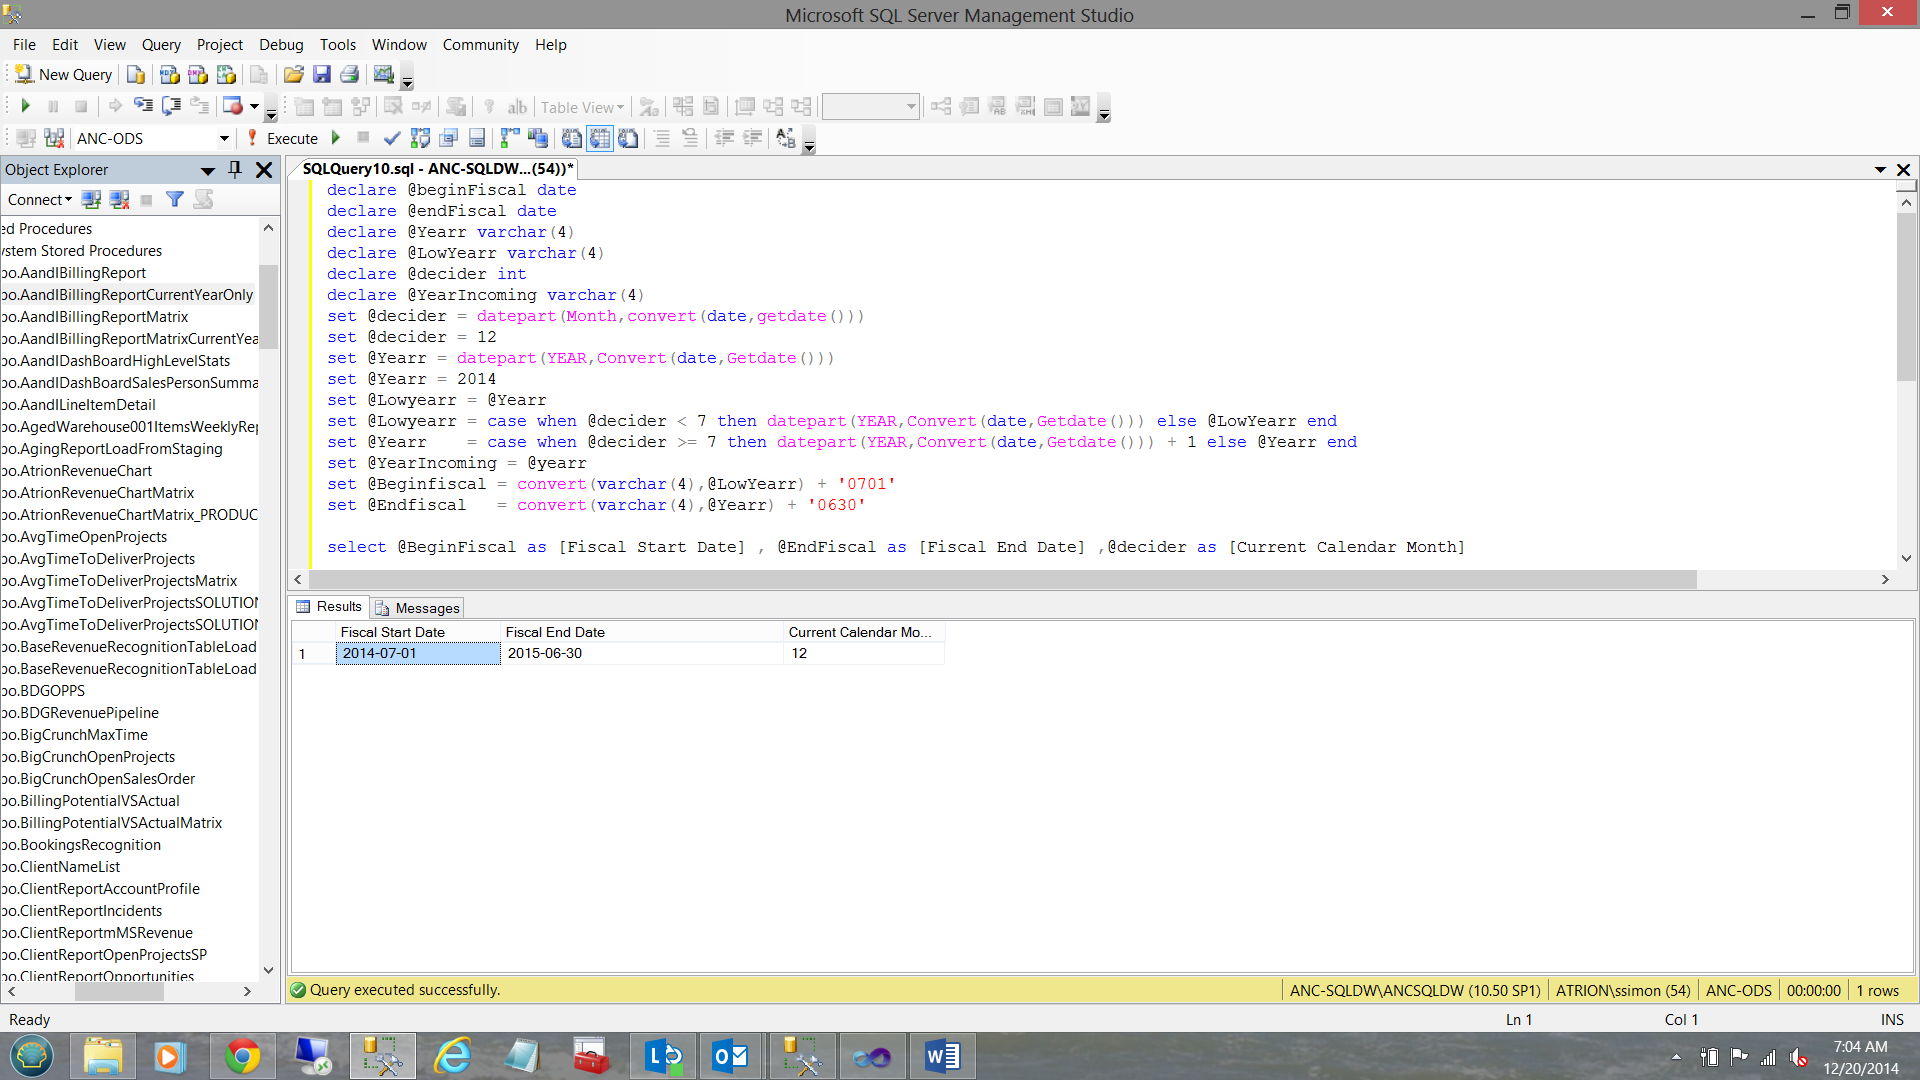
Into the first part of next year.. the month is set to 3 and the year to 2015.
进入明年的上半年。.月份设置为3,年份设置为2015。
Having obtained our fiscal year limits, we must now create a sort key to ensure that when we report upon our financial figures that we do not have the sorted data start in April and end in September.
在获得我们的年度限额,现在我们必须创建一个排序项,以确保当我们在我们的财务数据报告,我们没有在S中一个月‧日和普利最终排序的数据开始。
We create 12 variables which will eventually contain the year and months for the current fiscal year.
我们创建12个变量,这些变量最终将包含当前会计年度的年和月。
declare @month01 varchar(6)
declare @month02 varchar(6)
declare @month03 varchar(6)
declare @month04 varchar(6)
declare @month05 varchar(6)
declare @month06 varchar(6)
declare @month07 varchar(6)
declare @month08 varchar(6)
declare @month09 varchar(6)
declare @month10 varchar(6)
declare @month11 varchar(6)
declare @month12 varchar(6)
Having declared our variables, we now set the values for each of the variables. Let us have a look at how @month01 is defined.
声明了变量之后,我们现在为每个变量设置值。 让我们看看@ month01是如何定义的。
set @month01  =
--Set @month01 = the year part of the beginning of the fiscal year.convert(varchar(4),datepart(Year,@beginFiscal)) + --Now if the month number is one character long then we add a ‘0’ to the
--number i.e. ‘3’ become ‘03’ otherwise if it is 10 then leave it alone.case when len(convert(varchar(2),datepart(Month,@beginFiscal))) = 1 then convert(varchar(2),'0' + convert(varchar(2),datepart(Month,@beginFiscal)))  elseconvert(varchar(2),datepart(Month,@beginFiscal))end
The astute reader will note that for the ensuing months, that the length test is executed against the result of adding one more month to the month that came before and then testing its length.
精明的读者会注意到,在接下来的几个月中, 执行了长度测试,而不是在前一个月再增加一个月,然后再测试其长度 。
As an example if the month was September (month 9 in our case and length of 1), October will be month 10 THEREFORE before performing the test, we add one month and then perform the length test. The code for each month is shown below:
例如,如果一个月是9月(本例中为9月,长度为1),则10月将是执行测试之前的10个月,我们加一个月然后执行长度测试。 每月的代码如下所示:
set @month01  =convert(varchar(4),datepart(Year,@beginFiscal)) + case when len(convert(varchar(2),datepart(Month,@beginFiscal))) = 1 then convert(varchar(2),'0' + convert(varchar(2),datepart(Month,@beginFiscal)))  elseconvert(varchar(2),datepart(Month,@beginFiscal))endset @month02  =convert(varchar(4),datepart(Year,@beginFiscal)) + case when len(convert(varchar(2),datepart(Month,dateadd(mm,1,@beginFiscal))))  = 1 then convert(varchar(2),'0' + convert(varchar(2),datepart(Month,dateadd(mm,1,@beginFiscal))))  elseconvert(varchar(2),datepart(Month,dateadd(mm,1,@beginFiscal)))end   set @month03  =convert(varchar(4),datepart(Year,@beginFiscal)) + case when len(convert(varchar(2),datepart(Month,dateadd(mm,2,@beginFiscal))))  = 1 then convert(varchar(2),'0' + convert(varchar(2),datepart(Month,dateadd(mm,2,@beginFiscal))))  elseconvert(varchar(2),datepart(Month,dateadd(mm,2,@beginFiscal)))end   set @month04  =convert(varchar(4),datepart(Year,@beginFiscal)) + case when len(convert(varchar(2),datepart(Month,dateadd(mm,3,@beginFiscal))))  = 1 then convert(varchar(2),'0' + convert(varchar(2),datepart(Month,dateadd(mm,3,@beginFiscal))))  elseconvert(varchar(2),datepart(Month,dateadd(mm,3,@beginFiscal)))end   set @month05  =convert(varchar(4),datepart(Year,@beginFiscal)) + case when len(convert(varchar(2),datepart(Month,dateadd(mm,4,@beginFiscal))))  = 1 then convert(varchar(2),'0' + convert(varchar(2),datepart(Month,dateadd(mm,4,@beginFiscal))))  elseconvert(varchar(2),datepart(Month,dateadd(mm,4,@beginFiscal)))end   set @month06  =convert(varchar(4),datepart(Year,@beginFiscal)) + case when len(convert(varchar(2),datepart(Month,dateadd(mm,5,@beginFiscal))))  = 1 then convert(varchar(2),'0' + convert(varchar(2),datepart(Month,dateadd(mm,5,@beginFiscal))))  elseconvert(varchar(2),datepart(Month,dateadd(mm,5,@beginFiscal)))end   set @month07  =convert(varchar(4),datepart(Year,@endFiscal)) + case when len(convert(varchar(2),datepart(Month,dateadd(mm,-5,@endFiscal))))  = 1 then convert(varchar(2),'0' + convert(varchar(2),datepart(Month,dateadd(mm,-5,@endFiscal))))  elseconvert(varchar(2),datepart(Month,dateadd(mm,-5,@endFiscal)))end set @month08  =convert(varchar(4),datepart(Year,@endFiscal)) + case when len(convert(varchar(2),datepart(Month,dateadd(mm,-4,@endFiscal))))  = 1 then convert(varchar(2),'0' + convert(varchar(2),datepart(Month,dateadd(mm,-4,@endFiscal))))  elseconvert(varchar(2),datepart(Month,dateadd(mm,-4,@endFiscal)))end
set @month09  =convert(varchar(4),datepart(Year,@endFiscal)) + case when len(convert(varchar(2),datepart(Month,dateadd(mm,-3,@endFiscal))))  = 1 then convert(varchar(2),'0' + convert(varchar(2),datepart(Month,dateadd(mm,-3,@endFiscal))))  elseconvert(varchar(2),datepart(Month,dateadd(mm,-3,@endFiscal)))end set @month10  =convert(varchar(4),datepart(Year,@endFiscal)) + case when len(convert(varchar(2),datepart(Month,dateadd(mm,-2,@endFiscal))))  = 1 then convert(varchar(2),'0' + convert(varchar(2),datepart(Month,dateadd(mm,-2,@endFiscal))))  elseconvert(varchar(2),datepart(Month,dateadd(mm,-2,@endFiscal)))end set @month11  =convert(varchar(4),datepart(Year,@endFiscal)) + case when len(convert(varchar(2),datepart(Month,dateadd(mm,-1,@endFiscal))))  = 1 then convert(varchar(2),'0' + convert(varchar(2),datepart(Month,dateadd(mm,-1,@endFiscal))))  elseconvert(varchar(2),datepart(Month,dateadd(mm,-1,@endFiscal)))end
set @month12  =convert(varchar(4),datepart(Year,@endFiscal)) + case when len(convert(varchar(2),datepart(Month,dateadd(mm,0,@endFiscal))))  = 1 then convert(varchar(2),'0' + convert(varchar(2),datepart(Month,dateadd(mm, 0,@endFiscal))))  elseconvert(varchar(2),datepart(Month,dateadd(mm,0,@endFiscal)))end
When this code is run, the following results are obtained.
运行此代码时,将获得以下结果。
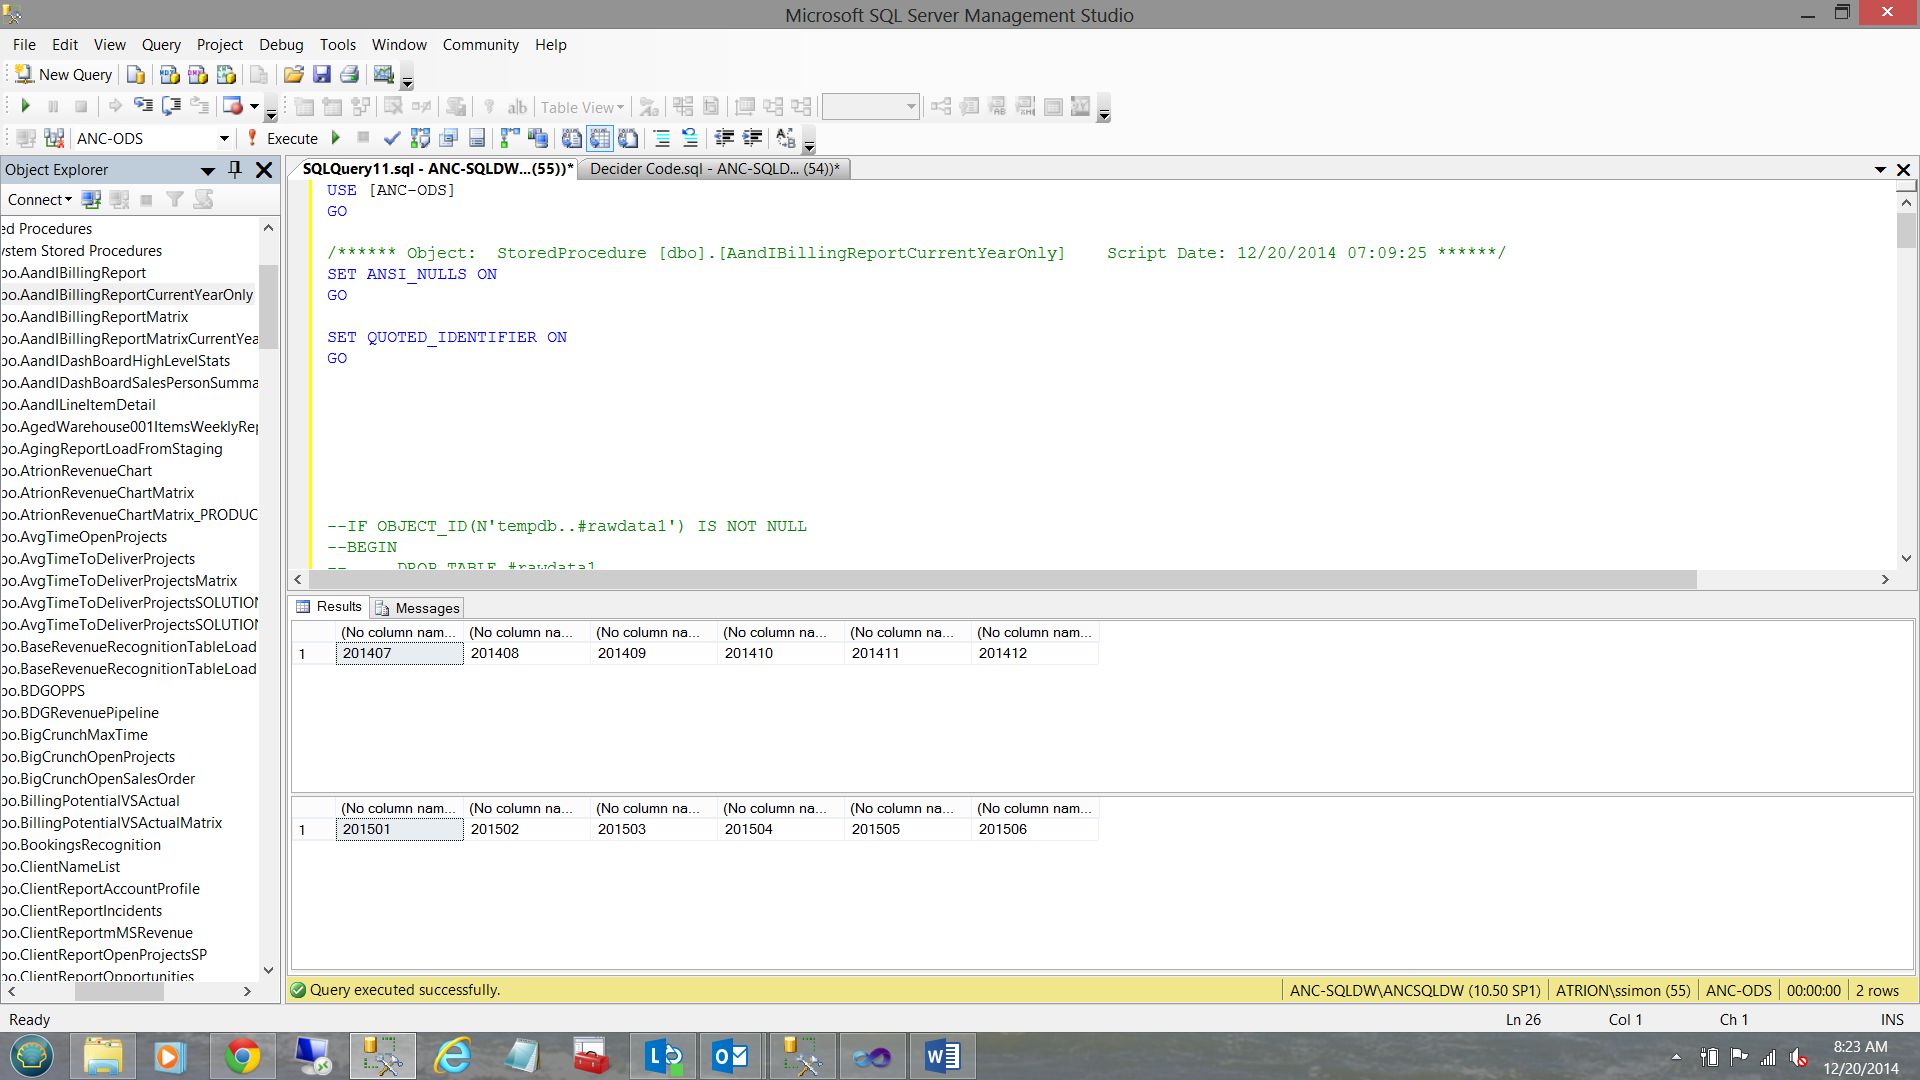
Now SQLShack management does not wish to have their reports showing the monthly sales as having come from 201407 etc. What they wish to see may be seen within the table below:
现在,SQLShack管理层不希望其报告显示每月销售额来自201407等。他们希望看到的内容可以在下表中看到:
| What we now have | What we want |
| 201407 | Jul |
| 201408 | Aug |
| 201409 | Sep |
| 我们现在拥有的 | 我们想要什么 |
| 201407 | 七月 |
| 201408 | 八月 |
| 201409 | 九月 |
This may be achieved in the following manner.
这可以通过以下方式实现。
 Select Revenue, YearMth,
Case when right(Yearmth,2) = ‘07’ then ‘Jul’when right(Yearmth,2) = ‘08’ then ‘Aug’when right(Yearmth,2) = ‘09’ then ‘Sep’when right(Yearmth,2) = ‘10’ then ‘Oct’when right(Yearmth,2) = ‘11’ then ‘Nov’when right(Yearmth,2) = ‘12’ then ‘Dec’when right(Yearmth,2) = ‘01’ then ‘Jan’when right(Yearmth,2) = ‘02’ then ‘Feb’when right(Yearmth,2) = ‘03’ then ‘Mar’when right(Yearmth,2) = ‘04’ then ‘Apr’when right(Yearmth,2) = ‘05’ then ‘May’when right(Yearmth,2) = ‘06’ then ‘Jun’
end as Monthee
from (
select
case when datepart(month,Invoicedate)   = 7  then @month01when datepart(month,Invoicedate)  = 8 then @month02when datepart(month,Invoicedate)  = 9 then @month03   when datepart(month,Invoicedate)  = 10 then @month04when datepart(month,Invoicedate)  = 11 then @month05   when datepart(month,Invoicedate)  = 12 then @month06when datepart(month,Invoicedate)  = 1 then @month07   when datepart(month,Invoicedate)  = 2 then @month08when datepart(month,Invoicedate)  = 3 then @month09   when datepart(month,Invoicedate) =  4 then @month10when datepart(month,Invoicedate) = 5 then @month11   when datepart(month,Invoicedate) = 6 then @month12end as Yearmth, Revenue from SQLShackinvoicing)a
Having achieved all this, SQLShack Industries summarizes its data by team and month and places the data (via an overnight load process) into a SQL Server table used exclusively for reporting. The content of the table may be seen below:
完成所有这些操作后,SQLShack Industries会按团队和月份汇总其数据,并将数据(通过夜间加载过程)放入专门用于报告SQL Server表中。 该表的内容如下所示:
Our data is now in the desired format, so let us get back to what we started out to do and that was to create a report dashboard!!
现在我们的数据已采用所需的格式,因此让我们回到开始做的事情,那就是创建报告仪表板!
入门 (Getting Started)
We start by creating a new Reporting Services Project from SQL Server Data Tools. Should the reader be unfamiliar with this process, please do have a look at one of my earlier SQLShack articles such as “Now you see it, now you don’t”. The hyperlink to the article is
/now-see-now-dont/
我们首先从SQL Server数据工具创建一个新的Reporting Services项目。 如果读者不熟悉此过程,请阅读我以前的SQLShack文章之一,例如“现在您看到了,现在您不知道了”。 文章的超链接是
/ now-see-now-dont /
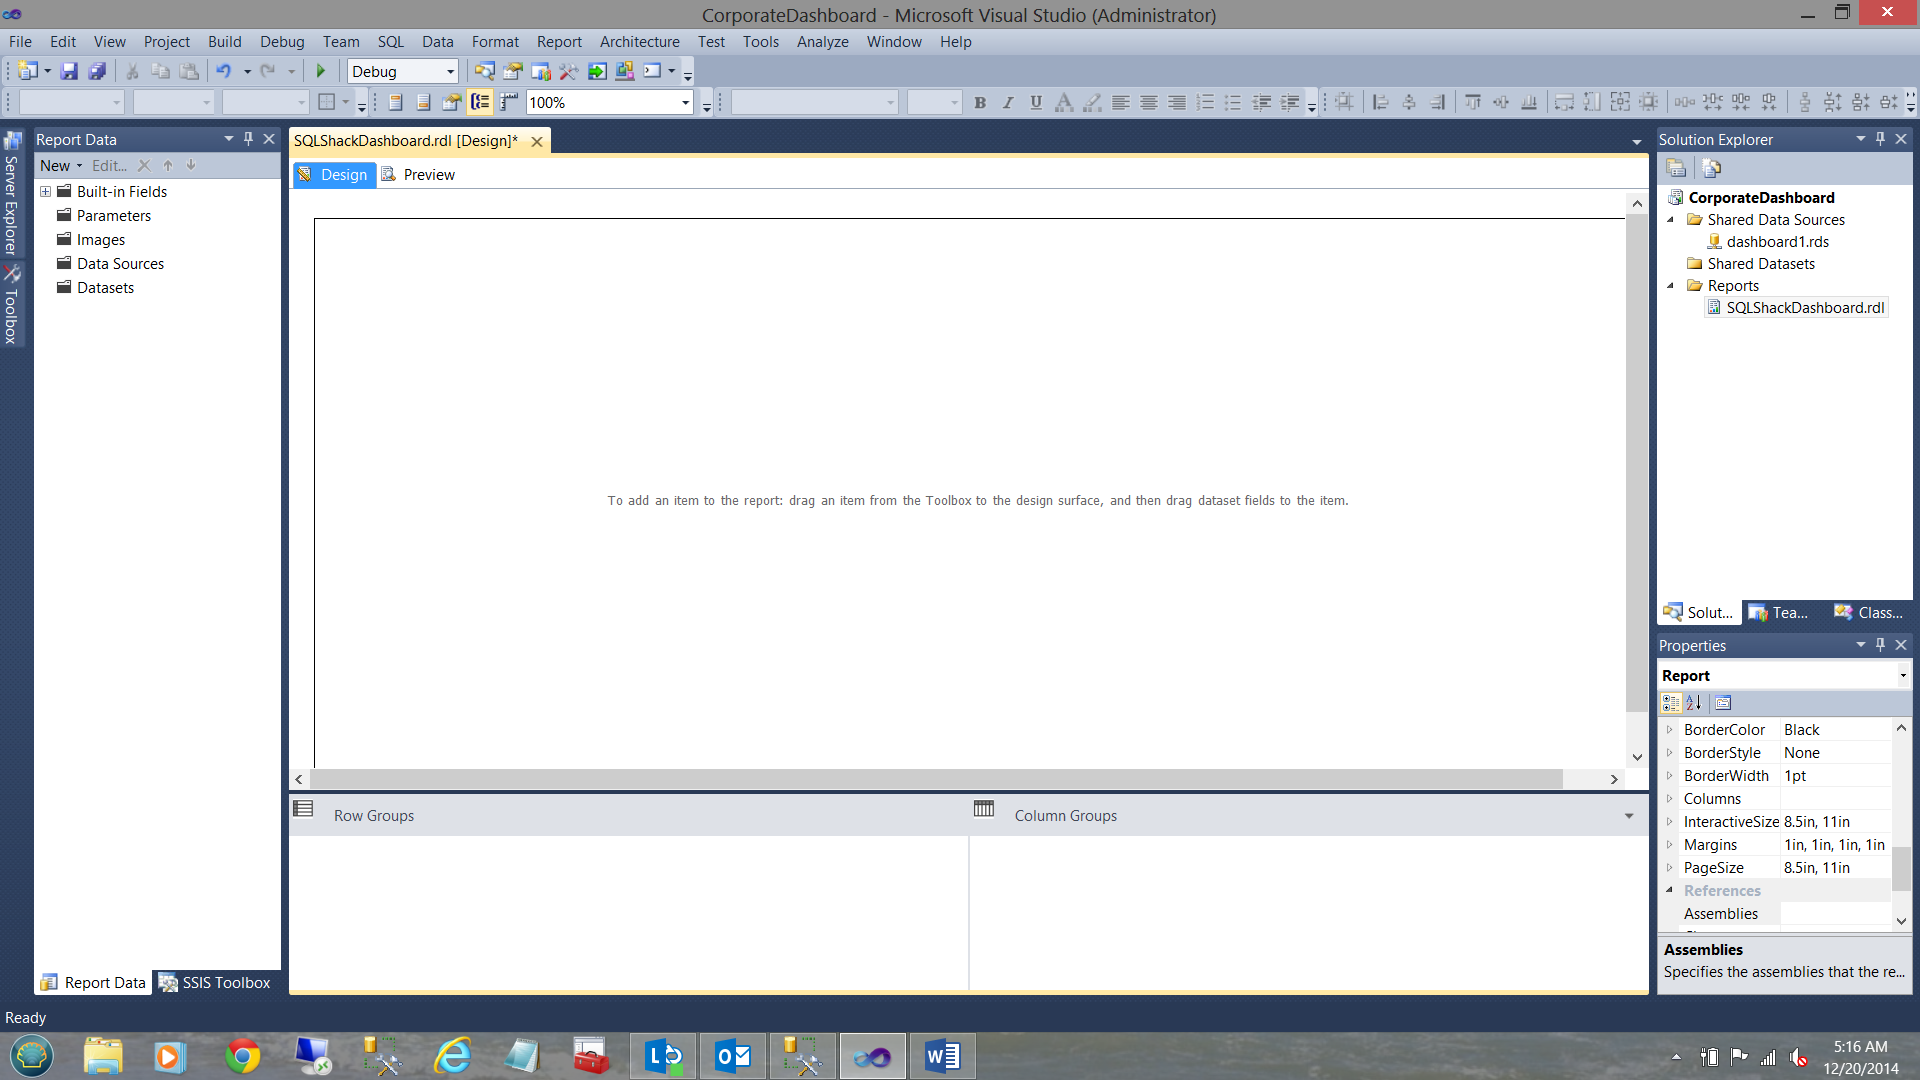
We right click on the “Reports” folder, select add and then “New Item”.
我们右键单击“ Reports”文件夹,选择“ Add”,然后选择“ New Item”。
We choose “Report” and give our report a name. We then click “Add”. We now find ourselves returned to our work surface.
我们选择“报告”并给我们的报告起一个名字。 然后,我们单击“添加”。 现在,我们发现自己回到了工作现场。
Our first task is to create our first line graph/line chart report. We begin by creating a dataset with the monthly sales figures from our SQLShack Industries financial database. Should you be uncertain on how to create a dataset please do have a look at an earlier article that I created entitled “Now you see it, now you don’t” where I take you through the creation of a data source and datasets in great detail. The link to this article may be seen below:
/now-see-now-dont/
我们的首要任务是创建我们的第一个折线图/折线图报告。 我们首先使用来自SQLShack Industries财务数据库的每月销售数据创建一个数据集。 如果您不确定如何创建数据集,请看一下我创建的较早的文章“现在您看到了,现在您不知道了”,在这篇文章中,我将带您深入了解如何创建数据源和数据集详情。 可以在下面看到本文的链接:
/ now-see-now-dont /
I now create my dataset “SalesComparisons”, embedding the dataset within my report:
现在,我创建数据集“ SalesComparisons”,将数据集嵌入到报表中:
In the “Data source” drop down I create a new local “Data source”. Once again and as discussed above, should you be uncertain of how this is done, please do have a look at the link above where the process is described in detail.
在“数据源”下拉列表中,我创建一个新的本地“数据源”。 再次如上所述,如果您不确定如何完成此操作,请查看上面详细描述了该过程的链接。
I click OK to return to the “Dataset Properties” window.
我单击“确定”返回“数据集属性”窗口。
As this first report is fairly simple, my query type will be a text statement:
由于第一个报告非常简单,因此我的查询类型将为文本语句:
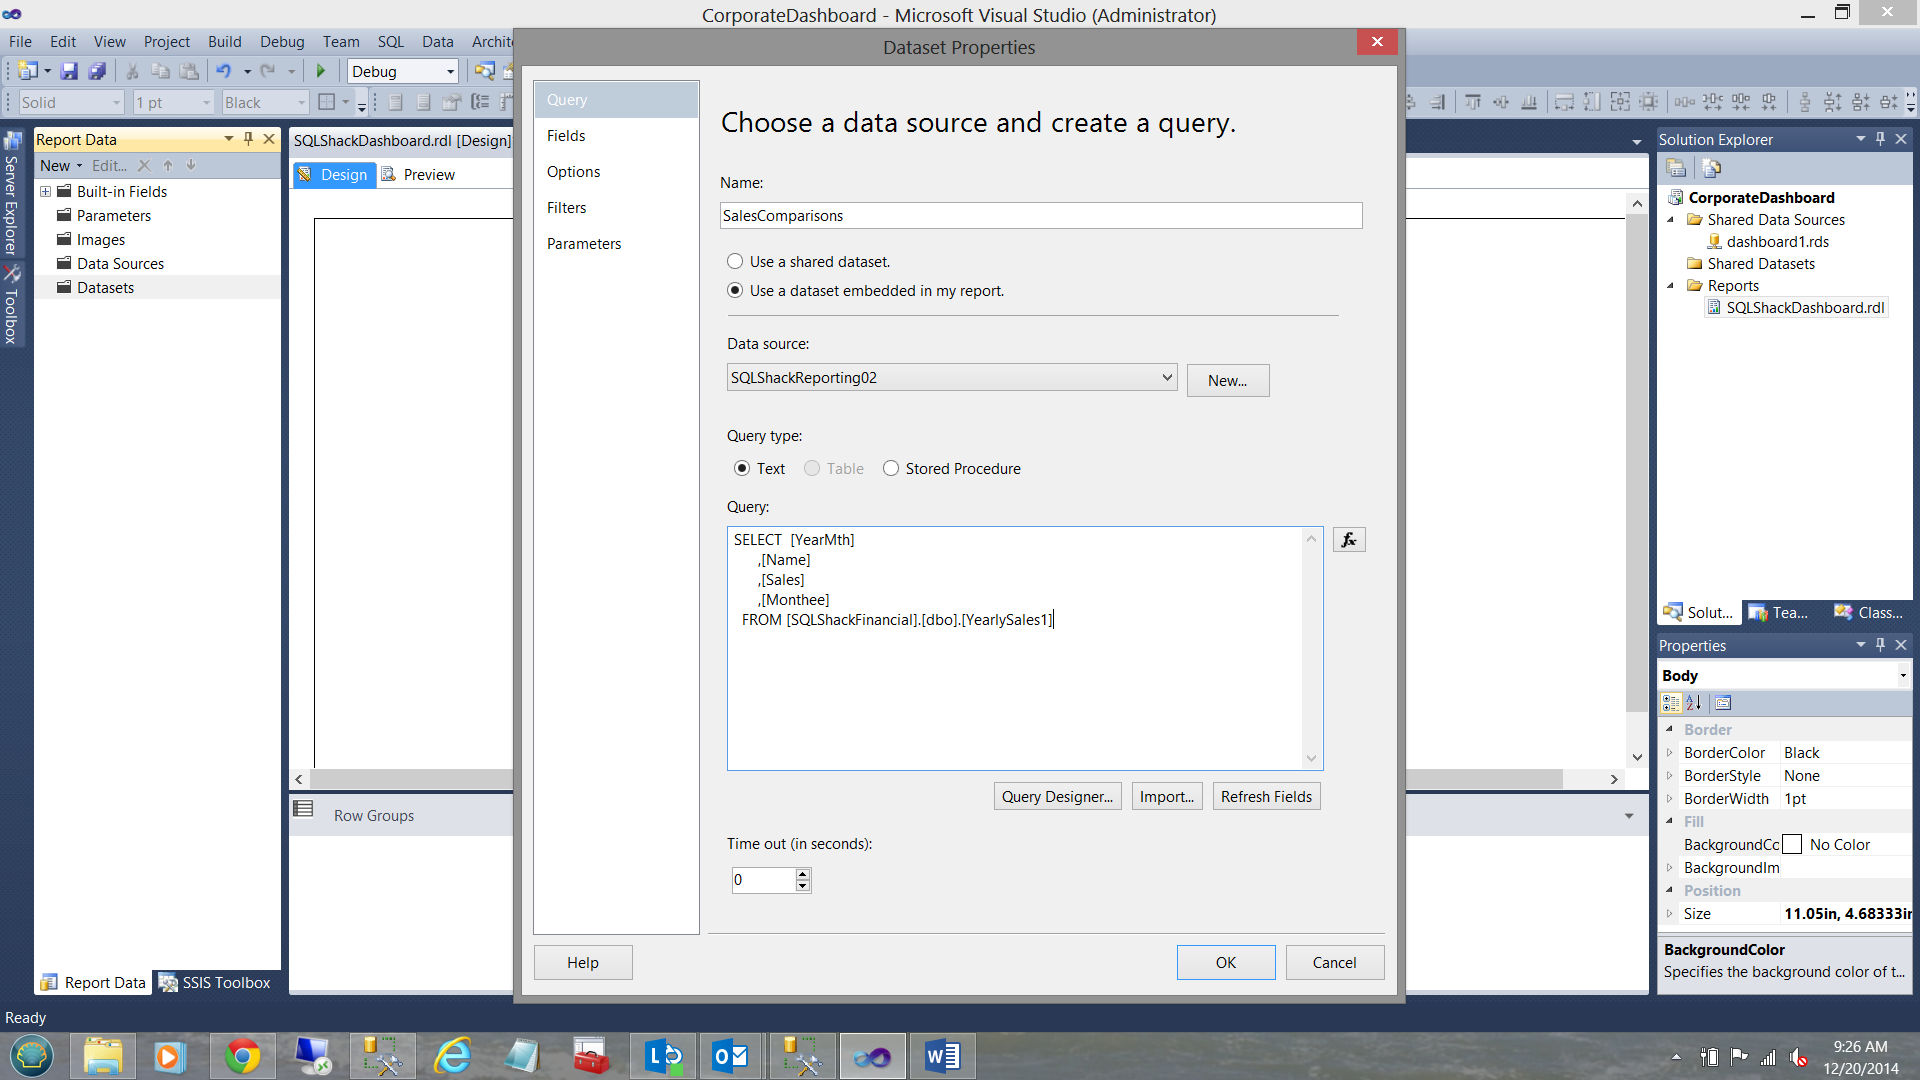
Above, we see the query for our first dataset. I click “Refresh Fields” and then check under the “Fields” tab (upper left in the screen dump above) to verify that the required fields have been successfully added to the dataset.
在上方,我们看到了第一个数据集的查询。 我单击“刷新字段”,然后在“字段”选项卡下(在上方屏幕转储的左上方)进行检查,以验证必填字段已成功添加到数据集中。
创建报告编号1 (Creating Report Number 1)
Report number 1 will be a simple line graph to show the sales for SQLShack Industries teams for the current fiscal year.
1号报告将是一个简单的折线图,以显示SQLShack Industries团队在当前会计年度的销售额。
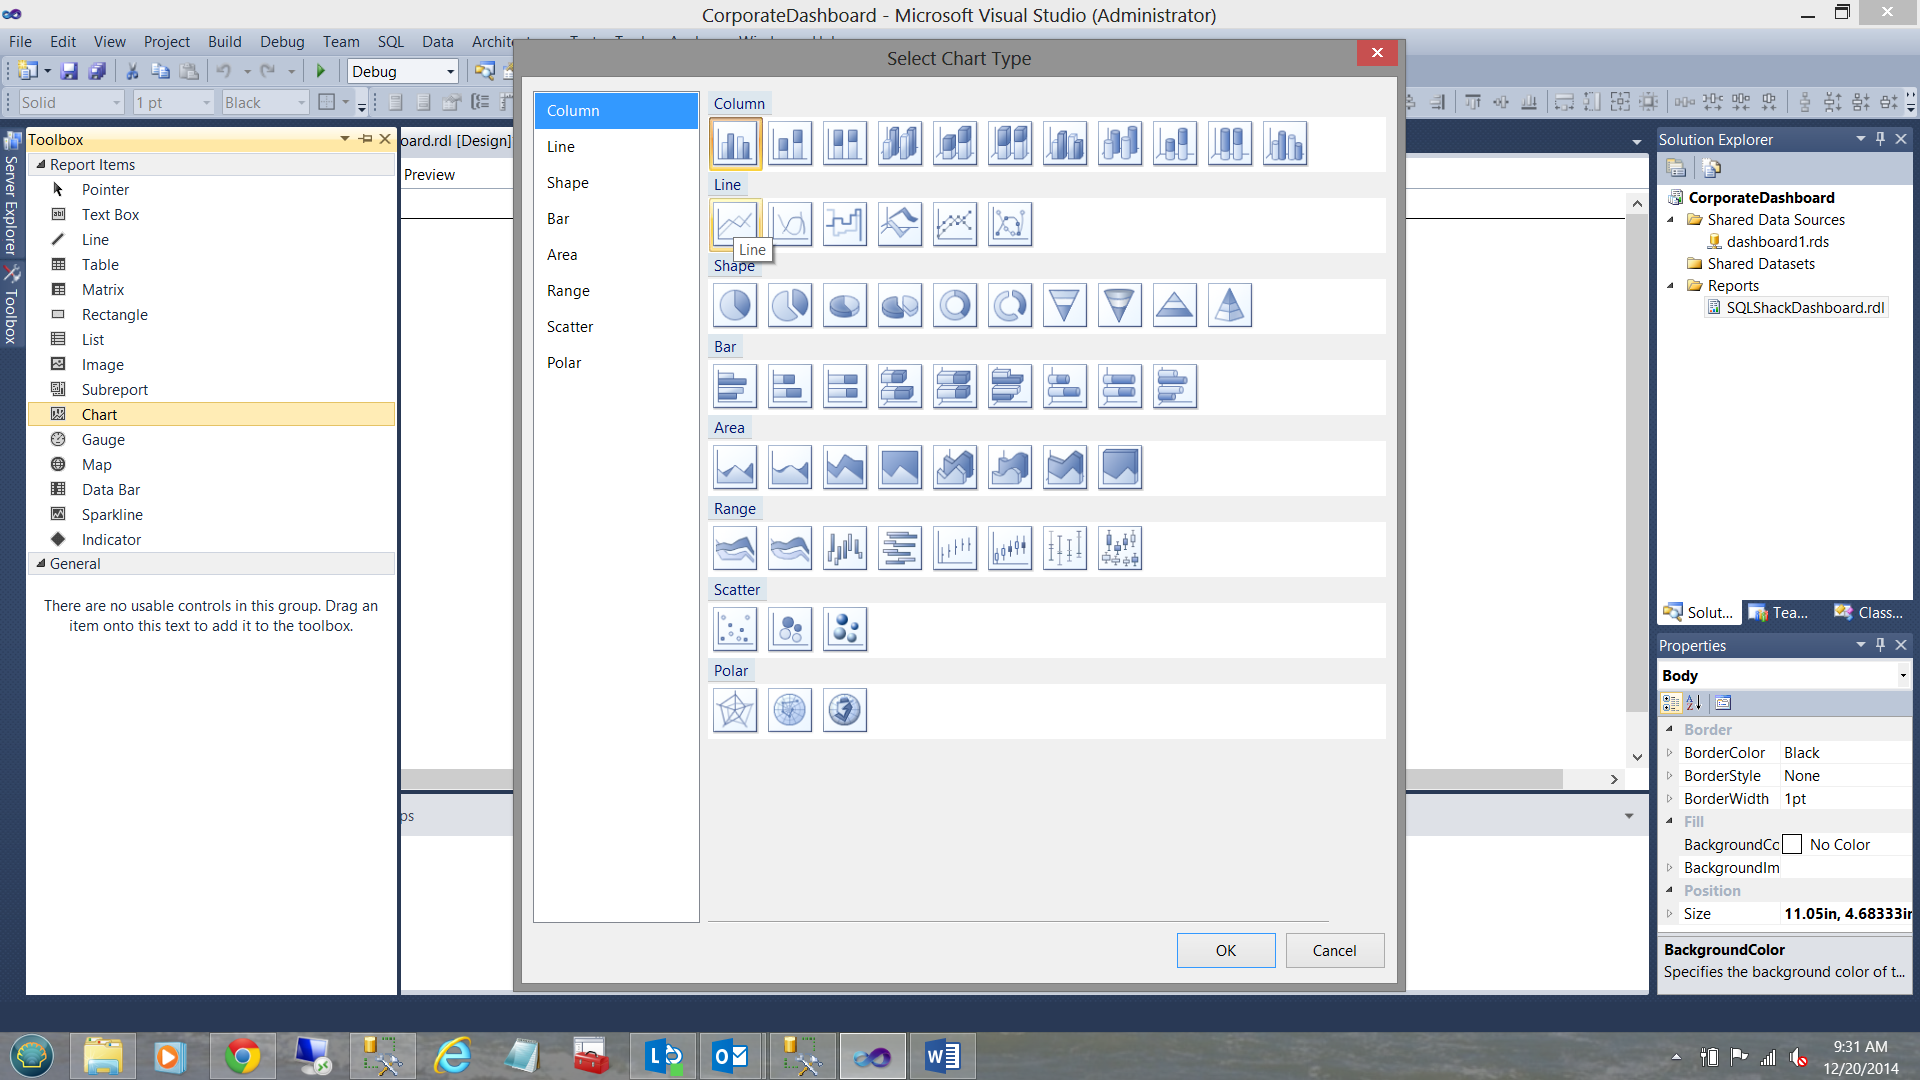
We ‘drag’ a line chart on to our working surface (see below).
我们将折线图拖到工作面上(见下文)。
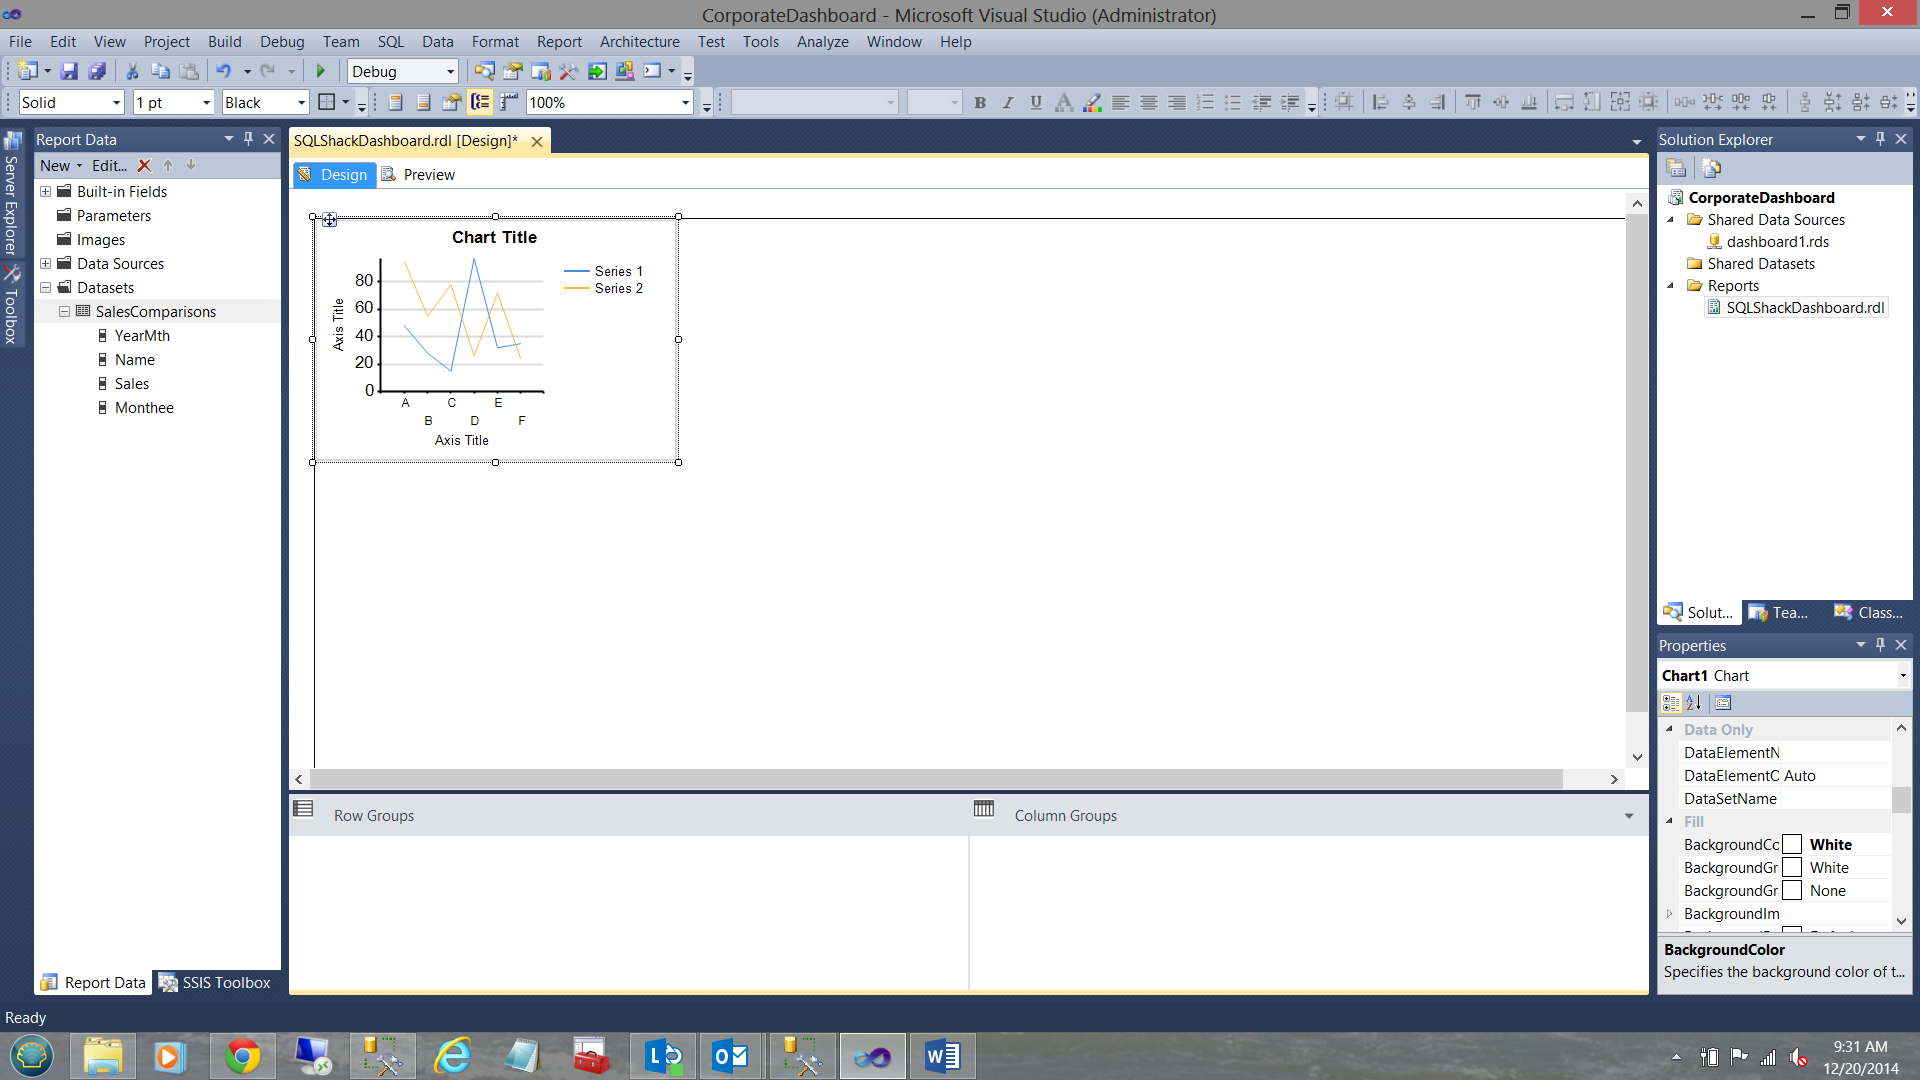
The chart knows nothing of the dataset that we just created, thus we must assign our dataset to the line chart (see below and to the bottom right).
图表对我们刚刚创建的数据集一无所知,因此我们必须将数据集分配给折线图(请参见下面和右下角)。
We are finally in a position to configure our chart.
我们终于可以配置图表了。
Note that the “Sigma” drop down is set to Sum(Sales) (see above).
请注意,“ Sigma”下拉菜单设置为Sum(Sales)(请参见上文)。
The “Category Groups” have been set to group upon “YearMth” and then to subgroup on “Monthee”. Finally the ‘Series Groups’ have been set to the “Name” field i.e. our Team1 and Team2.
已将“类别组”设置为按“年份”分组,然后按“ Monthee”分组。 最后,“系列组”已设置为“名称”字段,即我们的Team1和Team2。
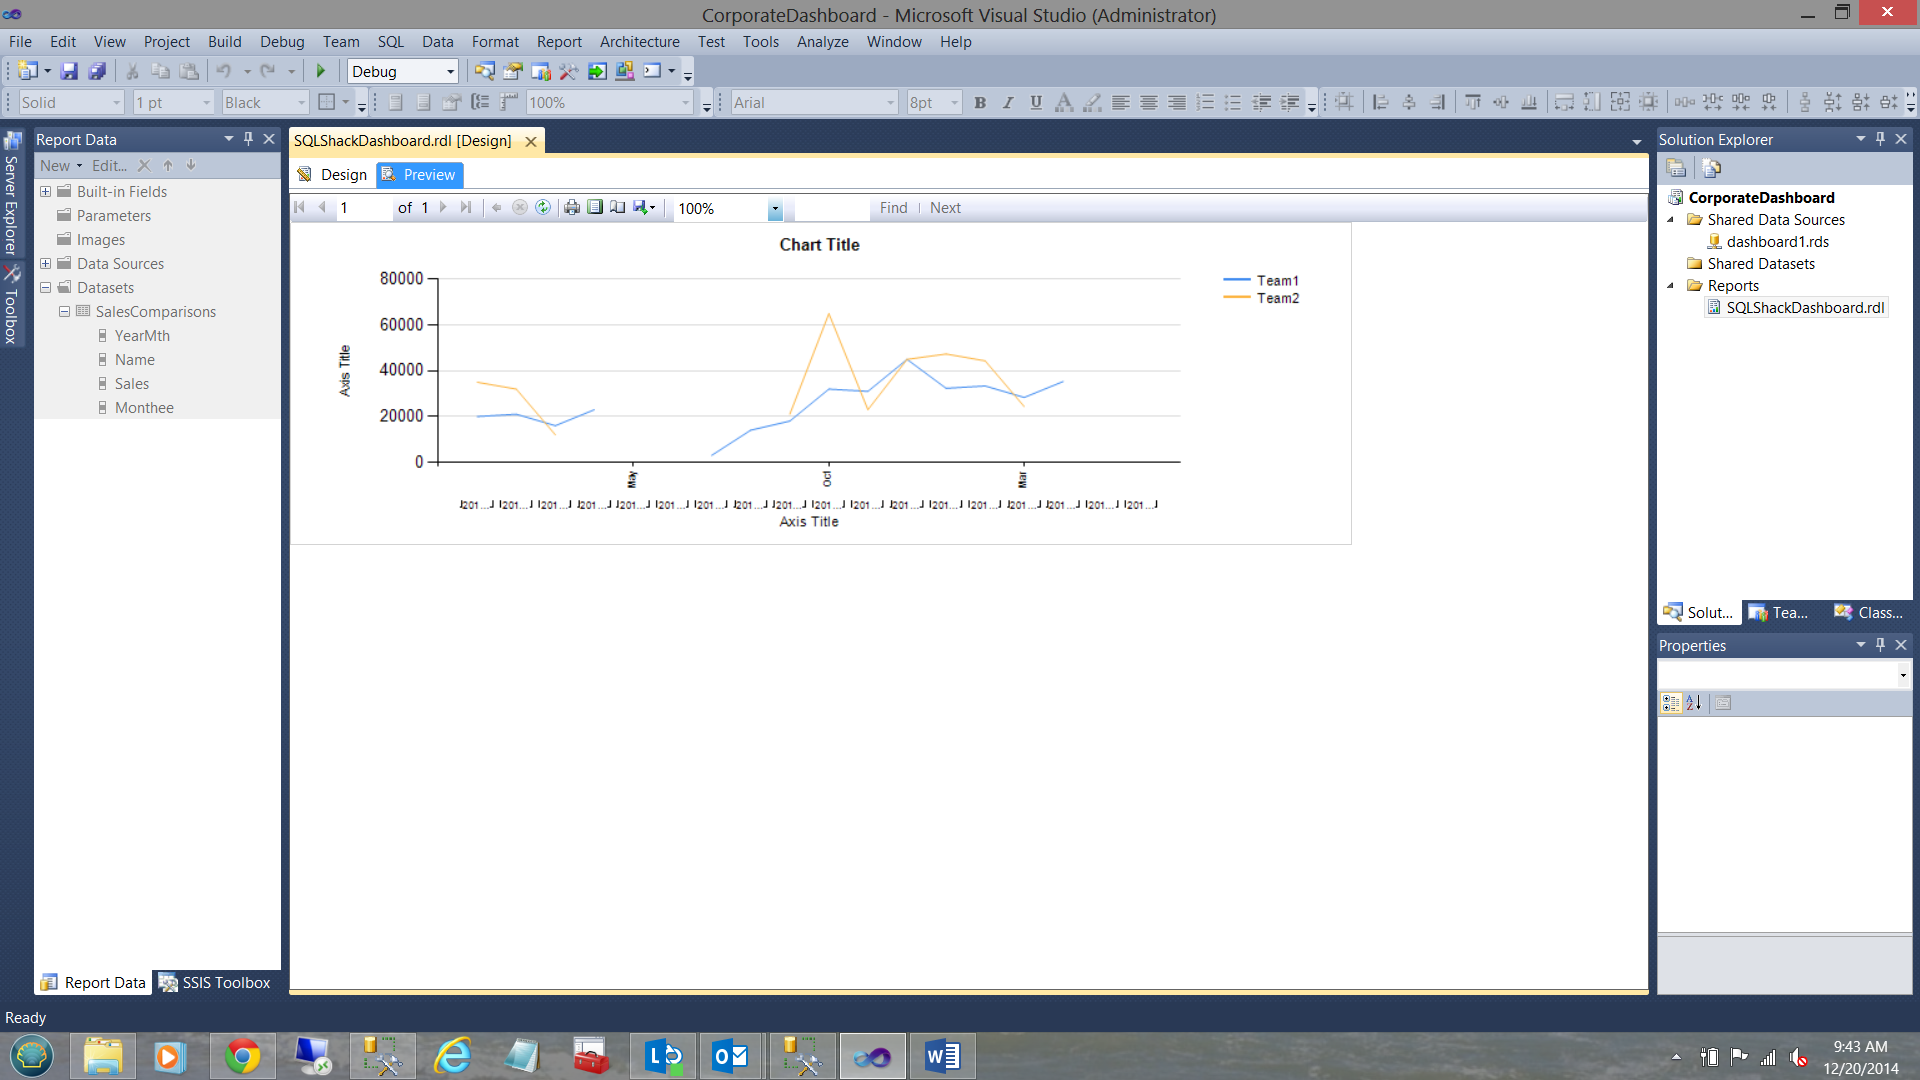
Our report looks similar to the one above. Note the “YearMth” ‘garbage’ immediately above the “Axis Title”. Remember the only reason that we are pulling the “YearMth” field is to ensure that the data is correctly sorted on the X axis.
我们的报告与上述报告相似。 注意“轴标题”正上方的“ YearMth”“垃圾”。 请记住,我们拉“ YearMth”字段的唯一原因是为了确保数据在X轴上正确排序。
Let us clean up this graph slightly.
让我们稍微整理一下这张图。
I right click on the “YearMth” Category group and bring up its properties box
我右键单击“ YearMth”类别组并显示其属性框
The “Category Groups” properties dialog box is shown (see below).
显示“类别组”属性对话框(请参见下文)。
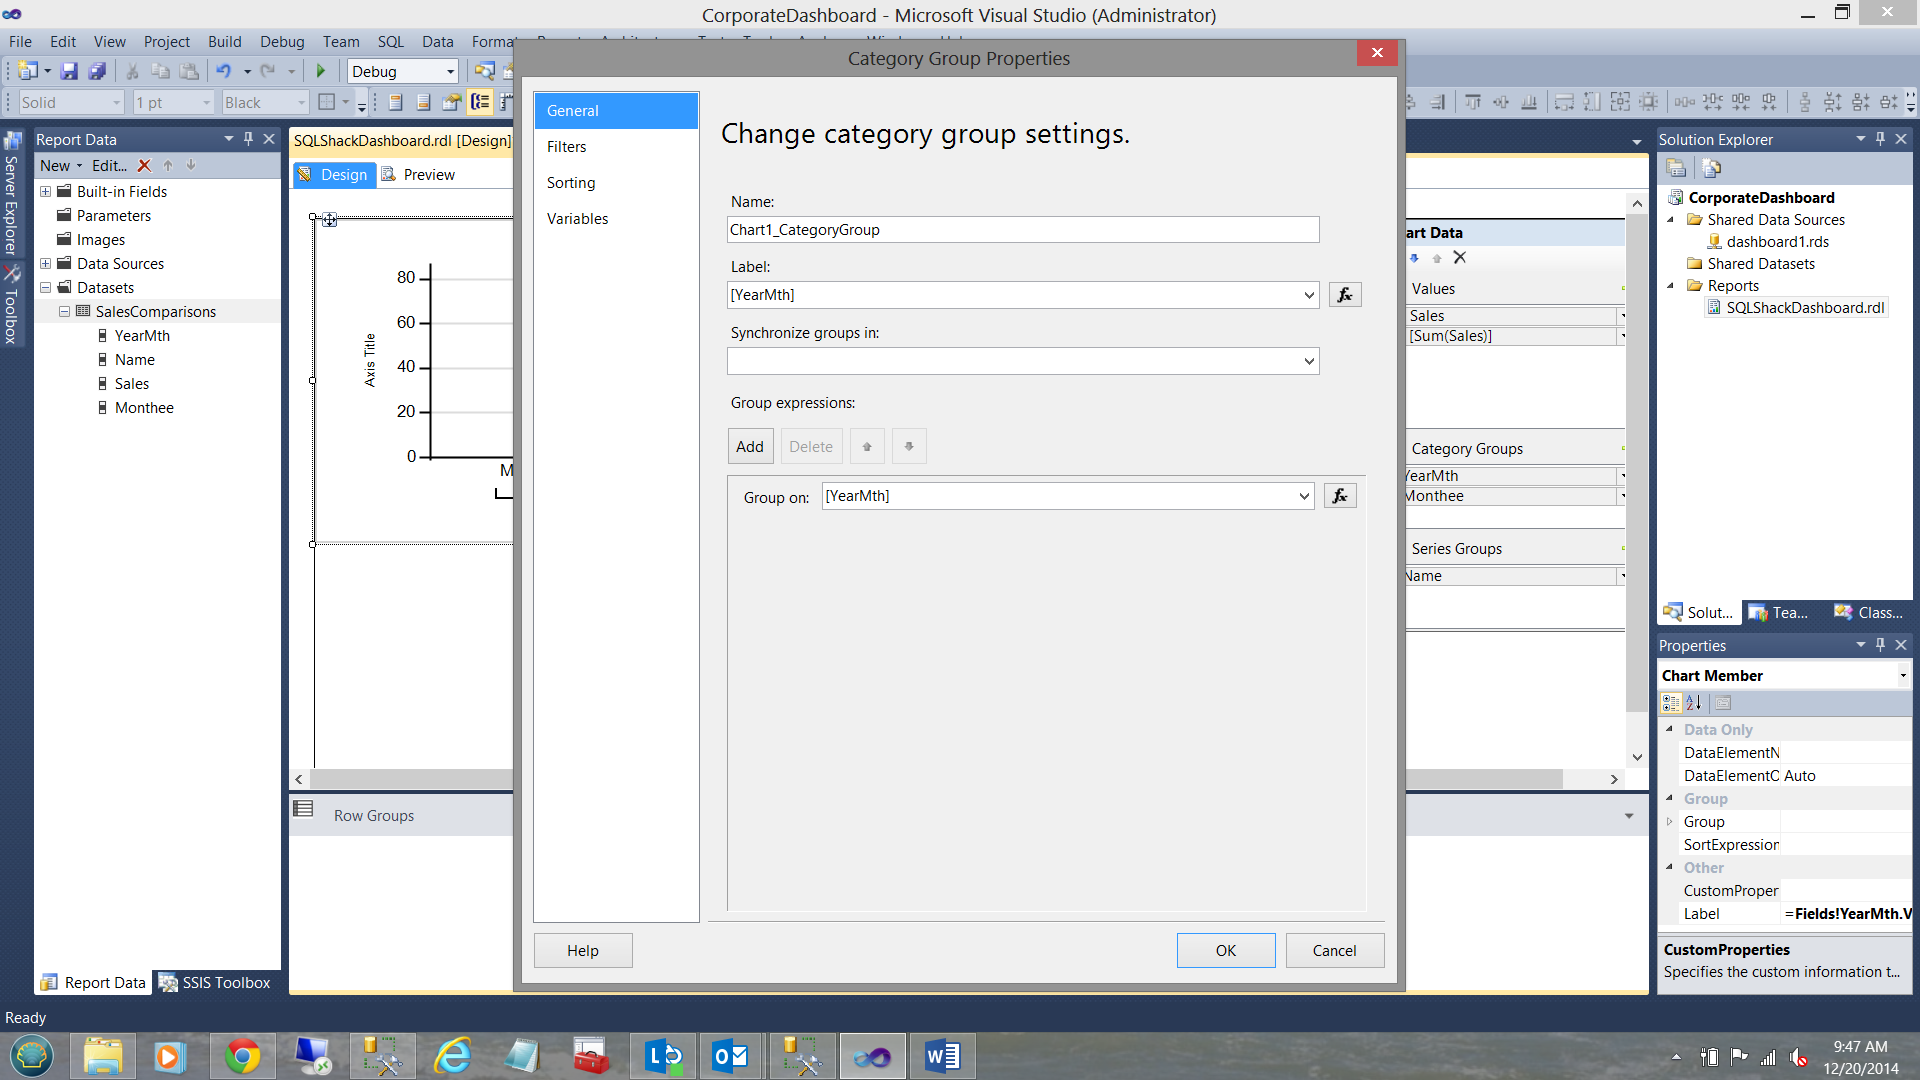
We open the “Label” function via the expression button and see the following:
我们通过表达式按钮打开“标签”功能,然后看到以下内容:
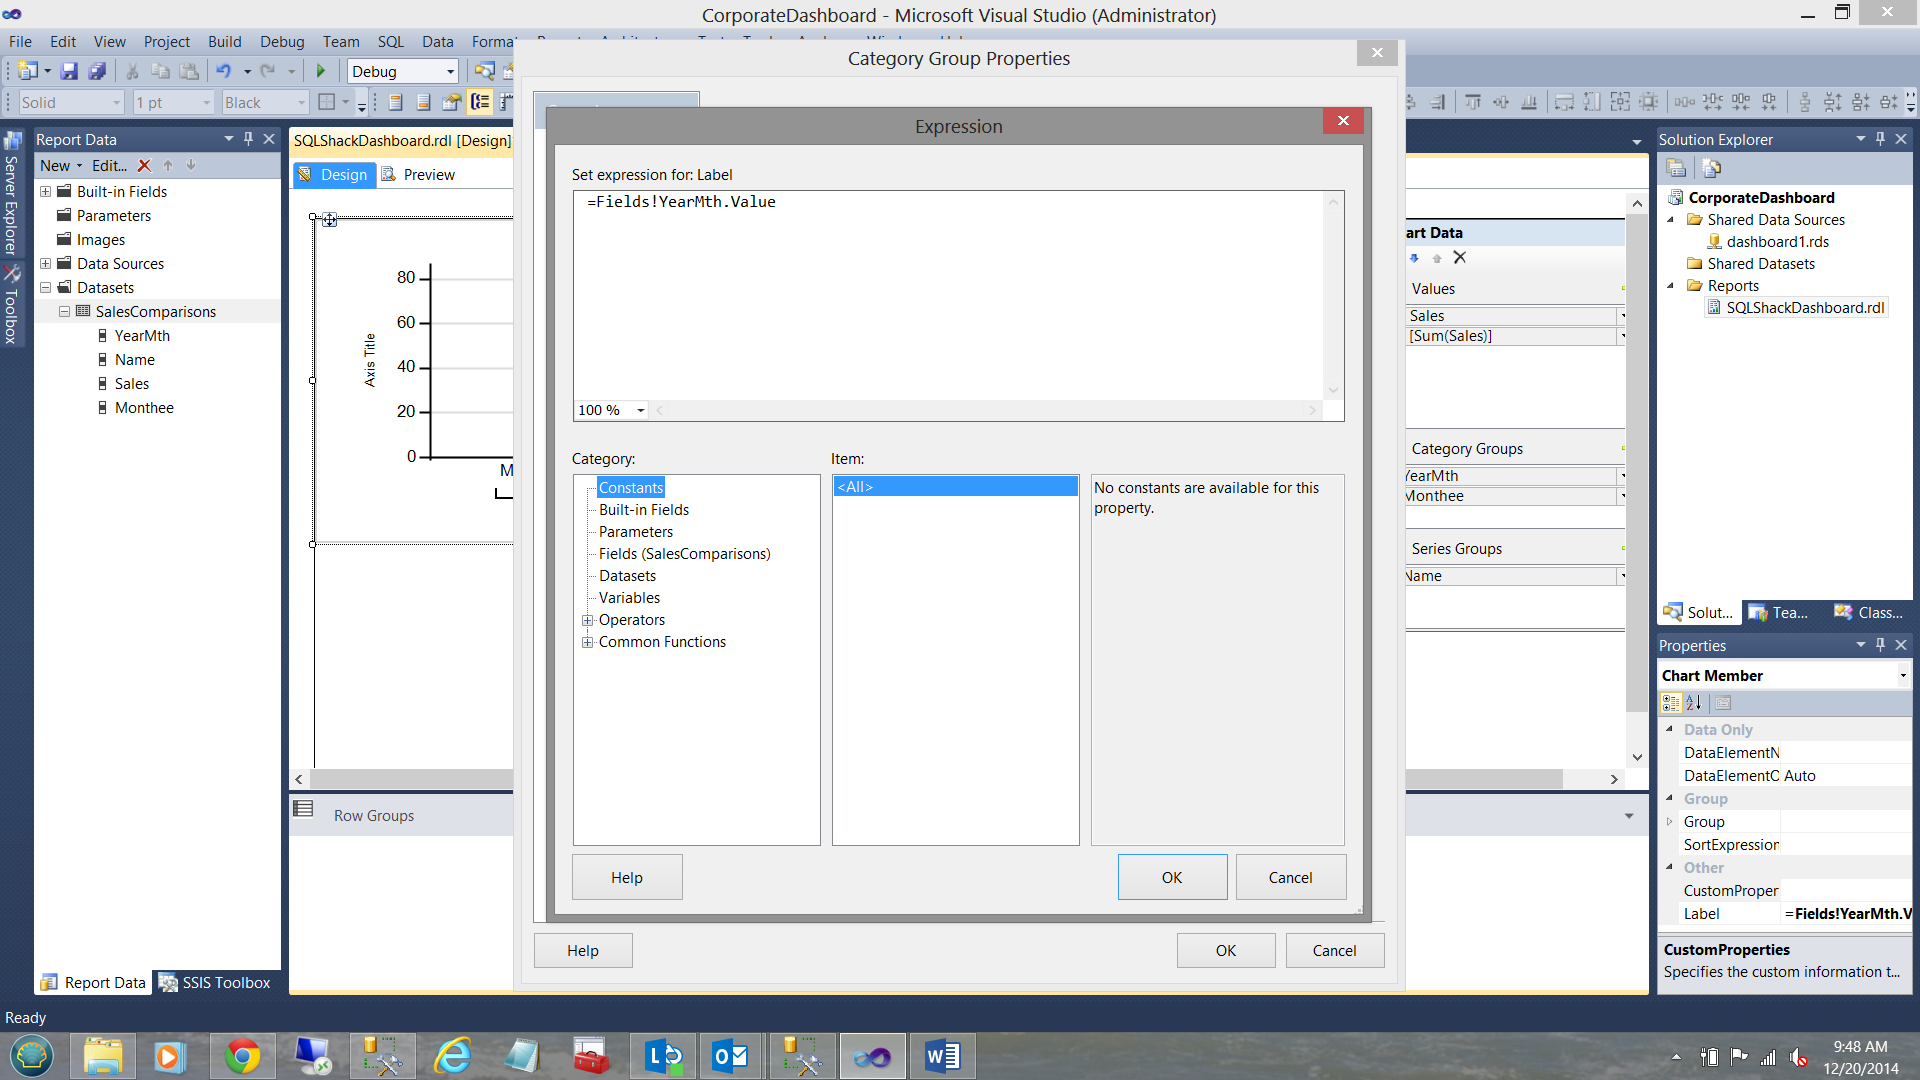
We change “=Fields!YearMth.Value” to “=Nothing” as may be seen below:
我们将“ = Fields!YearMth.Value”更改为“ = Nothing”,如下所示:
We click OK and OK to leave the “Category Group Properties” dialog box. Let us re-run our report.
我们单击确定,然后单击确定以离开“类别组属性”对话框。 让我们重新运行我们的报告。
Note the change of appearance of the report.
注意报告外观的变化。
Now comes the FUN!! Note that there is a hiatus in the line graphs/charts where there is no data (see above). It should be understood that while it appears that a portion of the lines are missing, they are not in fact missing.
现在来了有趣! 请注意,折线图/图中有一个中断,其中没有数据(请参见上文) 。 应该理解的是,尽管看起来部分行丢失了, 但实际上并没有丢失 。
When Reporting Services encounters missing data, it alters the line colour of this portion of the graph/chart to TRANSPARENT. It is this behavior that we are going to change. This requires the creation of a small function.
当Reporting Services遇到丢失的数据时,会将图表/图表此部分的线条颜色更改为TRANSPARENT。 我们将要改变的是这种行为。 这需要创建一个小的函数。
To begin the changes that we need to effect, we right click anywhere on the Report Surface BELOW the thick black horizontal line that we see in the screenshot above. We select “Report Properties”.
要开始需要执行的更改,请在上方屏幕截图中看到的黑色粗水平线下方的“报告表面”上的任意位置单击鼠标右键。 我们选择“报告属性”。
The “Report Properties” dialog box is brought into view (see above). We select the “Code” option (see below).
进入“报表属性”对话框(见上文)。 我们选择“代码”选项(见下文)。
We place the following code into the “Custom Code” dialogue box (see below the code snippet).
我们将以下代码放入“自定义代码”对话框中(请参见下面的代码片段)。
Private lineColour As String() = {"DarkBlue", "Khaki", "Orange", "Orange", "Gold", "Red", "Green", "LightBlue", "Lime", "Maroon", "LightSteelBlue", "Tan", "Silver"}
Private kount As Integer = 0
Private mapping As New System.Collections.Hashtable()Public Function GetColor(ByVal ColourCollection As String) As StringIf mapping.ContainsKey(ColourCollection) Then Return mapping(ColourCollection)End If
Dim c As String = lineColour(kount Mod lineColour.Length) kount = kount + 1
mapping.Add(ColourCollection, c) Return c
End Function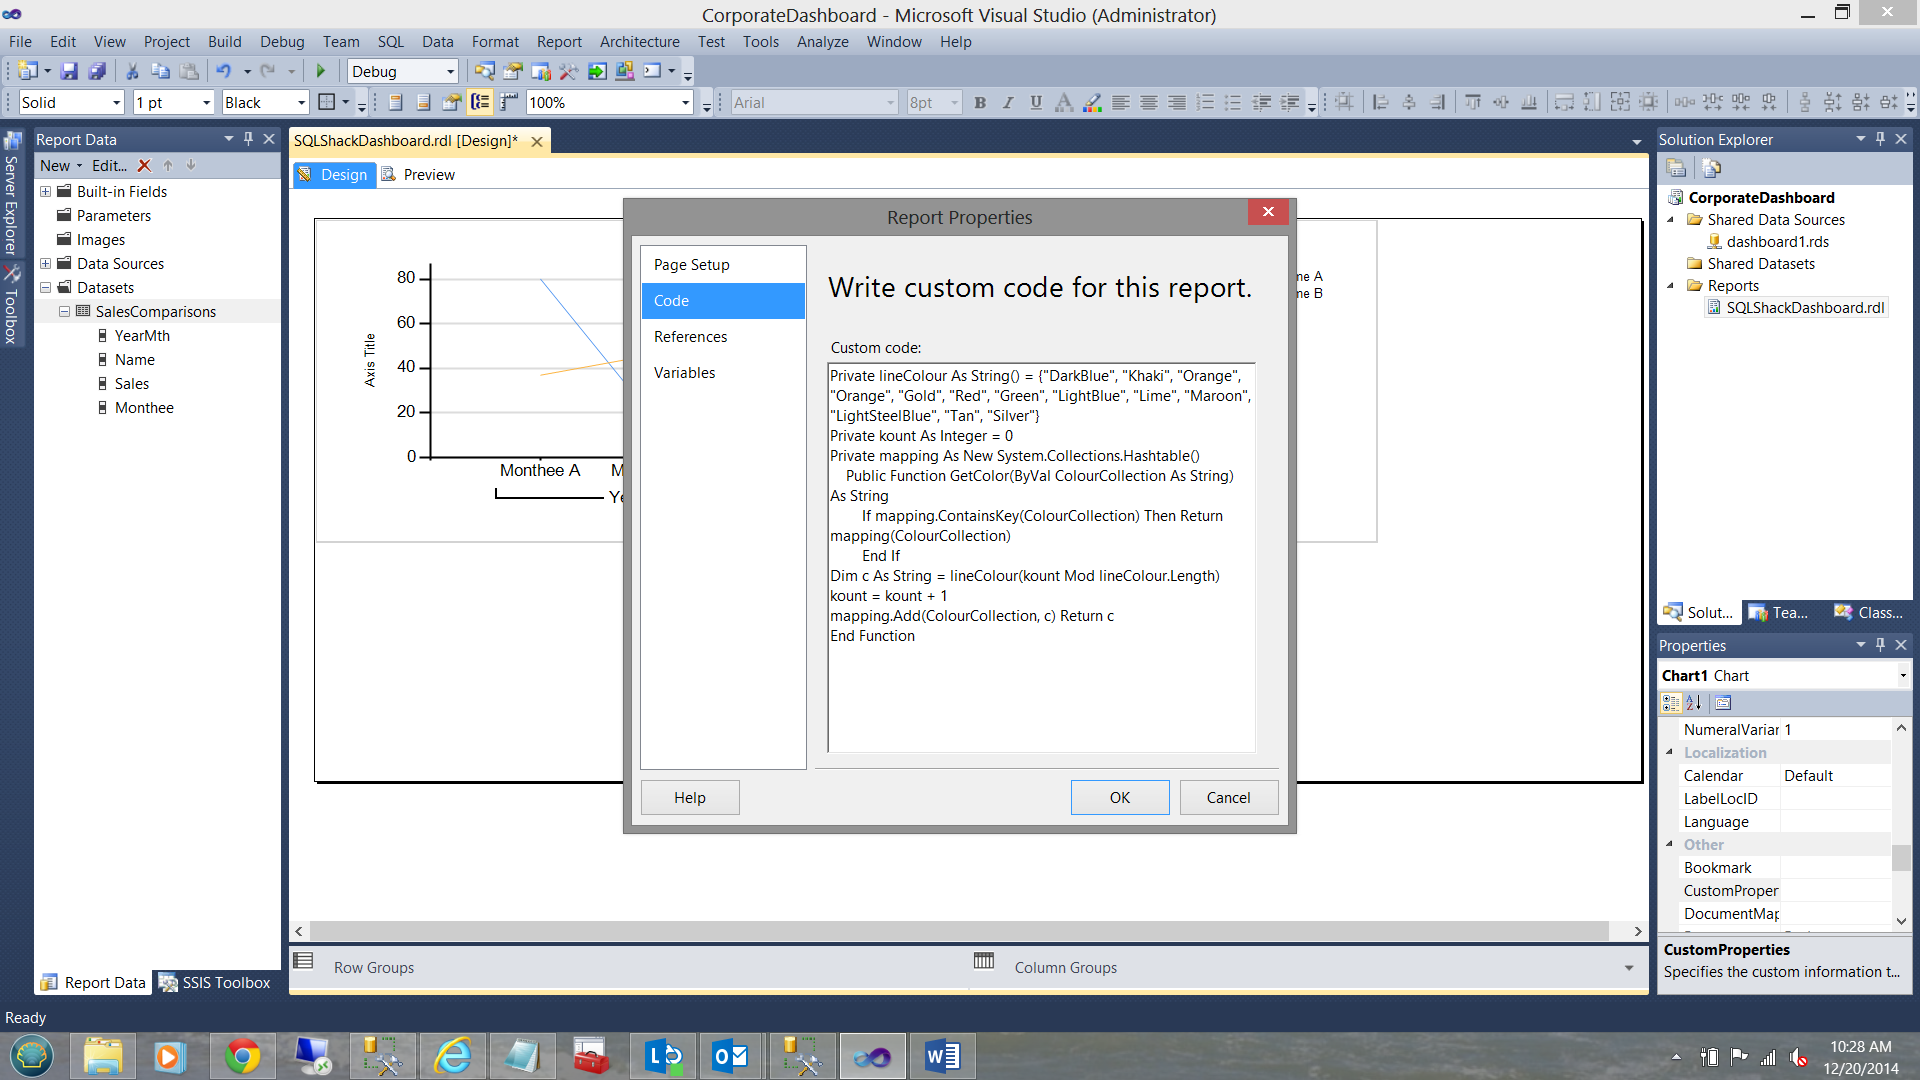
We are now almost complete.
我们现在快完成了。
We MUST now right click on the “Series Group” for Sales and select “Series Group Properties” (see below, bottom right).
现在,我们必须右键单击“系列组”以进行销售,然后选择“系列组属性”(请参见右下方)。
In the “Properties Box” at the bottom right, find the “EmptyPoint” property box (see the screen shot below).
在右下角的“属性框”中,找到“ EmptyPoint”属性框(请参见下面的屏幕截图)。
Under the “Color” property of the “EmptyPoint” property we call our GetColor function(see below).
在“ EmptyPoint”属性的“ Color”属性下,我们称为GetColor函数(见下文)。
Note the call to the function. “Code.GetColor(Fields!Name.Value)” (see above under Color).
请注意该函数的调用。 “ Code.GetColor(Fields!Name.Value)”(请参见上文“颜色”下的内容) 。
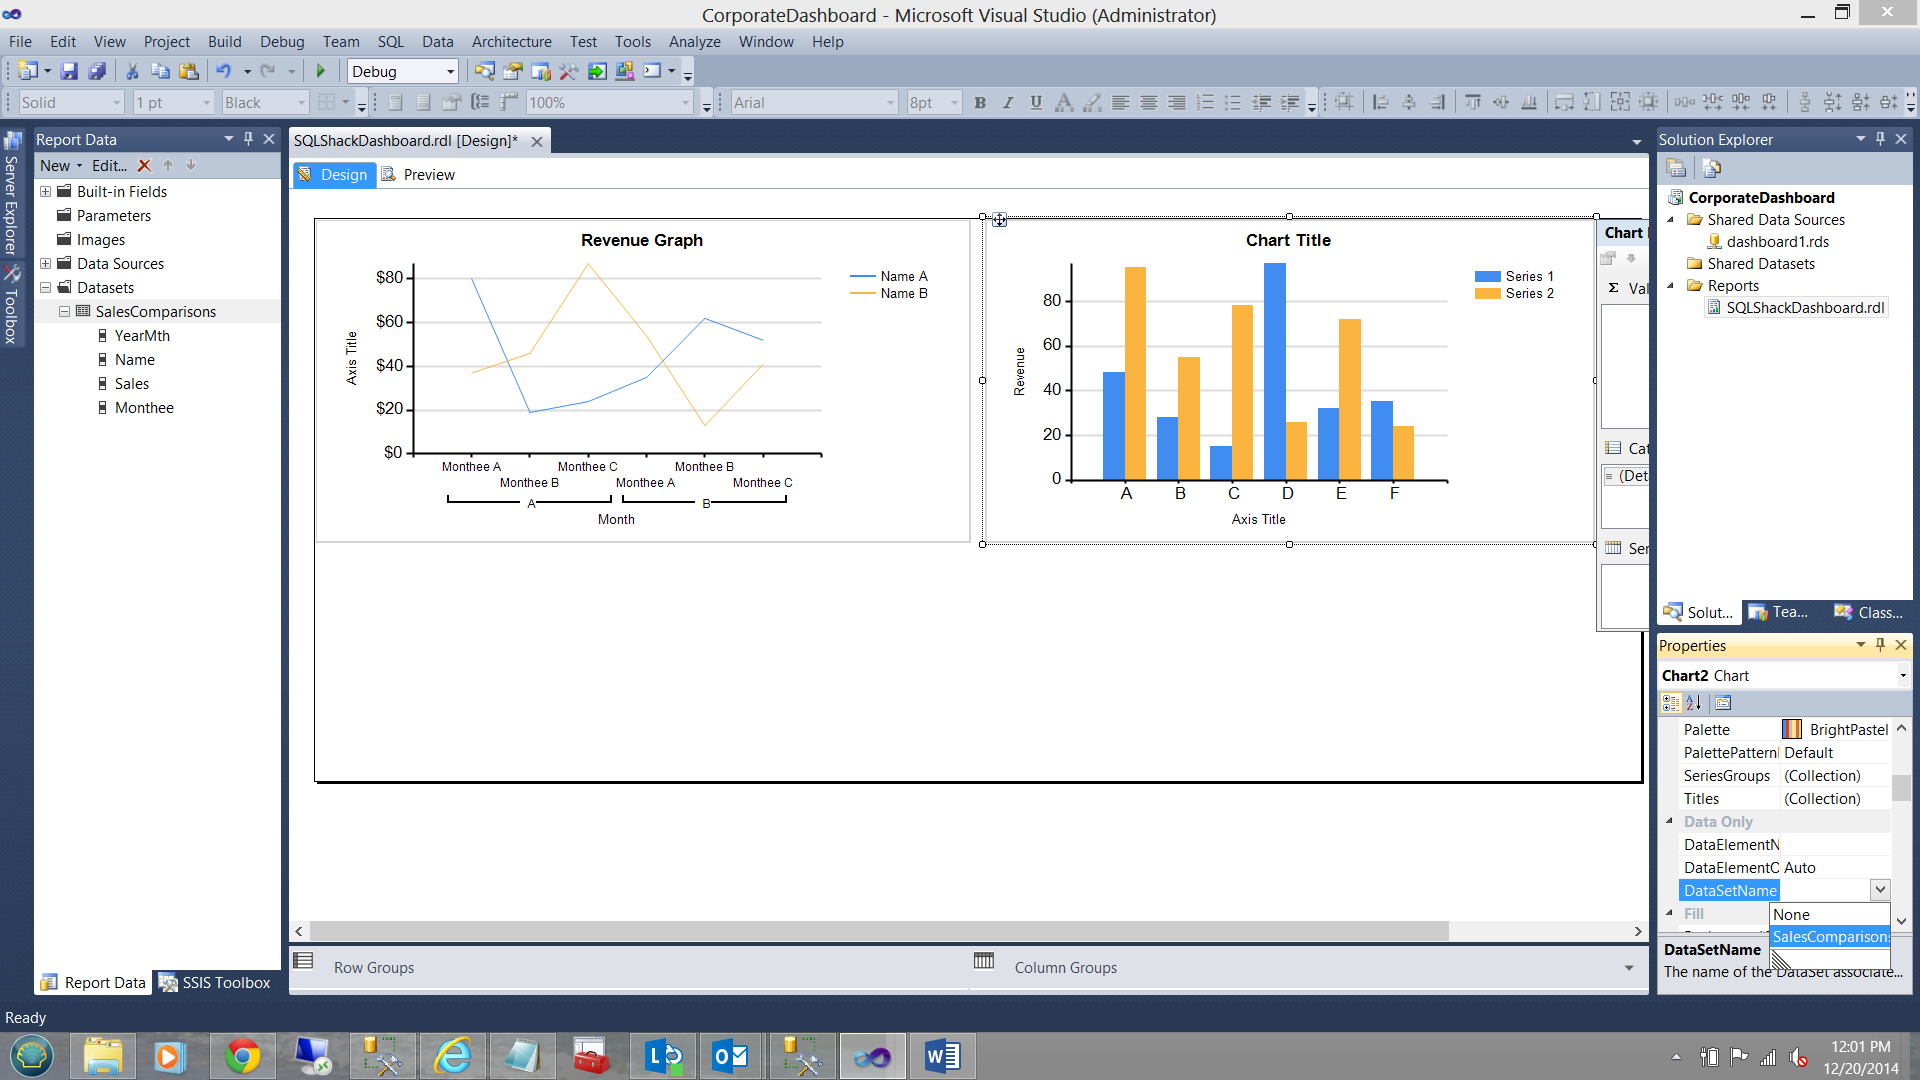
When we run our report again, we find the following.
当我们再次运行报告时,我们发现以下内容。
The lines are joined where the data was missing PLUS the whole graph has a more pleasing appearance.
这些线在缺少数据的地方连接在一起,而且整个图形的外观更加令人满意。
创建报告编号2 (Creating Report Number 2)
The folks at SQLShack Industries wish to examine the same data, however this time in chart format. Further, the colour of the vertical bars of the chart must reflect the sales income for the month.
SQLShack Industries的人们希望检查相同的数据,但是这次是以图表格式。 此外,图表垂直条的颜色必须反映该月的销售收入。
After having re-sized our first graph, we are now in a position to add a bar chart. I drag a bar chart (column chart) onto the work surface (see the next two screen dumps below).
在调整了第一张图的大小之后,我们现在可以添加条形图了。 我将条形图(柱状图)拖到工作面上(请参见下面的下两个屏幕转储)。

Note the vertical bar chart above. We now need to inform this bar chart that the data that it must utilize, may be found within the dataset that we created for the line chart (see the bottom right of the screen dump below).
注意上面的垂直条形图。 现在,我们需要通知该条形图,它必须利用的数据可以在我们为折线图创建的数据集中找到(请参见下面的屏幕转储的右下角)。
Once again I set up the chart properties in a similar fashion to the line graph/chart that we created in the section above. These properties may be seen in the screen dump below:
再次以与在上一节中创建的折线图/图表类似的方式设置图表属性。 这些属性可以在下面的屏幕转储中看到:
We rename and format the Y axis of our chart to reflect Sales (in dollar) and change the x axis to reflect the months under consideration (see below).
我们将图表的Y轴重命名并设置其格式以反映销售额(以美元为单位),并更改x轴以反映所考虑的月份(请参见下文)。
Let us give our report a whirl!
让我们旋转一下报告!
Note that the colour scheme of the chart reflects the team numbers and NOT the value of the sales revenue that was generated. This is what SQLShack Industries expected to see. Let us fix this now.
请注意,图表的颜色方案反映的是团队编号,而不是所产生的销售收入的价值。 这是SQLShack Industries期望看到的。 现在让我们解决此问题。
We right click on the blue vertical bars and select “Series Properties”
我们右键单击蓝色竖线,然后选择“系列属性”
The “Series Properties” dialog box opens (see above). We select the “Fill” tab. We then select the color expression tab (see below). The “Expressions” dialog box opens.
“系列属性”对话框打开(请参见上文)。 我们选择“填充”标签。 然后,我们选择颜色表达选项卡(见下文)。 “表达式”对话框打开。
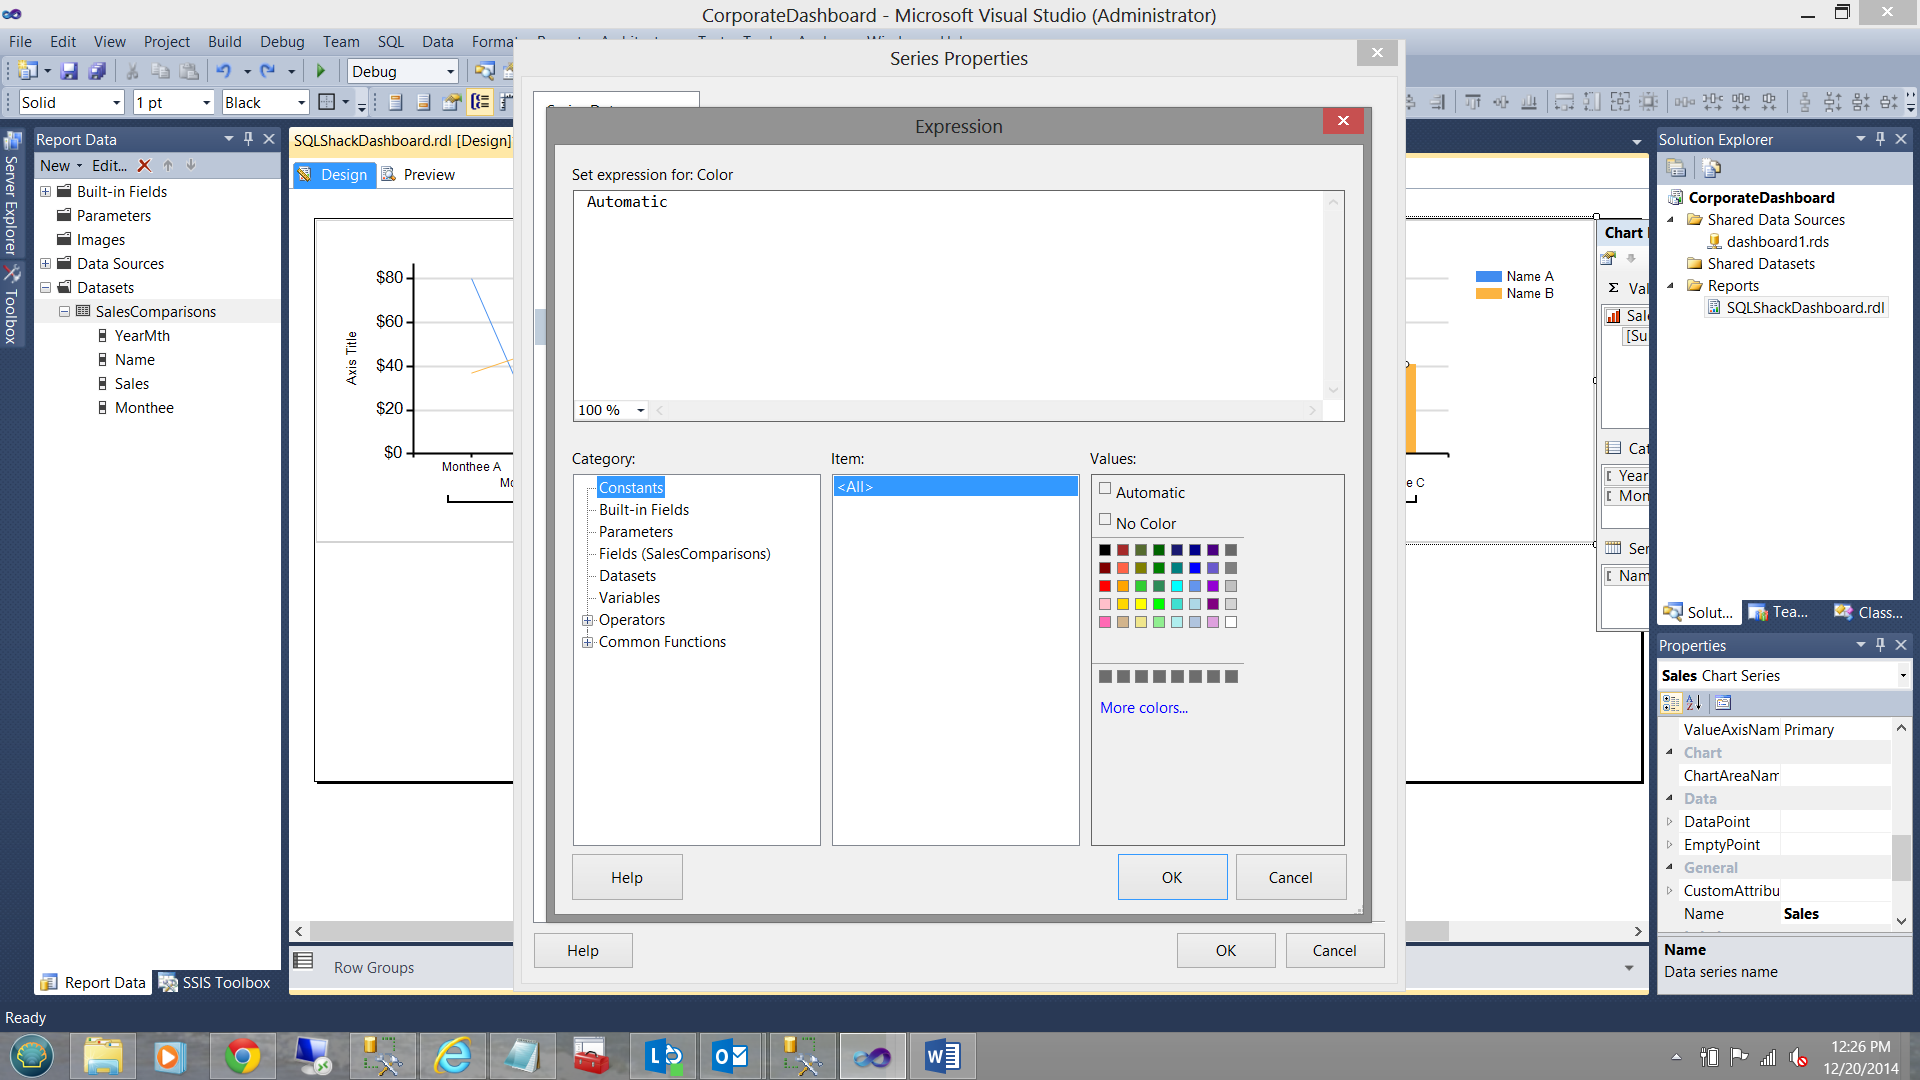
We remove the “Automatic” value and replace it with the following code:
我们删除“自动”值,并将其替换为以下代码:
=Switch (isnothing(Fields!Sales.Value) , "LightGrey",Fields!Sales.Value < 20000, "Red" ,Fields!Sales.Value >= 20000 and Fields!Sales.Value< 40000, "Yellow",Fields!Sales.Value >= 40000, "Green")Running our report again:
再次运行我们的报告:
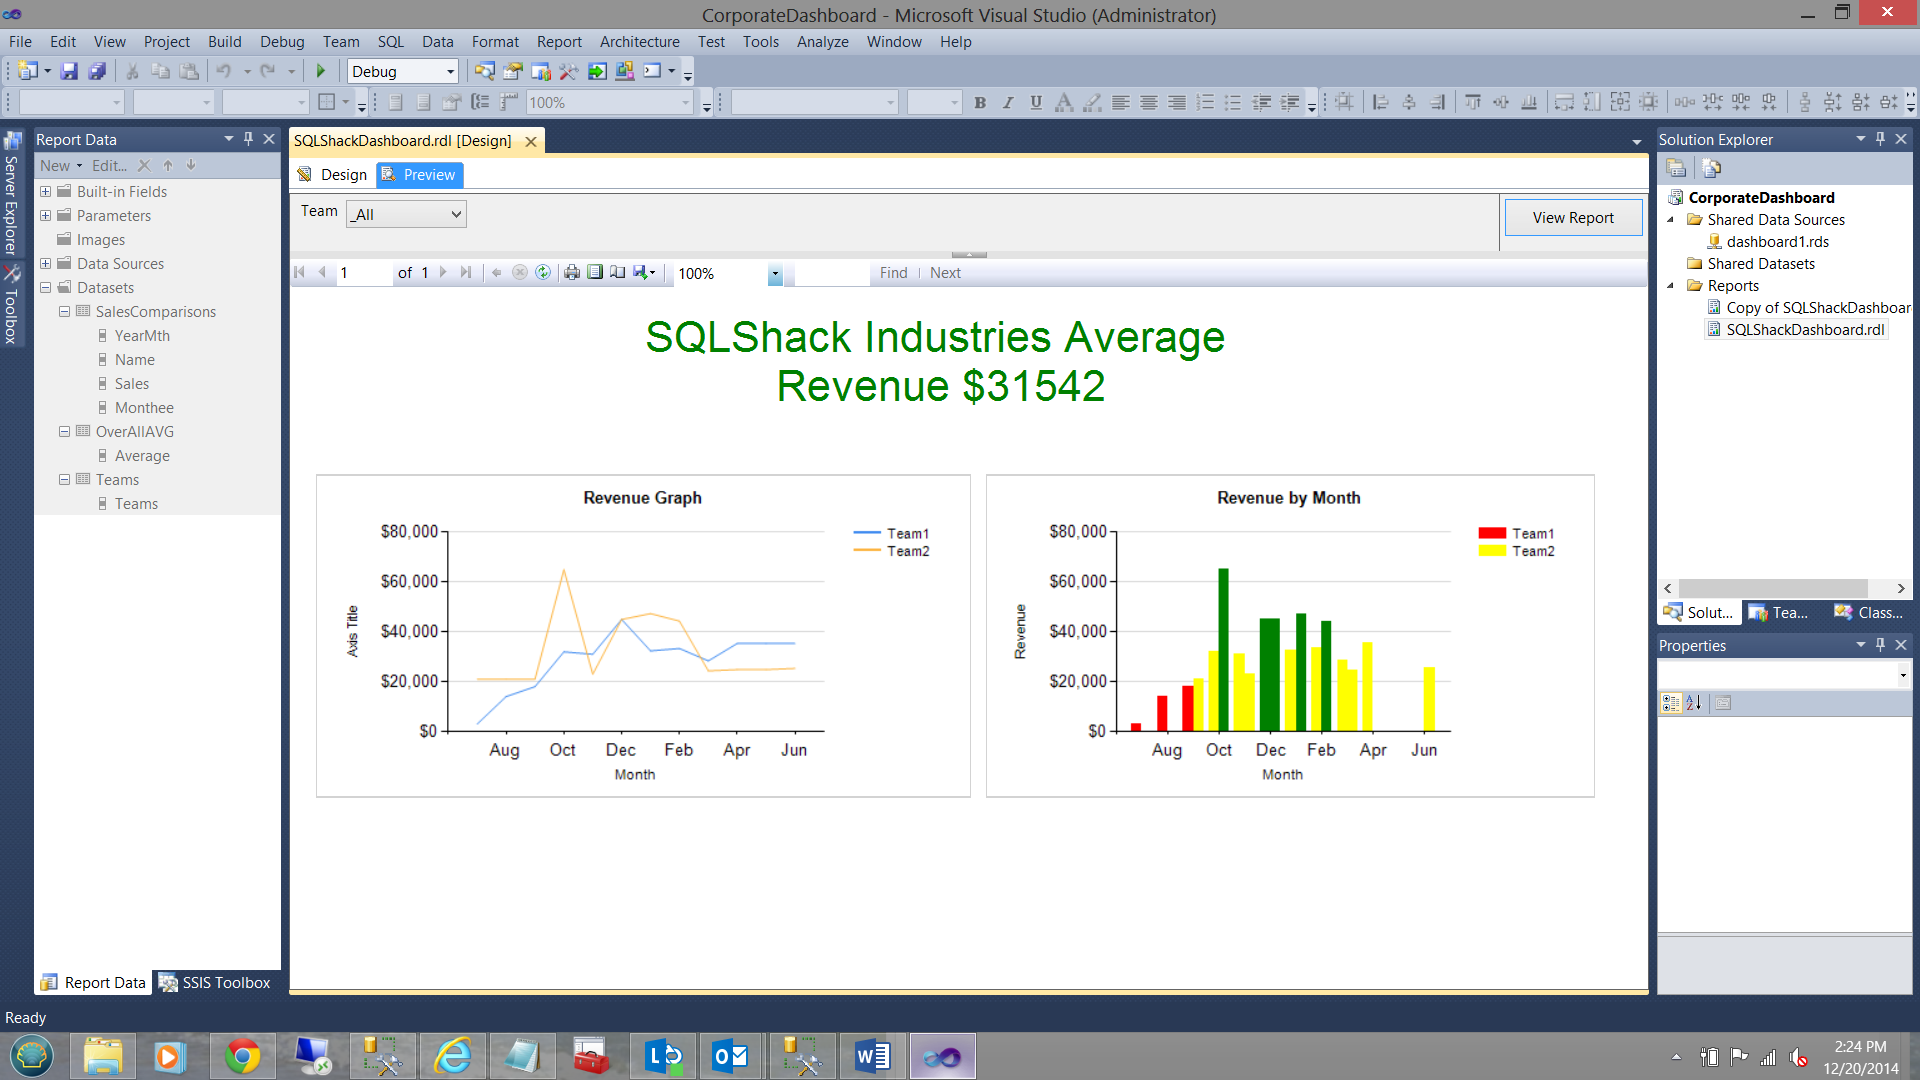
Note that the colors of the vertical bars are NOW based upon the sales revenue and enable SQLShack Industries management to detect any anomalies.
请注意,竖线的颜色现在基于销售收入,并且使SQLShack Industries管理能够检测到任何异常。
创建报告编号3 (Creating Report Number 3)
SQLShack Industries wishes to know at all times what the average income is (throughout the year).They have charged us to display this in some manner.
SQLShack Industries希望随时了解(全年)平均收入。他们已要求我们以某种方式显示此收入。
In order to achieve this we are going to create an additional dataset called “OverAllAvg” (see below).
为了实现这一目标,我们将创建一个名为“ OverAllAvg”的附加数据集(请参见下文)。
The dataset created, we now re-arrange our report controls as shown below: Further, we insert a text box above our charts.
创建了数据集后,我们现在如下所示重新排列报告控件:此外,我们在图表上方插入一个文本框。
After having resized the textbox, I now place the following text into the box.
调整文本框的大小后,现在将以下文本放入框中。
Note the syntax shown in the screen dump above. I am utilizing the first function to retrieve the first value in the dataset. There is one and only one value in the set (in any case).
注意上面屏幕转储中显示的语法。 我正在利用第一个函数来检索数据集中的第一个值 。 集合中只有一个值(无论如何)。
Thus the screen appears as above when the report is run.
因此,运行报告时,屏幕如上所示。
Now management has asked us to enhance the textbox which displays the average value. Should the average value fall below USD 20,000 then the text must be in red, otherwise green. Once again we utilize a variation of the code that we utilized for the vertical bar chart that we discussed above.
现在,管理层已要求我们增强显示平均值的文本框。 如果平均值低于20,000美元,则文本必须为红色,否则为绿色。 我们再次利用了上面讨论的垂直条形图所用代码的变体。
Opening the textbox property box (see below),
打开文本框属性框(如下所示),
we find the “Font” page and select the “Color” expression box. We insert the following code.
我们找到“字体”页面,然后选择“颜色”表达框。 我们插入以下代码。
=Switch (isnothing(first(Fields!Average.Value,"OverAllAVG")) , "LightGrey",first(Fields!Average.Value,"OverAllAVG") < 20000, "Red" ,first(Fields!Average.Value,"OverAllAVG"), "Green")
Now running our report again, we find that the average value is over USD 20,000 as the text is now in green (see below).
现在运行我们的报告,我们再次发现,平均值为超过20,000美元作为文本现在处于绿色(见下文)。
Should I have chosen to make the dividing point between red and green USD 40,000 (see below) then
如果我选择将红色和绿色的界限定为40,000美元(请参阅下文),则
our textbox would appear as follows:
我们的文本框将显示如下:
最后的管理要求 (A last management request)
Management has asked us to cater for the possibility that the staff may wish to view the results for a single team; and also to have the ability to view the results for the whole enterprise.
管理层已要求我们考虑员工可能希望查看一个团队的结果的可能性; 并且有能力查看整个企业的结果。
In order to achieve this, we are going to create one last dataset called “Teams”.
为了实现这一目标,我们将创建一个名为“ Teams”的最后一个数据集。
“Teams” is constructed as shown below:
“团队”的构成如下所示:
The astute reader will note the usage of “_All” as the first portion of the “union all” statement. This give the user the option to view all the results. The usage of the underscore will ensure that the “_All” option occurs at the top of the parameter drop down list.
精明的读者会注意到“ _All”作为“ union all”语句的第一部分的用法。 这使用户可以选择查看所有结果。 下划线的使用将确保“ _All”选项出现在参数下拉列表的顶部。
Next, we create the parameter:
接下来,我们创建参数:
We right click on the Parameters folder and select add a parameter. The parameter dialog box appears and we complete the “General” tab as shown below:
我们右键单击Parameters文件夹,然后选择添加参数。 出现参数对话框,我们完成“常规”选项卡,如下所示:
Moving to the “Available Values” tab, we complete this in the following fashion:
转到“可用值”标签,我们以以下方式完成此操作:
Note that we set the “Select from one of the following options” radio button to “Get values from a query”. The dataset is the “Teams” dataset that we just created. The “Value field” is set to “Team” as is the “Label” field.
请注意,我们将“从以下选项之一中选择”单选按钮设置为“从查询中获取值”。 该数据集是我们刚刚创建的“团队”数据集。 与“标签”字段一样,“值字段”被设置为“团队”。
Thus far, so good.
到目前为止,还不错。
There is one more chore that we have to do and that being to add a predicate / “where clause” to our “SalesComparisions” dataset. Once the user sets the “Team” parameter, only the data for that team will be extracted.
我们还要做另一件事,就是在我们的“ SalesComparisions”数据集中添加一个谓词/“ where子句”。 用户设置“团队”参数后,将仅提取该团队的数据。
The important point being:
重要的一点是:
- Should the user choose “Team1” then the only data that is returned is for Team1.
如果用户选择“ Team1”,则返回的唯一数据是Team1。 - Should the user choose “Team2” then the only data that is returned is for Team2.
如果用户选择“ Team2”,则返回的唯一数据是Team2。 - 3) Should the user choose the “_All” option then all the data is returned.
3)如果用户选择“ _All”选项,则将返回所有数据。
Let us now incorporate a predicate/”where clause” into our “SalesComparisons” dataset.
现在让我们将谓词/“ where子句”合并到我们的“ SalesComparisons”数据集中。
This predicate is as follows:
该谓词如下:
Where (1 = (Case when @Team = ‘_All’ then 1 else 2 end) OR (Name = @Team))
其中(1 =(在@Team ='_All'时为例,然后1否则2结尾)或(Name = @Team)
This requires an explanation. First off, SQL Server will parse from left to right. Should the user have selected the ‘_All’ option, then 1= 1 which is true, parsing stops (the statement to the right of the ‘OR’ is NOT PARSED) and for all intents and purposes nothing is filtered. On the other hand, should a specific team have been selected, then 1 = 2 which is FALSE. With the first part of the “OR” statement being false, then the second part of the predicate is parsed.
这需要一个解释。 首先,SQL Server将从左到右进行解析。 如果用户选择了'_All'选项,则1 = 1,这是正确的,解析停止(“ OR”右边的语句未填充),并且出于所有意图和目的,不进行任何过滤 。 另一方面,如果选择了特定的团队,则1 = 2,即FALSE 。 在“ OR”语句的第一部分为false的情况下,则分析谓词的第二部分。
The dataset definition (with the predicate inserted) may be seen above.
数据集定义(插入谓词)可以在上方看到。
We now add this same predicate to the “OverAllAVG” dataset (see below).
现在,我们将此谓词添加到“ OverAllAVG”数据集(请参见下文)。
Let us now run the report.
现在让我们运行报告。
In the screen dump below, we choose the “_All” option.
在下面的屏幕转储中,我们选择“ _All”选项。
The results for ‘_All ‘values may be seen below.
“ _All”值的结果如下所示。
Should the user have chosen Team 1, then the results would appear as follows:
如果用户选择了Team 1,则结果将显示如下:
The astute reader will note that the Average has changed.
精明的读者会注意到平均值已更改。
Should the user have chosen “Team2”, then the results would appear as follows:
如果用户选择了“ Team2”,那么结果将显示如下:
Our task is now complete and management is extremely happy with what they have obtained.
现在我们的任务已经完成,管理层对他们所获得的成果感到非常满意。
We can now go to the head of the class!!
现在我们可以去上课了!!
结论 (Conclusions)
In today’s “get together” we have seen that linear graphs may be missing data and the plots appear “chopped up”. To overcome this and to smooth out the plot, we created a function that would change the line colour from transparent to another color for whole of the plot. We also saw how we could control the colour of the vertical bars on a bar chart and to develop a new colour scheme dependent upon set criteria such as total monthly sales.
在今天的“聚在一起”中,我们已经看到线性图可能会丢失数据,并且图显示为“切碎”。 为了克服这个问题并平滑绘图,我们创建了一个函数,该函数可以将整个绘图的线条颜色从透明更改为另一种颜色。 我们还看到了如何控制条形图上垂直条的颜色,以及如何根据设定的标准(例如每月总销售额)开发新的配色方案。
We saw how the colour of the text within a text box may also be controlled by the value of some field.
我们看到了文本框内文本的颜色如何也可以由某些字段的值控制。
Last, but not least, we saw how to create a flexible parameter to have the option of viewing all the data or only a select portion of the data.
最后但并非最不重要的一点是,我们看到了如何创建一个灵活的参数来选择查看所有数据或仅选择数据的一部分。
As always, should you have any questions or concerns, please feel free to contact me.
与往常一样,如果您有任何疑问或疑虑,请随时与我联系。
As always, happy programming!
一如既往,快乐编程!
翻译自: https://www.sqlshack.com/create-reports-like-champion-tips-tricks-reporting-services/
像冠军一样创建报告! Reporting Services的提示和技巧相关推荐
- Reporting Services 的伸缩性和性能表现规划(转载)
简介 Microsoft? SQL Server? Reporting Services 是一个将集中管理的报告服务器具有的伸缩性和易管理性与基于 Web 和桌面的报告交付手段集于一身的报告平台.Re ...
- sql server 监视_使用SQL Server Reporting Services进行快速,肮脏的服务器监视
sql server 监视 介绍 (Introduction) A few month back, I found myself in a position where the client want ...
- 如何使用SQL Server Reporting Services将数据格式转换为有价值的数据集
介绍 ( Introduction ) Oft times we are forced into situations where we must clearly think outside of t ...
- 如何在SQL Server Reporting Services中使用表达式来创建有效的报告
介绍 (Introduction) As many of you by now know, I am a fan of utilizing expressions within Reporting S ...
- 如何在SQL Server Reporting Services中自动创建KPI
关键绩效指标(KPI) (Key Performance Indicator (KPI)) A Key Performance Indicator aka KPI is a metric which ...
- 报告正在使用哪些Reporting Services数据集字段?
介绍 ( Introduction ) Have you ever felt like pulling your hair out, trying to ascertain exactly which ...
- 如何使用SQL Server Reporting Services创建图像分类系统
介绍 (Introduction) With Christmas just around the corner, in today's "get together" I thoug ...
- sql2012 ssrs_如何使用SQL Server Reporting Services(SSRS)增强报告
sql2012 ssrs 介绍 (Introduction) A few months ago, I was working on a few SQL Server reports for a cli ...
- 安装和配置SQL Server Reporting Services (SSRS)
目录 什么是SQL Server报告服务(SSRS)? 先决条件 安装SQL Server报告服务(SSRS) 配置SQL Server报告服务 结论 在本文中,我们将在Windows机器上配置Mic ...
最新文章
- 2020 ACM Fellows 名单出炉,13 名华人入选,7 名来自国内!
- 集成服务监控器-green.monitor发布
- Linux下配置使用外部SMTP发邮件
- mysql大于号是否使用索引
- Linux命令 —— 输出一组系统信息(uname -a)
- 多数据源使用spring-data-jpa无法部署到JBoss As Server
- Android开发技巧——自定义控件之自定义属性
- 04 canvas——位移画布和旋转缩放
- word2vec应用场景_word2vec的使用参数解释和应用场景
- i7 6700k linux,i7-6700k超频至4.8G最稳定 i7-6700K开盖液态金属测试
- SweynTooth:这些蓝牙漏洞导致多种设备易受攻击
- java模板和回调机制学习总结
- python运动目标检测_运动目标检测ViBe算法
- 什么时候都要记得:生活愈是往下,嘴角愈要上扬
- 数学分析教程(科大)——1.7笔记+习题
- wpf 语音通话_WPF+WCF一步一步打造音频聊天室(四):视频会话
- 新媒体运营胡耀文教程:短视频+怎么变现?一文读懂4大商业模式
- 通达 php解密,全网首发 | 通达OA多枚0day漏洞分享
- 国内云建设普遍缺失的一环:云管理平台
- vue安装node-sass错误