prometheus + influxdb + grafana + mysql
2019独角兽企业重金招聘Python工程师标准>>> 
前言
本文介绍使用influxdb 作为prometheus持久化存储和使用mysql 作为grafana 持久化存储的安装方法
一 安装go环境
如果自己有go环境可以自主编译remote_storage_adapter插件,安装go环境目的就是为了获得此插件,如果没有go环境可以使用我分享的连接下载。
链接: https://pan.baidu.com/s/1DJpoYDOIfCeAFC6UGY22Xg 提取码: uj42
1 下载
wget https://storage.googleapis.com/golang/go1.8.3.linux-amd64.tar.gz2 安装
tar -C /usr/local -xzf go1.8.3.linux-amd64.tar.gz添加环境变量
vim /etc/profileexport GOROOT=/usr/local/go
export GOBIN=$GOROOT/bin
export GOPKG=$GOROOT/pkg/tool/linux_amd64
export GOARCH=amd64
export GOOS=linux
export GOPATH=/go
export PATH=$PATH:$GOBIN:$GOPKG:$GOPATH/binvim /etc/profilego get -d -v
二 安装 influxdb
1 下载并安装
wget https://dl.influxdata.com/influxdb/releases/influxdb-1.5.2.x86_64.rpmsudo yum localinstall influxdb-1.5.2.x86_64.rpm2 启动influxdb
systemctl start influxdb
systemctl enable influxdb以非服务方式启动
influxd需要指定配置文件的话,可以使用 --config 选项,具体可以help下看看
3 查看相关配置
安装后, 在/usr/bin下面有如下文件
influxd          influxdb服务器
influx           influxdb命令行客户端
influx_inspect   查看工具
influx_stress    压力测试工具
influx_tsm       数据库转换工具(将数据库从b1或bz1格式转换为tsm1格式)
在 /var/lib/influxdb/下面会有如下文件夹
data            存放最终存储的数据,文件以.tsm结尾
meta            存放数据库元数据
wal             存放预写日志文件
配置文件路径 :/etc/influxdb/influxdb.conf
4 创建http接口用于普罗米修斯
如何进入到db中
influx如何创建一个prometheus库http 接口
curl -XPOST http://localhost:8086/query --data-urlencode "q=CREATE DATABASE prometheus"
三 安装prometheus
1 下载
https://prometheus.io/download/2 解压安装
tar xf prometheus-2.8.0.linux-amd64.tar.gzmv prometheus-2.8.0.linux-amd64 /usr/local/prometheuscd /usr/local/prometheus./prometheus --version四 准备remote_storage_adapter
在github上准备一个 remote_storage_adapter 的可执行文件,然后启动它,如果想获取相应的帮助可以使用:./remote_storage_adapter -h来获取相应帮助(修改绑定的端口,influxdb的设置等..),现在我们启动一个remote_storage_adapter来对接influxdb和prometheus:
./remote_storage_adapter -influxdb-url=http://localhost:8086/ -influxdb.database=prometheus -influxdb.retention-policy=autogen,influxdb默认绑定的端口为9201
1 build 插件
/usr/local/go/bin/go get github.com/prometheus/documentation/examples/remote_storage/remote_storage_adapter/2 使用插件
./remote_storage_adapter --influxdb-url=http://127.0.0.1:8086/ --influxdb.database="prometheus" --influxdb.retention-policy=autogen3 修改prometheus文件
vim prometheus.yml
添加:#Remote write configuration (for Graphite, OpenTSDB, or InfluxDB).
remote_write:- url: "http://localhost:9201/write"# Remote read configuration (for InfluxDB only at the moment).
remote_read:- url: "http://localhost:9201/read"
4 启动 prometheus
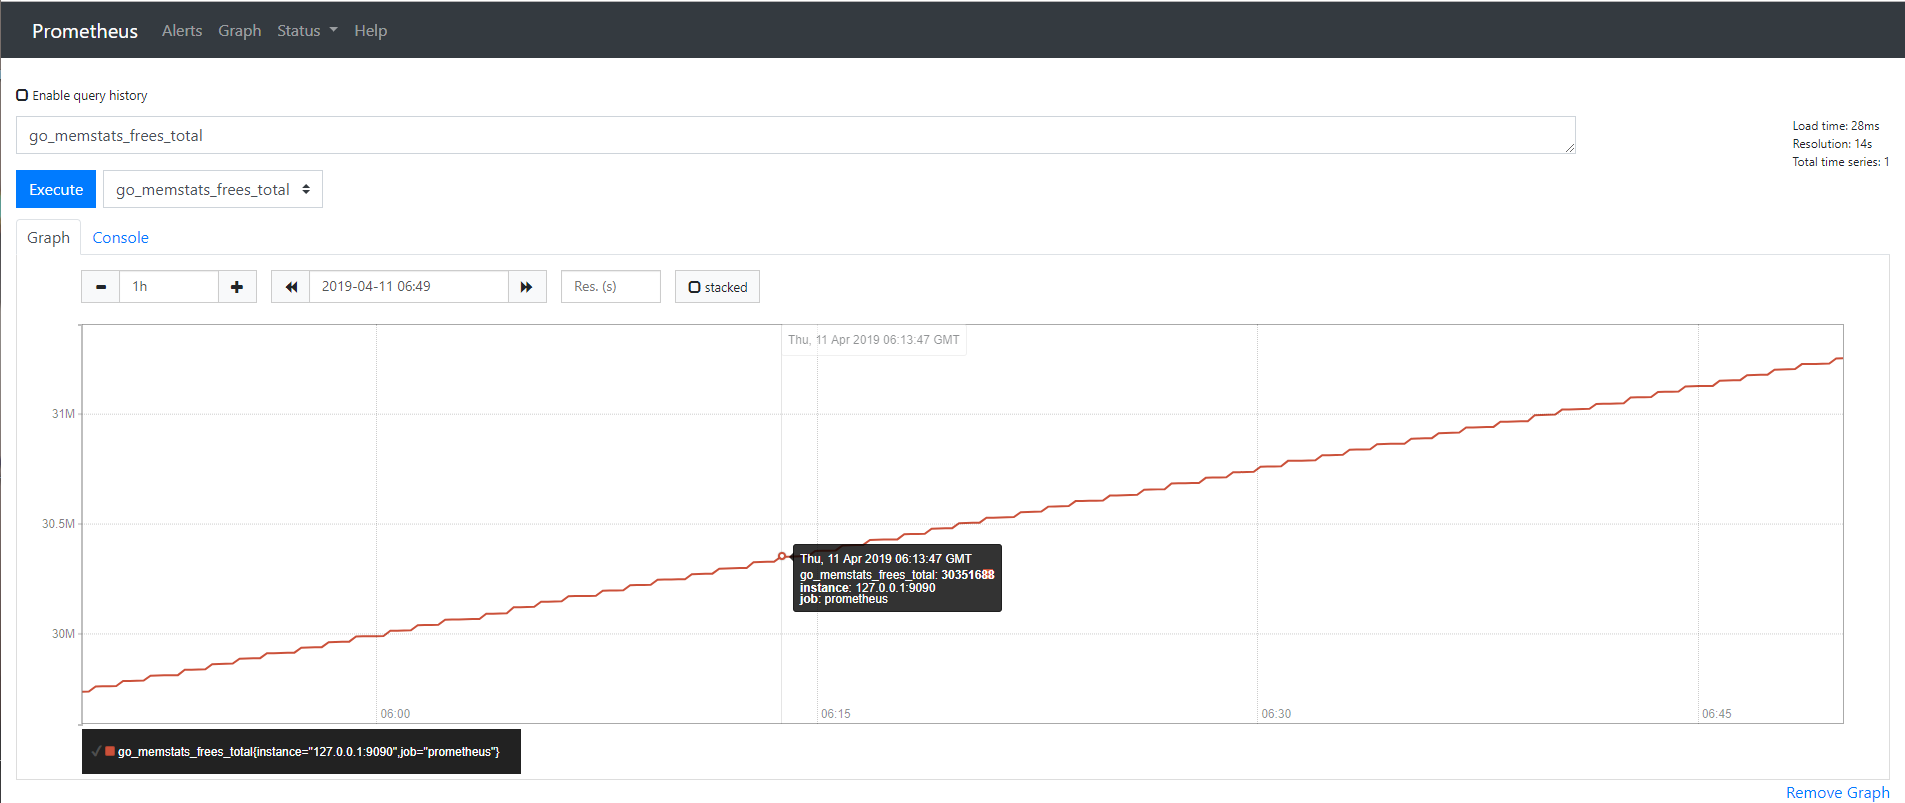
./prometheus5 查看有无数据上报
此时只监控了server本身
6 查看 influxdb 数据库内容
> show databases;
name: databases
name
----
_internal
mydb
prometheus
> use prometheus
Using database prometheus
> SHOW MEASUREMENTS
name: measurements
name
----
go_gc_duration_seconds
go_gc_duration_seconds_count
go_gc_duration_seconds_sum
go_goroutines
go_info
go_memstats_alloc_bytes
go_memstats_alloc_bytes_total
go_memstats_buck_hash_sys_bytes
go_memstats_frees_total
go_memstats_gc_cpu_fraction
go_memstats_gc_sys_bytes
go_memstats_heap_alloc_bytes
go_memstats_heap_idle_bytes
go_memstats_heap_inuse_bytes
go_memstats_heap_objects
go_memstats_heap_released_bytes
go_memstats_heap_sys_bytes
go_memstats_last_gc_time_seconds
go_memstats_lookups_total
go_memstats_mallocs_total
go_memstats_mcache_inuse_bytes
go_memstats_mcache_sys_bytes
go_memstats_mspan_inuse_bytes
go_memstats_mspan_sys_bytes
go_memstats_next_gc_bytes
go_memstats_other_sys_bytes
go_memstats_stack_inuse_bytes
go_memstats_stack_sys_bytes
go_memstats_sys_bytes
go_threads
net_conntrack_dialer_conn_attempted_total
net_conntrack_dialer_conn_closed_total
net_conntrack_dialer_conn_established_total
net_conntrack_dialer_conn_failed_total
net_conntrack_listener_conn_accepted_total
net_conntrack_listener_conn_closed_total
process_cpu_seconds_total
process_max_fds
process_open_fds
process_resident_memory_bytes
process_start_time_seconds
process_virtual_memory_bytes
process_virtual_memory_max_bytes
prometheus_api_remote_read_queries
prometheus_build_info
prometheus_config_last_reload_success_timestamp_seconds
prometheus_config_last_reload_successful
prometheus_engine_queries
prometheus_engine_queries_concurrent_max
prometheus_engine_query_duration_seconds
prometheus_engine_query_duration_seconds_count
prometheus_engine_query_duration_seconds_sum
prometheus_http_request_duration_seconds_bucket
prometheus_http_request_duration_seconds_count
prometheus_http_request_duration_seconds_sum
prometheus_http_response_size_bytes_bucket
prometheus_http_response_size_bytes_count
prometheus_http_response_size_bytes_sum
prometheus_notifications_alertmanagers_discovered
prometheus_notifications_dropped_total
prometheus_notifications_queue_capacity
prometheus_notifications_queue_length
prometheus_remote_storage_dropped_samples_total
prometheus_remote_storage_enqueue_retries_total
prometheus_remote_storage_failed_samples_total
prometheus_remote_storage_highest_timestamp_in_seconds
prometheus_remote_storage_pending_samples
prometheus_remote_storage_queue_highest_sent_timestamp_seconds
prometheus_remote_storage_remote_read_queries
prometheus_remote_storage_retried_samples_total
prometheus_remote_storage_samples_in_total
prometheus_remote_storage_sent_batch_duration_seconds_bucket
prometheus_remote_storage_sent_batch_duration_seconds_count
prometheus_remote_storage_sent_batch_duration_seconds_sum
prometheus_remote_storage_shard_capacity
prometheus_remote_storage_shards
prometheus_remote_storage_succeeded_samples_total
prometheus_rule_evaluation_duration_seconds_count
prometheus_rule_evaluation_duration_seconds_sum
prometheus_rule_evaluation_failures_total
prometheus_rule_evaluations_total
prometheus_rule_group_duration_seconds_count
prometheus_rule_group_duration_seconds_sum
prometheus_rule_group_iterations_missed_total
prometheus_rule_group_iterations_total
prometheus_sd_azure_refresh_duration_seconds_count
prometheus_sd_azure_refresh_duration_seconds_sum
prometheus_sd_azure_refresh_failures_total
prometheus_sd_consul_rpc_duration_seconds_count
prometheus_sd_consul_rpc_duration_seconds_sum
prometheus_sd_consul_rpc_failures_total
prometheus_sd_discovered_targets
prometheus_sd_dns_lookup_failures_total
prometheus_sd_dns_lookups_total
prometheus_sd_ec2_refresh_duration_seconds_count
prometheus_sd_ec2_refresh_duration_seconds_sum
prometheus_sd_ec2_refresh_failures_total
prometheus_sd_file_read_errors_total
prometheus_sd_file_scan_duration_seconds_count
prometheus_sd_file_scan_duration_seconds_sum
prometheus_sd_gce_refresh_duration_count
prometheus_sd_gce_refresh_duration_sum
prometheus_sd_gce_refresh_failures_total
prometheus_sd_kubernetes_cache_last_resource_version
prometheus_sd_kubernetes_cache_list_duration_seconds_count
prometheus_sd_kubernetes_cache_list_duration_seconds_sum
prometheus_sd_kubernetes_cache_list_items_count
prometheus_sd_kubernetes_cache_list_items_sum
prometheus_sd_kubernetes_cache_list_total
prometheus_sd_kubernetes_cache_short_watches_total
prometheus_sd_kubernetes_cache_watch_duration_seconds_count
prometheus_sd_kubernetes_cache_watch_duration_seconds_sum
prometheus_sd_kubernetes_cache_watch_events_count
prometheus_sd_kubernetes_cache_watch_events_sum
prometheus_sd_kubernetes_cache_watches_total
prometheus_sd_kubernetes_events_total
prometheus_sd_marathon_refresh_duration_seconds_count
prometheus_sd_marathon_refresh_duration_seconds_sum
prometheus_sd_marathon_refresh_failures_total
prometheus_sd_openstack_refresh_duration_seconds_count
prometheus_sd_openstack_refresh_duration_seconds_sum
prometheus_sd_openstack_refresh_failures_total
prometheus_sd_received_updates_total
prometheus_sd_triton_refresh_duration_seconds_count
prometheus_sd_triton_refresh_duration_seconds_sum
prometheus_sd_triton_refresh_failures_total
prometheus_sd_updates_total
prometheus_target_interval_length_seconds
prometheus_target_interval_length_seconds_count
prometheus_target_interval_length_seconds_sum
prometheus_target_scrape_pool_reloads_failed_total
prometheus_target_scrape_pool_reloads_total
prometheus_target_scrape_pool_sync_total
prometheus_target_scrape_pools_failed_total
prometheus_target_scrape_pools_total
prometheus_target_scrapes_exceeded_sample_limit_total
prometheus_target_scrapes_sample_duplicate_timestamp_total
prometheus_target_scrapes_sample_out_of_bounds_total
prometheus_target_scrapes_sample_out_of_order_total
prometheus_target_sync_length_seconds
prometheus_target_sync_length_seconds_count
prometheus_target_sync_length_seconds_sum
prometheus_template_text_expansion_failures_total
prometheus_template_text_expansions_total
prometheus_treecache_watcher_goroutines
prometheus_treecache_zookeeper_failures_total
prometheus_tsdb_blocks_loaded
prometheus_tsdb_checkpoint_creations_failed_total
prometheus_tsdb_checkpoint_creations_total
prometheus_tsdb_checkpoint_deletions_failed_total
prometheus_tsdb_checkpoint_deletions_total
prometheus_tsdb_compaction_chunk_range_seconds_bucket
prometheus_tsdb_compaction_chunk_range_seconds_count
prometheus_tsdb_compaction_chunk_range_seconds_sum
prometheus_tsdb_compaction_chunk_samples_bucket
prometheus_tsdb_compaction_chunk_samples_count
prometheus_tsdb_compaction_chunk_samples_sum
prometheus_tsdb_compaction_chunk_size_bytes_bucket
prometheus_tsdb_compaction_chunk_size_bytes_count
prometheus_tsdb_compaction_chunk_size_bytes_sum
prometheus_tsdb_compaction_duration_seconds_bucket
prometheus_tsdb_compaction_duration_seconds_count
prometheus_tsdb_compaction_duration_seconds_sum
prometheus_tsdb_compaction_populating_block
prometheus_tsdb_compactions_failed_total
prometheus_tsdb_compactions_total
prometheus_tsdb_compactions_triggered_total
prometheus_tsdb_head_active_appenders
prometheus_tsdb_head_chunks
prometheus_tsdb_head_chunks_created_total
prometheus_tsdb_head_chunks_removed_total
prometheus_tsdb_head_gc_duration_seconds
prometheus_tsdb_head_gc_duration_seconds_count
prometheus_tsdb_head_gc_duration_seconds_sum
prometheus_tsdb_head_max_time
prometheus_tsdb_head_max_time_seconds
prometheus_tsdb_head_min_time
prometheus_tsdb_head_min_time_seconds
prometheus_tsdb_head_samples_appended_total
prometheus_tsdb_head_series
prometheus_tsdb_head_series_created_total
prometheus_tsdb_head_series_not_found_total
prometheus_tsdb_head_series_removed_total
prometheus_tsdb_head_truncations_failed_total
prometheus_tsdb_head_truncations_total
prometheus_tsdb_lowest_timestamp
prometheus_tsdb_lowest_timestamp_seconds
prometheus_tsdb_reloads_failures_total
prometheus_tsdb_reloads_total
prometheus_tsdb_size_retentions_total
prometheus_tsdb_storage_blocks_bytes
prometheus_tsdb_symbol_table_size_bytes
prometheus_tsdb_time_retentions_total
prometheus_tsdb_tombstone_cleanup_seconds_bucket
prometheus_tsdb_tombstone_cleanup_seconds_count
prometheus_tsdb_tombstone_cleanup_seconds_sum
prometheus_tsdb_vertical_compactions_total
prometheus_tsdb_wal_completed_pages_total
prometheus_tsdb_wal_corruptions_total
prometheus_tsdb_wal_fsync_duration_seconds_count
prometheus_tsdb_wal_fsync_duration_seconds_sum
prometheus_tsdb_wal_page_flushes_total
prometheus_tsdb_wal_truncate_duration_seconds_count
prometheus_tsdb_wal_truncate_duration_seconds_sum
prometheus_tsdb_wal_truncations_failed_total
prometheus_tsdb_wal_truncations_total
prometheus_wal_watcher_current_segment
prometheus_wal_watcher_record_decode_failures_total
prometheus_wal_watcher_records_read_total
prometheus_wal_watcher_samples_sent_pre_tailing_total
promhttp_metric_handler_requests_in_flight
promhttp_metric_handler_requests_total
scrape_duration_seconds
scrape_samples_post_metric_relabeling
scrape_samples_scraped
up
7 向添加一个node节点
下载
wget https://github.com/prometheus/node_exporter/releases/download/v0.17.0/node_exporter-0.17.0.linux-amd64.tar.gz
安装agent
tar xf node_exporter-0.17.0.linux-amd64.tar.gz
cd node_exporter-0.17.0.linux-amd64
./node_exporter
向prometheus 注册节点
vim prometheus.yml scrape_configs下添加- job_name: 'linux-node'         static_configs:- targets: ['10.10.25.149:9100']     labels: instance: node1重启 prometheus
8 将prometheus写成系统服务
cat>/lib/systemd/system/prometheus.service<<EOF
[Service]
Restart=on-failure
WorkingDirectory=/usr/local/prometheus/
ExecStart=/usr/local/prometheus/prometheus --config.file=/usr/local/prometheus/prometheus.yml
[Install]
WantedBy=multi-user.target
EOFchown 644 /lib/systemd/system/prometheus.service
systemctl daemon-reload
systemctl enable prometheus
systemctl start prometheus
systemctl status prometheus
9 将agent写成系统服务
cat>/lib/systemd/system/node_exporter.service<<EOF
[Service]
Restart=on-failure
WorkingDirectory=/root/node_exporter-0.17.0.linux-amd64
ExecStart=/root/node_exporter-0.17.0.linux-amd64/node_exporter
[Install]
WantedBy=multi-user.target
EOFchown 644 /lib/systemd/system/node_exporter.service
systemctl daemon-reload
systemctl enable node_exporter
systemctl start node_exporter
systemctl status node_exporter
10 将remote_storage_adapter注册为系统服务
cat>/lib/systemd/system/remote_storage_adapter.service<<EOF
[Service]
Restart=on-failure
WorkingDirectory=/root/
ExecStart=/root/remote_storage_adapter --influxdb-url=http://127.0.0.1:8086/ --influxdb.database="prometheus" --influxdb.retention-policy=autogen
[Install]
WantedBy=multi-user.target
EOFchown 644 /lib/systemd/system/remote_storage_adapter.service
systemctl daemon-reload
systemctl enable remote_storage_adapter
systemctl start remote_storage_adapter
systemctl status remote_storage_adapter
五 安装 grafana
1 下载
wget https://dl.grafana.com/oss/release/grafana-6.0.2-1.x86_64.rpm2 安装
yum install  grafana-6.0.2-1.x86_64.rpm
systemctl start grafana-server
systemctl enable grafana-server
grafana-server -v grafana-server 监听端口为 3000
3 访问 grafana-server
http://ServerIP:3000
默认用户名密码为: admin admin
六 安装 mysql
1 添加源
rpm -Uvh http://dev.mysql.com/get/mysql-community-release-el7-5.noarch.rpmyum repolist enabled | grep "mysql.*-community.*"2 安装 mysql-5.6
yum -y install mysql-community-server3 启动mysql并简单安全设置
systemctl enable mysqld
systemctl start mysqld
systemctl status mysqldmysql_secure_installation 设置密码一路Y
4 创建grafana 数据库
create database grafana;
create user grafana@'%' IDENTIFIED by 'grafana';
grant all on grafana.* to grafana@'%';
flush privileges;
七 修改grafana默认数据库并配置grafana
1 修改配置文件连接mysql
vim /etc/grafana/grafana.ini[database]
type = mysql
host = 127.0.0.1:3306
name = grafana
user = grafana
password =grafana
url = mysql://grafana:grafana@localhost:3306/grafana[session]
provider = mysql
provider_config = `grafana:grafana@tcp(127.0.0.1:3306)/grafana`
2 重启grafana
systemctl restart grafana-server
3 访问grafana
http://serverip:30004 查看数据库
mysql> show databases;
+--------------------+
| Database           |
+--------------------+
| information_schema |
| grafana            |
| mysql              |
| performance_schema |
+--------------------+
mysql> use grafana
Reading table information for completion of table and column names
You can turn off this feature to get a quicker startup with -ADatabase changed
mysql> show tables;
+--------------------------+
| Tables_in_grafana        |
+--------------------------+
| alert                    |
| alert_notification       |
| alert_notification_state |
| annotation               |
| annotation_tag           |
| api_key                  |
| dashboard                |
| dashboard_acl            |
| dashboard_provisioning   |
| dashboard_snapshot       |
| dashboard_tag            |
| dashboard_version        |
| data_source              |
| login_attempt            |
| migration_log            |
| org                      |
| org_user                 |
| playlist                 |
| playlist_item            |
| plugin_setting           |
| preferences              |
| quota                    |
| server_lock              |
| session                  |
| star                     |
| tag                      |
| team                     |
| team_member              |
| temp_user                |
| test_data                |
| user                     |
| user_auth                |
| user_auth_token          |
+--------------------------+
33 rows in set (0.00 sec)
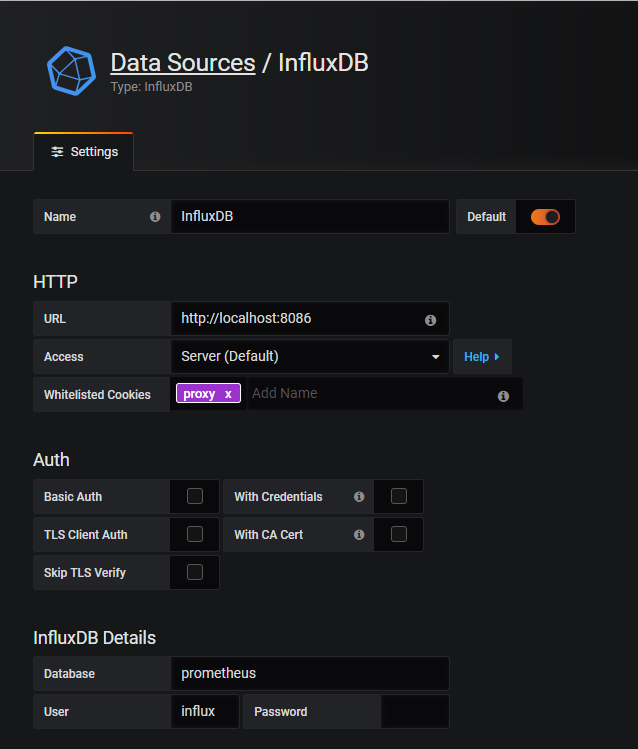
5 配置 grafana 添加数据源
由于使用influxDB作为prometheus的持久化存储,所以添加的influxDB数据源,由于influxDB未设置密码所以此处没有填写密码
转载于:https://my.oschina.net/54188zz/blog/3034788
prometheus + influxdb + grafana + mysql相关推荐
- flink监控prometheus/influxdb + grafana企业实战
本文档为实时计算相关的监控系统的整体说明,记录监控系统相关的部分细节. 监控大盘如图: 功能点 对Flink集群(服务器)进行监控 对源头数据源与目的数据源进行监控 对指标作业进行监控 告警 方案对比 ...
- Docker 下 【Locust 2.8】 + prometheus + influxdb + grafana 性能测试结果采集、监控、数据持久化
环境准备 Docker + Docker Compose 环境已配置好 打包好你的镜像,并且镜像中已经包含了你的测试代码 性能测试结果采集代码 网上 99.99% 的教程都是用这个:https://g ...
- telegraf监控mysql数据库_部署Telegraf+Influxdb+Grafana 架构来监控 MySQL
前段时间小编写了一篇:使用Nginx+Telegraf+Influxb+Grafana构建高逼格Nginx集群监控系统!文章,详细了介绍了 采集器telegraf, 时序数据库influxdb , 数 ...
- grafana+prometheus快速搭建MySql监控系统实践
一.背景 对于LNMP环境下的开发者来说,mysql是非常重要的一环,同时mysql的性能监控也是开发者所需要关注的一环:如果大家使用阿里云的RDS会感觉到其监控功能非常好用,但如果开发者使用的是自建 ...
- Prometheus和Grafana的监控Linux服务器和MYSQL数据库
[使用root用户执行以下操作] 目录 一.安装Prometheus和Grafana 1.安装 Prometheus 1)下载 Prometheus 2)解压安装包 3)启动prometheus 4) ...
- docker-compose 部署jmeter+grafana+prometheus/influxdb,构建性能测试可视化实时监控(二)...
上一节我们已经部署好了grafana,prometheus,influxdb,这一节我们尝试把jmeter+influxdb+grafana打通 打通influxdb+jmeter 首先看我们熟悉的j ...
- 浅谈Telegraf+InfluxDB+Grafana快速搭建简易实时监控系统
监控从来都是一个很宽泛的问题,任何可能出问题的地方都需要加入监控.全量监控的确是监控的终极目标.在搭建一套监控系统前,需要结合实际的系统情况和发展趋势进行考量.在作者看来,一套监控系统应主要由数据采集 ...
- grafana模板_EMQ X + InfluxDB + Grafana:物联网数据监控可视化方案
本文以常见物联网使用场景为例,介绍了如何利用 EMQ X 消息中间件与开源数据可视化方案 InfluxDB + Grafana ,将物联网设备大量基于时序的数据便捷地展示出来. 在物联网项目中接入平台 ...
- 14、Docker监控方案(Prometheus+cAdvisor+Grafana)
上一篇文章我们已经学习了比较流行的cAdvisor+InfluxDB+Grafana组合进行Docker监控.这节课来学习Prometheus+cAdvisor+Grafana组合. cAdvisor ...
最新文章
- 关于程序中数据库报错“父项未找到”
- C# WinForm 弹出模式窗口操作滚动条
- Matlab GUI 设计(4):不同控件之间的数据传递
- [POI2005]BAN-Bank Notes
- 用python实现TCP协议传输功能(客户端代码)
- 圆环划痕检测halcon
- 高校何时开学?教育部回应
- Redis HyperLogLog 是什么?这些场景使用它~
- LINUX smb共享
- 安装运行symfony框架编写的edusoho开源程序
- windows编程 使用C++实现多线程类
- 非标机械设计该怎么做,老机械工程师告诉你
- 如何把Mysql卸载干净?(亲测有效)
- springboot+pagehelper踩坑,PageHelper.startPage没有生效问题
- Timer 和TimerTask分析
- Apriori关联分析算法 -尿布与啤酒的故事
- Origin画图标签常见语法
- 怎么处理视频声音变声?视频声音变声处理软件哪个好?
- c语言单片机自动浇花系统,LLAKG:Arduino 自动浇花系统(第3集:C语言程序升级与功能优化)...
- mysql实现级联操作(级联更新、级联删除)