ChartDirector Python创建建多层甘特图的代码
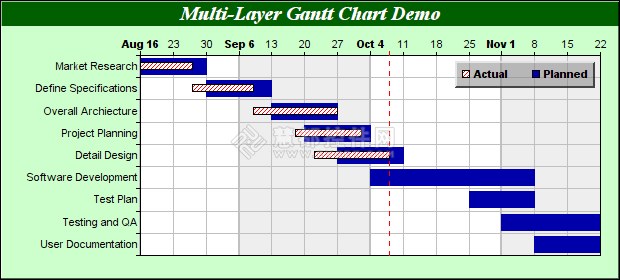
在本文中主要是使用ChartDirector的 Python版本来创建出多层级的甘特图,而在此次的示例演示中将会包含两个图层,包含计划和实际情况的甘特图,XYChart.addBoxWhiskerLayer 创建的两个图层,使用BaseBoxLayer.s制作etDataWidth来进行在栏的顶部的图层的宽度的设置,以便它不会挡住底部的图层。
具体示例的源代码如下,和大家一起分享分享:
#!/usr/bin/python
from pychartdir import *# the names of the tasks
labels = ["Market Research", "Define Specifications", "Overall Archiecture","Project Planning", "Detail Design", "Software Development", "Test Plan","Testing and QA", "User Documentation"]# the planned start dates and end dates for the tasks
startDate = [chartTime(2004, 8, 16), chartTime(2004, 8, 30), chartTime(2004, 9, 13),chartTime(2004, 9, 20), chartTime(2004, 9, 27), chartTime(2004, 10, 4),chartTime(2004, 10, 25), chartTime(2004, 11, 1), chartTime(2004, 11, 8)]
endDate = [chartTime(2004, 8, 30), chartTime(2004, 9, 13), chartTime(2004, 9, 27),chartTime(2004, 10, 4), chartTime(2004, 10, 11), chartTime(2004, 11, 8),chartTime(2004, 11, 8), chartTime(2004, 11, 22), chartTime(2004, 11, 22)]# the actual start dates and end dates for the tasks up to now
actualStartDate = [chartTime(2004, 8, 16), chartTime(2004, 8, 27), chartTime(2004, 9,9), chartTime(2004, 9, 18), chartTime(2004, 9, 22)]
actualEndDate = [chartTime(2004, 8, 27), chartTime(2004, 9, 9), chartTime(2004, 9, 27), chartTime(2004, 10, 2), chartTime(2004, 10, 8)]# Create a XYChart object of size 620 x 280 pixels. Set background color to light
# green (ccffcc) with 1 pixel 3D border effect.
c = XYChart(620, 280, 0xccffcc, 0x000000, 1)# Add a title to the chart using 15 points Times Bold Itatic font, with white
# (ffffff) text on a dark green (0x6000) background
c.addTitle("Multi-Layer Gantt Chart Demo", "timesbi.ttf", 15, 0xffffff).setBackground(0x006000)# Set the plotarea at (140, 55) and of size 460 x 200 pixels. Use alternative
# white/grey background. Enable both horizontal and vertical grids by setting their
# colors to grey (c0c0c0). Set vertical major grid (represents month boundaries) 2
# pixels in width
c.setPlotArea(140, 55, 460, 200, 0xffffff, 0xeeeeee, LineColor, 0xc0c0c0, 0xc0c0c0).setGridWidth(2, 1, 1, 1)# swap the x and y axes to create a horziontal box-whisker chart
c.swapXY()# Set the y-axis scale to be date scale from Aug 16, 2004 to Nov 22, 2004, with ticks
# every 7 days (1 week)
c.yAxis().setDateScale(chartTime(2004, 8, 16), chartTime(2004, 11, 22), 86400 * 7)# Add a red (ff0000) dash line to represent the current day
c.yAxis().addMark(chartTime(2004, 10, 8), c.dashLineColor(0xff0000, DashLine))# Set multi-style axis label formatting. Month labels are in Arial Bold font in "mmm
# d" format. Weekly labels just show the day of month and use minor tick (by using
# '-' as first character of format string).
c.yAxis().setMultiFormat(StartOfMonthFilter(), "<*font=arialbd.ttf*>{value|mmm d}",StartOfDayFilter(), "-{value|d}")# Set the y-axis to shown on the top (right + swapXY = top)
c.setYAxisOnRight()# Set the labels on the x axis
c.xAxis().setLabels(labels)# Reverse the x-axis scale so that it points downwards.
c.xAxis().setReverse()# Set the horizontal ticks and grid lines to be between the bars
c.xAxis().setTickOffset(0.5)# Use blue (0000aa) as the color for the planned schedule
plannedColor = 0x0000aa# Use a red hash pattern as the color for the actual dates. The pattern is created as
# a 4 x 4 bitmap defined in memory as an array of colors.
actualColor = c.patternColor([0xffffff, 0xffffff, 0xffffff, 0xff0000, 0xffffff,0xffffff, 0xff0000, 0xffffff, 0xffffff, 0xff0000, 0xffffff, 0xffffff, 0xff0000,0xffffff, 0xffffff, 0xffffff], 4)# Add a box whisker layer to represent the actual dates. We add the actual dates
# layer first, so it will be the top layer.
actualLayer = c.addBoxLayer(actualStartDate, actualEndDate, actualColor, "Actual")# Set the bar height to 8 pixels so they will not block the bottom bar
actualLayer.setDataWidth(8)# Add a box-whisker layer to represent the planned schedule date
c.addBoxLayer(startDate, endDate, plannedColor, "Planned").setBorderColor(SameAsMainColor)# Add a legend box on the top right corner (595, 60) of the plot area with 8 pt Arial
# Bold font. Use a semi-transparent grey (80808080) background.
b = c.addLegend(595, 60, 0, "arialbd.ttf", 8)
b.setAlignment(TopRight)
b.setBackground(0x80808080, -1, 2)# Output the chart
c.makeChart("layergantt.png")
参考资料:ChartDirector教程
转载于:https://blog.51cto.com/datavisual/1302160
ChartDirector Python创建建多层甘特图的代码相关推荐
- python编程例子 输入 输出-推荐 :手把手教你用Python创建简单的神经网络(附代码)...
原标题:推荐 :手把手教你用Python创建简单的神经网络(附代码) 作者:Michael J.Garbade:翻译:陈之炎:校对:丁楠雅 本文共2000字,9分钟. 本文将为你演示如何创建一个神经网 ...
- python用Matplotlib画甘特图
说明 使用Matplotlib画甘特图,思想是使用条形图绘制. 关键点,使用plt.barh(y,data,left=()) y是条形图的位置,data是条形图的大小,left是条形图坐标的距离.,具 ...
- 独家 | 手把手教你用Python创建简单的神经网络(附代码)
作者:Michael J.Garbade 翻译:陈之炎 校对:丁楠雅 本文共2000字,建议阅读9分钟. 本文将为你演示如何创建一个神经网络,带你深入了解神经网络的工作方式. 了解神经网络工作方式的最 ...
- python简单代码-手把手教你用Python创建简单的神经网络(附代码)
了解神经网络工作方式的***途径莫过于亲自创建一个神经网络,本文将演示如何做到这一点. 神经网络(NN)又称人工神经网络(ANN),是机器学习领域中基于生物神经网络概念的学习算法的一个子集. 拥有五年 ...
- #python二维列表(有图有代码,简洁清晰明了!)
二维列表 由于列表元素可以是列表,所以在python中也支持二维列表. 二维列表中的信息以行和列的形式表示,第一个下标代表元素所在的行,第二个下标代表元素所在的列. 在python中创建二维列表有以下 ...
- python创建包含双引号的字符串代码_python 字符串组成MySql 命令时,字符串含有单引号或者双引号导致出错解决办法...
引用自:https://blog.csdn.net/zhaoya_huangqing/article/details/48036839 一.在组成SQL语句并发送命令时完全按照Python中的样式去传 ...
- gantt/甘特图完整代码(带注释,可以复制)
官网地址:Gantt : Samples 效果图: 代码: <!DOCTYPE html> <html><head><meta charset="u ...
- 使用Python画作业调度甘特图
文章目录 一.背景 二.方案比较 Matplotlib方案 Plotly方案 三.实现方案 以柔性作业调度问题用例MK01的最佳调度图 未使用annotations进行配置修改画图效果 Matlab方 ...
- python动态横道图_python的matplotlib.pyplot绘制甘特图
博主本来就想简单地找一下代码,画一幅甘特图,结果百度之后发现甘特图的代码基本都不是用matplotlib库,但是像柱状图等统计图通常都是用这个库进行绘制的,所以博主就花了一些时间,自己敲了一份代码,简 ...
最新文章
- page分页问题,根据页码获取对应页面的数据,接口调用
- 由【说说JSON和JSONP..】博文,想到的MVC 扩展
- boost::grid_graph用法的测试程序
- php mysql errorcode_PHP MySQL错误设置
- XMLHelper 辅助类
- 20.23 20.4 20.5告警系统邮件引擎(上中下);20.26 运行告警系统
- 机器学习Machine Learning学习笔记——回归Regression
- html页面最大化最小化设置,网页窗口最大化快捷键 改变窗口大小的快捷键是什么...
- 中国第一,全球领先的「浪潮」:用智慧计算征服的计算力天下
- js使用Canvas将多张图片合并成一张
- Linux下更新Chrome和vscode
- Matter(CHIP) 目录和平台相关的文件
- 【转载】 中国婚礼 项目流程
- 百度百家号作者昵称、ID、粉丝数量获取
- 超微服务器查型号,超微 云服务器
- pdf怎么压缩文件到最小?如何将pdf压缩到指定大小?压缩pdf文件大小怎么压缩?如何压缩pdf大小?
- win10 Bat脚本获取管理员权限
- WampServer修改MySQL密码
- Linux进程的详细内容
- Go语言基础实战视频教程-欧阳桫-专题视频课程