Telegraf 简单使用介绍
Telegraf 使用说明
本文档提供了 telegraf 的简单配置说明,其中:
配置多个配置文件的示例,可参见章节 配置多个配置文件示例
常用的输入插件(mysql、redis、prometheus)配置可参见 附录说明
Telegraf 简述
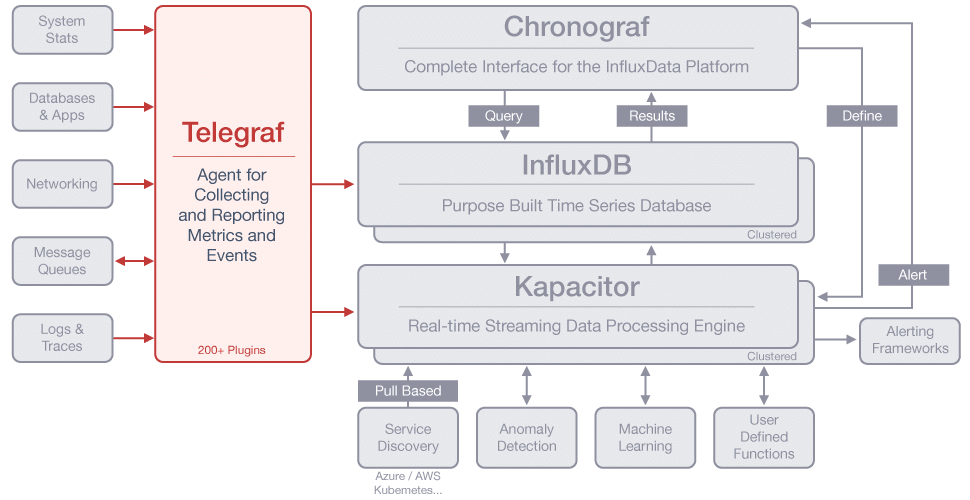
Telegraf 是收集和报告指标和数据的代理。
Telegraf是TICK Stack的一部分,是一个插件驱动的服务器代理,用于收集和报告指标。
Telegraf 集成了直接从其运行的容器和系统中提取各种指标,事件和日志,从第三方API提取指标,甚至通过StatsD和Kafka消费者服务监听指标。
它还具有输出插件,可将指标发送到各种其他数据存储,服务和消息队列,包括InfluxDB,Graphite,OpenTSDB,Datadog,Librato,Kafka,MQTT,NSQ等等。
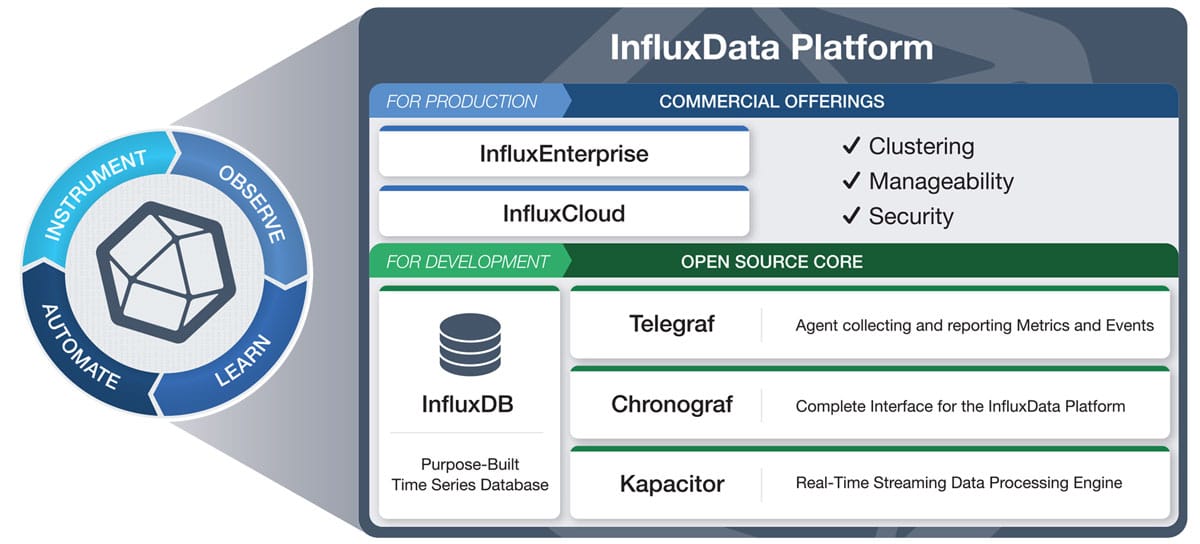
注意: 群集仅适用于InfluxEnterprise和InfluxCloud - 比较版本。
InfluxDB不同版本比较:
插件网址
Telegraf 部署和配置
部署
下载
Download Page
yum 安装
wget https://dl.influxdata.com/telegraf/releases/telegraf-1.8.3-1.x86_64.rpm
使用 yum 命令安装
sudo yum install telegraf
sudo service telegraf start
二进制安装
wget https://dl.influxdata.com/telegraf/releases/telegraf-1.8.3_linux_amd64.tar.gz
tar xvfz telegraf-1.8.3_linux_amd64.tar.gz
选择其中一种部署方式即可
生成配置文件
可执行文件在 usr/bin/telegraf,配置文件在/etc/telegraf目录下,也可直接配置生成
查看帮助
telegraf --help
生成配置文件
telegraf config > telegraf-mysql.conf # 比如在当前目录下生成mysql相关的配置文件
建议生成的配置放置在
/etc/telegraf/telegraf.d目录下
生成指定输入和输出插件的配置文件
telegraf --input-filter <pluginname>[:<pluginname>] --output-filter <outputname>[:<outputname>] config > telegraf.conf
例如,生成带 cpu、memroy、disk、diskio、net 和 influxdb 插件的配置文件 telegraf.conf,指定输出到 influxdb 和 opentsdb
telegraf --input-filter cpu:mem:disk:diskio:net --output-filter influxdb:opentsdb config > telegraf.conf
也可使用默认的配置文件
telegraf --input-filter cpu:mem:http_listener --output-filter influxdb config
telegraf 支持读取多个配置文件,可将多个配置文件放置在
/etc/telegraf/telegraf.d目录下
测试配置是否成功
示例
# 测试 /etc/telegraf/telegraf.conf 配置文件中输入 cpu 配置是否正确
telegraf  -config /etc/telegraf/telegraf.conf -input-filter cpu -test
# 测试 /etc/telegraf/telegraf.conf 输出 influxdb 配置是否正确
telegraf  -config /etc/telegraf/telegraf.conf -output-filter influxdb -test
# 测试 /etc/telegraf/telegraf.d/mysql.conf 输入 cpu 和 输出 influxdb 配置是否正确
telegraf  -config /etc/telegraf/telegraf.d/mysql.conf -input-filter cpu  -output-filter influxdb -test
配置正确的话,会输出当前时间戳的配置指标和值;
配置错误的话,会显示错误信息;
其他测试配置文件方法可以类比以上示例
查看 telegraf 的日志
telegraf 日志目录 /var/log/telegraf/telegraf.log
配置文件保存修改后,记得要重启 telegraf
# 重启 telegraf 服务,使配置文件生效
service telegraf restart
# Linux 不同系统服务的启动方式不同
systemctl start telegraf
Note: Telegraf will start automatically using the default configuration when installed from a deb package.
/etc/telegraf/telegraf.dis the default directory of configuration files.
配置多个配置文件示例
步骤:
生成配置文件
配置输入输出插件
修改配置文件中输入输出插件具体内容
在 /etc/telegraf/telegraf.d 生成其他插件的配置文件(如需要配置多个配置文件)
测试配置文件是否配置正确
重启 telegraf
# 例子:配置 os 和 redis 采集的配置文件
# 配置 os
cd /etc/telegraf
# 1.生成配置文件(将配置文件权限更改为777,以免出现报错)
telegraf config > telegraf.conf
chmod 777 telegraf.conf
# 2.在指定配置文件中添加输入输出插件相关的配置
telegraf --input-filter cpu:mem:disk:diskio:net --output-filter influxdb:opentsdb config > telegraf.conf
# 3.修改配置文件内容
vim telegraf.conf
# 4.<配置多个配置文件> 如,配置 redis
cd /etc/telegraf/telegraf.d
telegraf config > redis.conf
chmod 777 telegraf.conf
telegraf --input-filter redis --output-filter opentsdb:influxdb config > redis.conf
vim redis.conf
# 5.测试配置文件是否配置正确
telegraf -config redis.conf --input-filter redis --output-filter opentsdb:influxdb -test
# 6.重启 telegraf
service telegraf restart
其中以 redis.conf 配置内容为例,说明需要配置的内容
###############################################################################
# INPUT PLUGINS #
###############################################################################
# Read metrics from one or many redis servers
[[inputs.redis]]## specify servers via a url matching:## [protocol://][:password]@address[:port]## e.g.## tcp://localhost:6379## tcp://:password@192.168.99.100## unix:///var/run/redis.sock#### If no servers are specified, then localhost is used as the host.## If no port is specified, 6379 is used#servers = ["tcp://localhost:6379"]# 配置 Redis 环境的地址servers = ["tcp://10.132.49.128:6379"]
## specify server password# password = "s#cr@t%"
## Optional TLS Config# tls_ca = "/etc/telegraf/ca.pem"# tls_cert = "/etc/telegraf/cert.pem"# tls_key = "/etc/telegraf/key.pem"## Use TLS but skip chain & host verification# insecure_skip_verify = true
###############################################################################
# OUTPUT PLUGINS #
###############################################################################
# Configuration for OpenTSDB server to send metrics to
[[outputs.opentsdb]]## prefix for metrics keys# opentsdb 输出的 metric 的前缀prefix = "telegraf.redis."
## DNS name of the OpenTSDB server## Using "opentsdb.example.com" or "tcp://opentsdb.example.com" will use the## telnet API. "http://opentsdb.example.com" will use the Http API.host = "10.128.2.97"
## Port of the OpenTSDB serverport = 44242
## Number of data points to send to OpenTSDB in Http requests.## Not used with telnet API.http_batch_size = 50
## URI Path for Http requests to OpenTSDB.## Used in cases where OpenTSDB is located behind a reverse proxy.http_path = "/api/put"
## Debug true - Prints OpenTSDB communicationdebug = false# Configuration for sending metrics to InfluxDB
[[outputs.influxdb]]## The full HTTP or UDP URL for your InfluxDB instance.#### Multiple URLs can be specified for a single cluster, only ONE of the## urls will be written to each interval.# urls = ["unix:///var/run/influxdb.sock"]# urls = ["udp://127.0.0.1:8089"]urls = ["http://127.0.0.1:8086"]
## The target database for metrics; will be created as needed.database = "telegraf"
## If true, no CREATE DATABASE queries will be sent. Set to true when using## Telegraf with a user without permissions to create databases or when the## database already exists.# skip_database_creation = false
## Name of existing retention policy to write to. Empty string writes to## the default retention policy. Only takes effect when using HTTP.# retention_policy = ""
## Write consistency (clusters only), can be: "any", "one", "quorum", "all".## Only takes effect when using HTTP.# write_consistency = "any"
## HTTP Basic Authusername = "admin"password = "admin"
## HTTP User-Agent# user_agent = "telegraf"
## UDP payload size is the maximum packet size to send.# udp_payload = 512
## Optional TLS Config for use on HTTP connections.# tls_ca = "/etc/telegraf/ca.pem"# tls_cert = "/etc/telegraf/cert.pem"# tls_key = "/etc/telegraf/key.pem"## Use TLS but skip chain & host verification# insecure_skip_verify = false
## HTTP Proxy override, if unset values the standard proxy environment## variables are consulted to determine which proxy, if any, should be used.# http_proxy = "http://corporate.proxy:3128"
## Additional HTTP headers# http_headers = {"X-Special-Header" = "Special-Value"}
具体其他配置含义见附录说明
附录说明
每一个input插件配置文件内容不同,具体插件配置项可参看 Telegraf plugins
mysql 输入插件配置内容
############################################################################### # INPUT PLUGINS # ############################################################################### # Read metrics from one or many mysql servers [[inputs.mysql]]## specify servers via a url matching:## [username[:password]@][protocol[(address)]]/[?tls=[true|false|skip-verify|custom]]## see https://github.com/go-sql-driver/mysql#dsn-data-source-name## e.g.## servers = ["user:passwd@tcp(127.0.0.1:3306)/?tls=false"]## servers = ["user@tcp(127.0.0.1:3306)/?tls=false"]### If no servers are specified, then localhost is used as the host.servers = ["root@tcp(127.0.0.1:3306)/"] ## Selects the metric output format.#### This option exists to maintain backwards compatibility, if you have## existing metrics do not set or change this value until you are ready to## migrate to the new format.#### If you do not have existing metrics from this plugin set to the latest## version.#### Telegraf >=1.6: metric_version = 2## <1.6: metric_version = 1 (or unset)metric_version = 2 ## the limits for metrics form perf_events_statementsperf_events_statements_digest_text_limit = 120perf_events_statements_limit = 250perf_events_statements_time_limit = 86400### if the list is empty, then metrics are gathered from all databasee tablestable_schema_databases = []### gather metrics from INFORMATION_SCHEMA.TABLES for databases provided above listgather_table_schema = false### gather thread state counts from INFORMATION_SCHEMA.PROCESSLISTgather_process_list = true### gather user statistics from INFORMATION_SCHEMA.USER_STATISTICSgather_user_statistics = true### gather auto_increment columns and max values from information schemagather_info_schema_auto_inc = true### gather metrics from INFORMATION_SCHEMA.INNODB_METRICSgather_innodb_metrics = true### gather metrics from SHOW SLAVE STATUS command outputgather_slave_status = true### gather metrics from SHOW BINARY LOGS command outputgather_binary_logs = false### gather metrics from PERFORMANCE_SCHEMA.TABLE_IO_WAITS_SUMMARY_BY_TABLEgather_table_io_waits = false### gather metrics from PERFORMANCE_SCHEMA.TABLE_LOCK_WAITSgather_table_lock_waits = false### gather metrics from PERFORMANCE_SCHEMA.TABLE_IO_WAITS_SUMMARY_BY_INDEX_USAGEgather_index_io_waits = false### gather metrics from PERFORMANCE_SCHEMA.EVENT_WAITSgather_event_waits = false### gather metrics from PERFORMANCE_SCHEMA.FILE_SUMMARY_BY_EVENT_NAMEgather_file_events_stats = false### gather metrics from PERFORMANCE_SCHEMA.EVENTS_STATEMENTS_SUMMARY_BY_DIGESTgather_perf_events_statements = false### Some queries we may want to run less often (such as SHOW GLOBAL VARIABLES)interval_slow = "30m" ## Optional TLS Config (will be used if tls=custom parameter specified in server uri)# tls_ca = "/etc/telegraf/ca.pem"# tls_cert = "/etc/telegraf/cert.pem"# tls_key = "/etc/telegraf/key.pem"## Use TLS but skip chain & host verification# insecure_skip_verify = false
按照自己实际需要对照说明进行修改
redis 输入插件
############################################################################### # INPUT PLUGINS # ############################################################################### # Monitor process cpu and memory usage [[inputs.procstat]]## PID file to monitor process#pid_file = "/var/run/nginx.pid"# 配置需要监控的进程的 PID 文件目录pid_file = "/var/run/grafana-server.pid"## executable name (ie, pgrep <exe>)# exe = "nginx"## pattern as argument for pgrep (ie, pgrep -f <pattern>)# pattern = "nginx"## user as argument for pgrep (ie, pgrep -u <user>)# user = "nginx"## Systemd unit name# systemd_unit = "nginx.service"## CGroup name or path# cgroup = "systemd/system.slice/nginx.service" ## override for process_name## This is optional; default is sourced from /proc/<pid>/status# process_name = "bar" ## Field name prefix# prefix = "" ## Add PID as a tag instead of a field; useful to differentiate between## processes whose tags are otherwise the same. Can create a large number## of series, use judiciously.# pid_tag = false ## Method to use when finding process IDs. Can be one of 'pgrep', or## 'native'. The pgrep finder calls the pgrep executable in the PATH while## the native finder performs the search directly in a manor dependent on the## platform. Default is 'pgrep'# pid_finder = "pgrep"
Prometheus 输入插件
############################################################################### # INPUT PLUGINS # ############################################################################### # Read metrics from one or many prometheus clients [[inputs.prometheus]]## An array of urls to scrape metrics from.#urls = ["http://localhost:9100/metrics"]# 配置 prometheus 的接口地址urls = ["http://10.132.49.114:9104/metrics"] ## An array of Kubernetes services to scrape metrics from.# kubernetes_services = ["http://my-service-dns.my-namespace:9100/metrics"] ## Use bearer token for authorization# bearer_token = /path/to/bearer/token ## Specify timeout duration for slower prometheus clients (default is 3s)# response_timeout = "3s" ## Optional TLS Config# tls_ca = /path/to/cafile# tls_cert = /path/to/certfile# tls_key = /path/to/keyfile## Use TLS but skip chain & host verification# insecure_skip_verify = false
其他配置文件说明
Agent 配置
Telegraf有一些可以在配置[agent]部分下配置的选项。
interval:所有输入的默认数据收集间隔
round_interval:将收集间隔舍入为“interval”例如,如果interval =“10s”则始终收集于:00,:10,:20等。
metric_batch_size:Telegraf将指标发送到大多数
metric_batch_size指标的批量输出。metric_buffer_limit:Telegraf将缓存
metric_buffer_limit每个输出的指标,并在成功写入时刷新此缓冲区。这应该是倍数,metric_batch_size不能少于2倍metric_batch_size。collection_jitter:集合抖动用于随机抖动集合。每个插件在收集之前将在抖动内随机休眠一段时间。这可以用来避免许多插件同时查询sysfs之类的东西,这会对系统产生可测量的影响。
flush_interval:所有输出的默认数据刷新间隔。您不应将此设置为以下间隔。最大值
flush_interval为flush_interval+flush_jitterflush_jitter:将刷新间隔抖动一个随机量。这主要是为了避免运行大量Telegraf实例的用户出现大量写入峰值。例如,
flush_jitter5s和flush_interval10s之一意味着每10-15秒就会发生一次冲洗。precision:默认情况下,precision将设置为与收集时间间隔相同的时间戳顺序,最大值为1s。精度不会用于服务输入,例如
logparser和statsd。有效值为ns,us(或µs)ms,和s。logfile:指定日志文件名。空字符串表示要登录
stderr。debug:在调试模式下运行Telegraf。
quiet:以安静模式运行Telegraf(仅限错误消息)。
hostname:覆盖默认主机名,如果为空使用
os.Hostname()。omit_hostname:如果为true,则不
host在Telegraf代理中设置标记。
Input 配置
以下配置参数可用于所有输入:
interval:收集此指标的频率。普通插件使用单个全局间隔,但是如果一个特定输入应该运行得更少或更频繁,则可以在此处进行配置。
name_override:覆盖度量的基本名称。(默认为输入的名称)。
name_prefix:指定附加到度量名称的前缀。
name_suffix:指定附加到度量名称的后缀。
tags:要应用于特定输入测量的标签映射。
Aggregator 配置
以下配置参数可用于所有聚合器:
period:刷新和清除每个聚合器的时间段。聚合器将忽略在此时间段之外使用时间戳发送的所有度量标准。
delay:刷新每个聚合器之前的延迟。这是为了控制聚合器在从输入插件接收度量标准之前等待多长时间,如果聚合器正在刷新并且输入在相同的时间间隔内收集。
drop_original:如果为true,聚合器将丢弃原始度量标准,并且不会将其发送到输出插件。
name_override:覆盖度量的基本名称。(默认为输入的名称)。
name_prefix:指定附加到度量名称的前缀。
name_suffix:指定附加到度量名称的后缀。
tags:要应用于特定输入测量的标签映射。
Processor 配置
以下配置参数可用于所有处理器:
order:这是执行处理器的顺序。如果未指定,则处理器执行顺序将是随机的。
Measurement filtering (测量过滤)
可以根据输入,输出,处理器或聚合器配置过滤器,请参阅下面的示例。
namepass:一个glob模式字符串数组。仅发出测量名称与此列表中的模式匹配的点。
命名工作:逆转
namepass。如果找到匹配,则丢弃该点。这是在通过namepass测试后的点上测试的。fieldpass:一个glob模式字符串数组。仅发出其字段键与此列表中的模式匹配的字段。不适用于输出。
fielddrop:逆的
fieldpass。具有匹配其中一个模式的字段键的字段将从该点中丢弃。不适用于输出。tagpass:将标记键映射到glob模式字符串数组的表。仅发出表中包含标记键的点和与其模式之一匹配的标记值。
tagdrop:逆的
tagpass。如果找到匹配,则丢弃该点。这是在通过tagpass测试后的点上测试的。taginclude:一个glob模式字符串数组。仅发出具有与其中一个模式匹配的标签键的标签。相反
tagpass,它将根据其标记传递整个点,taginclude从该点移除所有不匹配的标记。此滤波器可用于输入和输出,但 建议在输入上使用,因为在摄取点过滤掉标签更有效。tagexclude:倒数
taginclude。具有与其中一个模式匹配的标记键的标记将从该点被丢弃。
注意: 由于解析TOML的方式,tagpass并且tagdrop必须在插件定义的末尾定义参数,否则后续插件配置选项将被解释为tagpass / tagdrop表的一部分。
Influxdb 数据库建立
如果想利用telegraf采集数据并保存到 influxdb 中,influxdb必须存在数据库。
influxdb 创建数据库步骤如下,如需认证可设置用户名密码。
创建influxdb用户和数据库
[root@localhost~]# influx ## 创建用户密码 > create user "telegraf" with password 'password' > show users; user admin telegraf false ## 创建数据库 > CREATE DATABASE telegraf; > show databases name: databases --------------- name _internal telegraf ## 退出 > exit
测试 telegraf 是否成功采集数据并存入数据源
以 influxdb 数据源为例,利用 grafana 显示采集指标
特别注意:当服务器时钟和浏览器时钟不一致时,会造成显示时间不正确;
[http://docs.influxdata.com/telegraf/v1.8/plugins/]:
Telegraf 简单使用介绍相关推荐
- matlab整型和浮点的区别,技术帖 | 心理学MATLAB初学者教程--简单数据类型介绍(逻辑型数据,整型/浮点型数据,字符型)......
1.2.1 什么是变量和变量名 变量这个词似乎在许多地方都有出现,在计算机中变量是指是一段有名字的连续存储空间(摘自百度百科),而这个所谓的名字就叫做变量名.举个例子说现在我们再MATLAB的命令窗口 ...
- 拨测工具_您可以拨多少钱? 快速简单地介绍有用的工具。
拨测工具 by Miguel Bustamante 通过Miguel Bustamante 您可以卷曲多少? 快速简单地介绍有用的工具. (How much can you cURL? A quick ...
- tcpdump的简单选项介绍
tcpdump采用命令行方式,它的命令格式为: tcpdump [ -AdDeflLnNOpqRStuUvxX ] [ -c count ] [ -C file_size ] [ -F file ] ...
- eve模拟器华为镜像_EVE-NG简单入门介绍
此篇文章简单的介绍下模拟器EVE-NG的使用,具体包括Dynamips设备导入与运行,IOL设备的导入与运行,QEMU设备的导入与运行,客户端软件的安装,物理网络与虚拟网络的结合等. 一.导入镜像 D ...
- linux学习-简单命令介绍及安装VMware Tools
常用简单命令介绍 ethernet以太网 pts:模拟终端 图形界面: Ctrl+Alt+F1 字符界面:Ctrl+Alt+F2-F6 切换虚拟终端:(本机操作) # chvt 1-6 关闭图形界面, ...
- CSS实验案例02简单专业介绍网页
文章目录 CSS实验案例02简单专业介绍网页 2.1CSS 2.2HTML CSS实验案例02简单专业介绍网页 2.1CSS body {/* 主体*/font-size: 24px;text-ali ...
- linux下录音识别成文字软件,如何将录音转换成文字?录音转文字简单方法介绍...
如何将录音转换成文字?录音转文字简单的方法是什么?很多小伙伴对录音转文字,文字阿欢语音方便的需求还是蛮大的,因为它对我们的帮助还是蛮大的,可以快速把录制好的录音转换成文字,并且还有实时翻译功能,下面给 ...
- PDF是如何在线分割的?简单方法介绍
PDF在线分割的简单方法介绍,我们是怎么在线分割的呢?在PDF文件中我们可以进行文件的分割,下面小编就简单给打击介绍一下将PDF文件在线分割的方法. PDF文件在线分割的简单方法是直接在线分割,可以进 ...
- linux 运行eve,EVE-NG简单入门介绍
此篇文章简单的介绍下模拟器EVE-NG的使用,具体包括Dynamips设备导入与运行,IOL设备的导入与运行,QEMU设备的导入与运行,客户端软件的安装,物理网络与虚拟网络的结合等. 导入镜像 Dyn ...
最新文章
- 初识Tcl(十):Tcl 过程
- PGA Usage Larger than PGA_AGGREGATE_TARGET setting?
- 一个关于sql server索引与填充因子的链接
- 7-46 新浪微博热门话题 (30 分)(思路+详解+set + map)pta逐个点过的 来呀兄弟们
- 云原生高可用技术体系构建
- Maven入门详解与安装配置
- php 加日志,添加日志的相关内容推荐
- Linux多台主机互相免密登陆
- § 1.3 简 单 的 Java程 序
- Roguelike游戏-《灾前世界》个人游戏策划案
- [现代控制理论]8.5_线性控制器设计_轨迹跟踪simulink
- java判断一个数是否为素数的程序_java如何判断一个数是否为素数
- python词云词频分析_Python词云(词频统计,掩膜显示)
- 面试HR常问的几个问题?
- 一站式解决网站死链问题
- linux打不开vlc怎么办下面是解决方法
- 音乐外链生成php,如何使用php生成短链接网址 第三方API
- linux离线安装jemalloc,jemalloc在linux上从安装到使用
- 平面设计简化布局的要点是什么
- MATLAB中的一些小技巧 - [MATLAB]
热门文章
- 【USB笔记】 USB2.0 包格式 握手包Handshake Packets
- FileNotFoundException open failed: XXXXXXX EPERM (Operation not permitted)的坑
- python太阳花代码_python太阳花绘制代码教程
- FL Studio20.9中文版最详细的安装激活教程
- Hihocoder 顺子
- diskman 恢复分区表找到数据
- Python中常见字符串去除字符串空格的方法
- 十一、高斯混合模型(Gaussian Mixed Model, GMM)
- 单细胞算法-聚类-louvain算法
- 罗克韦尔自动化牵手FBS2017 推动中国食品饮料行业“智”变