power bi数据分析_Power BI数据模型:使用关系
power bi数据分析
In this article, we look at how to create different types of relationships between two or more tables in the Power BI data model.
在本文中,我们研究如何在Power BI数据模型中的两个或多个表之间创建不同类型的关系。
Anyone who has worked with a relational database management system knows that tables are related to each other via foreign key constraints. Table relationships are implemented to normalize the database, which is crucial to data integrity and avoids data duplication.
使用关系数据库管理系统的任何人都知道表是通过外键约束相互关联的。 表关系的实现是为了规范化数据库,这对数据完整性至关重要,并且避免了数据重复。
There are four main types of relationships between database tables: One to Many, Many to One, Many to Many, and One to One. A full explanation of these types is beyond the scope of this article. See Learn SQL: Types of relations article for a full explanation.
数据库表之间的关系主要有四种类型:一对多,多对一,多对多和一对一。 这些类型的完整说明超出了本文的范围。 有关完整说明,请参见学习SQL:关系类型一文。
创建一个虚拟数据集 (Creating a dummy dataset)
In this section, a dummy dataset will be created in SQL Server. In the next section, you will see how to connect Power BI with SQL Server and then import the dummy dataset into Power BI. We will create a simple database for a fictional book store. The name of the database will be the BookStore.
在本节中,将在SQL Server中创建一个虚拟数据集。 在下一节中,您将看到如何将Power BI与SQL Server连接,然后将虚拟数据集导入Power BI。 我们将为一个虚构的书店创建一个简单的数据库。 数据库的名称将为BookStore。
For details of creating a dummy dataset, please refer to the ‘Creating A Dummy Database’ section of SQL JOIN TABLES: Working with Queries in SQL Server
有关创建虚拟数据集的详细信息,请参考SQL JOIN TABLES:在SQL Server中使用查询的“创建虚拟数据库”部分。
将自动检测关系设置为False (Setting Autodetect Relationships to False)
By default, depending upon the column names of the table, Power BI may assume relationships between different tables by default. We do not want that.
默认情况下,根据表的列名,默认情况下,Power BI可能会假定不同表之间的关系。 我们不想要那样。
To disable this option, on Power BI Desktop, go to “File -> Options & Settings -> Options” as shown below:
要禁用此选项,在Power BI Desktop上,转到“文件->选项和设置->选项”,如下所示:
From the dialogue box that appears, uncheck the option “Autodetect new relationships after data is loaded” option as shown in the following screenshot:
在出现的对话框中,取消选中“加载数据后自动检测新关系”选项,如以下屏幕截图所示:
将Power BI与SQL Server连接 (Connecting Power BI with SQL Server)
We have created a dummy dataset; the next step is to connect Power BI with SQL Server and then to import the BookStore dataset into Power BI. To see the detailed explanation for how to connect Power BI with SQL Server, have a look at this article.
我们创建了一个虚拟数据集; 下一步是将Power BI与SQL Server连接,然后将BookStore数据集导入Power BI。 要查看有关如何将Power BI与SQL Server连接的详细说明,请参阅本文 。
在Power BI数据模型中实现关系 (Implementing Relationships in the Power BI Data Model)
It is extremely easy to create relationships between two or more tables in a Power BI data model.
在Power BI数据模型中的两个或多个表之间创建关系非常容易。
Let’s first see the effect on the visualization when there is no relationship between tables.
首先让我们看看表之间没有关系时对可视化的影响。
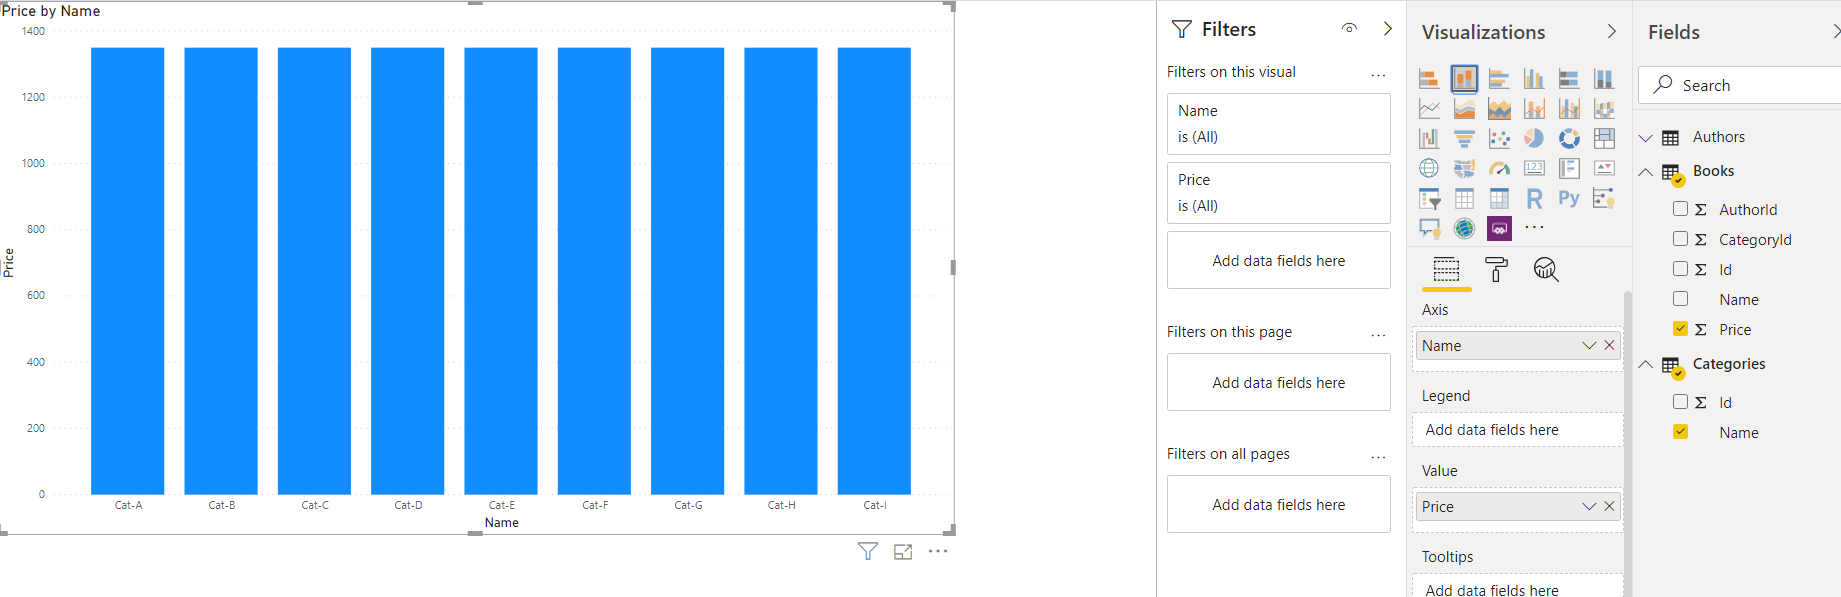
In the figure below, we plot a “Stacked Bar” chart where the x-axis contains the names from the Categories table and the bars correspond to the price of the book. Since there is no relationship between the Books and Categories columns currently in our Power BI data model the bars show the total price for all the books against all the category names. We want to show the price of books per category. To do so, we need to define a relationship between Books and Categories tables:
在下图中,我们绘制了一个“堆积条形图”,其中x轴包含“类别”表中的名称,而条形图对应于该书的价格。 由于当前在Power BI数据模型中的“书籍和类别”列之间没有关系,因此条形图显示了所有书籍相对于所有类别名称的总价。 我们想显示每个类别的书籍价格。 为此,我们需要定义Book和Categories表之间的关系:
To define a relationship, click the “Manage Relationships” option from the top menu as shown below:
要定义关系,请从顶部菜单中单击“管理关系”选项,如下所示:
You should see the following window. Since there no relationship exists between the tables in the dataset, the window is empty:
您应该看到以下窗口。 由于数据集中的表之间不存在任何关系,因此该窗口为空:
Click the “New” button from the above window to create a new relationship.
在上面的窗口中单击“新建”按钮以创建新的关系。
In this window select the first table from the dropdown list at the top and then click on the column name on which you want to implement the relationship. In the figure below, we select “Categories” as the first table name and “Id” as the column name.
在此窗口中,从顶部的下拉列表中选择第一个表,然后单击要在其上实现关系的列名。 在下图中,我们选择“类别”作为第一个表名,并选择“ Id”作为列名。
From the second dropdown list, we select the “Books” column and select “CategoryId” as the column used to implement a one-to-many relationship between “Categories” and “Books” table.
从第二个下拉列表中,选择“ Books”列,然后选择“ CategoryId”作为用于实现“类别”和“ Books”表之间的一对多关系的列。
Finally, you need to specify the type of relationship via the cardinality dropdown list, which in our case will be “One to Many”. Look at the following figure for reference:
最后,您需要通过基数下拉列表指定关系的类型,在本例中为“一对多”。 请看下图以供参考:
Once you click the “Ok” button, you will see that your bar stacked plot will be updated automatically to reflect the new relationship. Now you can see the price of books per category:
单击“确定”按钮后,您将看到条形图将自动更新以反映新的关系。 现在,您可以查看每个类别的图书价格:
Another way to implement a relationship between two entities in a Power BI data model is by going to the “Relationship” view, which is the third option in the vertical list of options on the left-hand side of Power BI. The option is highlighted in yellow in the following screenshot:
在Power BI数据模型中实现两个实体之间关系的另一种方法是转到“关系”视图,这是Power BI左侧选项垂直列表中的第三个选项。 在以下屏幕截图中,该选项以黄色突出显示:
Once you click the relationship view, you will see the following window:
单击关系视图后,将看到以下窗口:
You can see the new relationship between the “Books” and “Categories” table that we just created in our Power BI data model.
您可以看到我们刚刚在Power BI数据模型中创建的“ Books”表和“ Categories”表之间的新关系。
As is the case above, sometimes the relationship might not be located so that it is lined up precisely between two fields. If you are ever unsure and want to quickly check a relationship, remember when you click on the relationship line will then be able to see that fields that are part of the relationship as they will be highlighted in yellow.
与上面的情况一样,有时可能没有找到该关系,以使它在两个字段之间精确地对齐。 如果您不确定并想快速检查关系,请记住,当您单击关系行时,将以黄色突出显示该关系中的字段。
To create a one-to-many relationship between the Authors and Books tables, click where “Id” shows below “Authors” and drag it to the “AuthorId” column of the books table. Once you do that, you should see a relationship between Authors and Books as well, as shown below:
要在“作者”和“书”表之间创建一对多关系,请单击“作者”下方显示“ Id”的位置,然后将其拖到“书”表的“ AuthorId”列中。 完成此操作后,您还将看到作者与书籍之间的关系,如下所示:
结论 (Conclusion)
Relational databases contain relationships between multiple tables. Power BI also allows you to create similar relations in the Power BI data model. In this article, you saw how to implement relationships between multiple entities in the Power BI data model and how to quickly check that you have connected the correct fields.
关系数据库包含多个表之间的关系。 Power BI还允许您在Power BI数据模型中创建类似的关系。 在本文中,您了解了如何在Power BI数据模型中实现多个实体之间的关系,以及如何快速检查是否已连接正确的字段。
翻译自: https://www.sqlshack.com/the-power-bi-data-model-working-with-relationships/
power bi数据分析
power bi数据分析_Power BI数据模型:使用关系相关推荐
- power bi 实时_Power BI中的实时流
power bi 实时 The concept of the IOT (Internet of Things) is that every object that you might think of ...
- power bi图表_Power BI中的图表类型概述
power bi图表 In this article, I am going to give an overview of the most widely used chart types in Po ...
- 155_模型_Power BI Power Pivot 进销存之安全库存
155_模型_Power BI & Power Pivot 进销存之安全库存 一.背景 谈进销存的概念时,我们也需要提及另外一个概念:安全库存. 库存周转在理想的状态下是做到零库存,但是在内部 ...
- 微软认证BI专家雷元带你全面搞定Power BI数据分析
如同当年迎接计算机的发展.互联网的冲击那样,数据将成为第一生产力.我们要如何迎接数据时代的来临? 作为一个普通人,我们如何能走在这场数字变革的前端,又如何去掌握数据分析的能力? 资深数据分析师雷元告诉 ...
- 【好书推荐】Power BI数据分析从入门到进阶
2022年新书出版,人生第一本书,厚积薄发,写这本书前,积累了十年,看了同类30本书,越来越有写一本书的强烈念头.<Power BI数据分析从入门到进阶>机械工业出版社5月出版,欢迎大家支 ...
- 数据分析软件python 对电脑的要求-用于数据分析的BI工具还是python?
有许多数据分析方法,包括使用当前流行的敏捷BI工具以及直接使用Python,R等进行处理,但它方便,快捷且易于使用. 当然,建议在PC端安装和使用BI时使用敏捷BI工具. 这些工具包括Tableua, ...
- 178_技巧_Power BI 动态排名多项展示
178_技巧_Power BI 动态排名多项展示 一.背景 在 Power BI 中做排名矩阵时,我们经常遇到同一维度下,多项展示排名的问题.类似这样的排名矩阵,排名的名次不会太多,但是同一维度下会有 ...
- 169_技巧_Power BI 依据促销日历计算销售金额
169_技巧_Power BI 依据促销日历计算销售金额 一.背景 在各位表格表姐们计算销售金额的时候,有一个绕不开的问题:商品有促销的问题,需要使用对应的促销价来计算销售额. 按照惯例还是先来看看结 ...
- powerbi如何创建参数_Power BI中参数的用法
首先看下参数的类型,可以是小数.日期.时间.文本.逻辑值.二进制:这么多类型都支持,那么用处就大了. 前边文章介绍过,参数用作制作动态的日期表,可以改变日期表的区间范围. 这个就是用的日期类型. 最近 ...
最新文章
- github上好的c语言项目,2019 github热门项目
- 华为交换机路由器常用命令
- 20150720 Two heads are better than one
- [react] 如果组件的属性没有传值,那么它的默认值是什么?
- vue 中 created 和 mounted 钩子生命周期 问题
- jqgrid 批量启动所有行为可编辑状态
- Second easyui框架学习
- ASCSDK-------通用包接入文档(COCOS篇)
- 推荐:jQuery提示插件qTip2
- 前端开发技术难点汇总(一)
- 歌谷服务套件gms_谷歌gms框架安装器下载-安卓9谷歌服务框架app安装-游戏大玩家...
- Cameralink协议
- wps设置页码,从某一页重新开始编号
- 人工智能的十大应用方向是哪些?
- css box-sizing
- 如何写好科研论文2021期末考试答案
- torch_points_kernels遭遇 ModuleNotFoundError: No module named ‘torch_points_kernels.points_cpu‘
- 如何选择优化器 optimizer
- xshell连接linux系统
- PHP导出Excel 数字变成科学计数法解决方法